
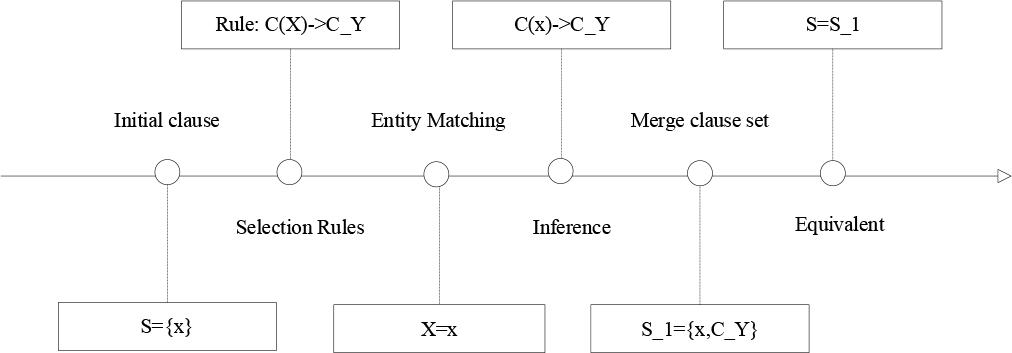
Figure 1.
Principle of Resolution
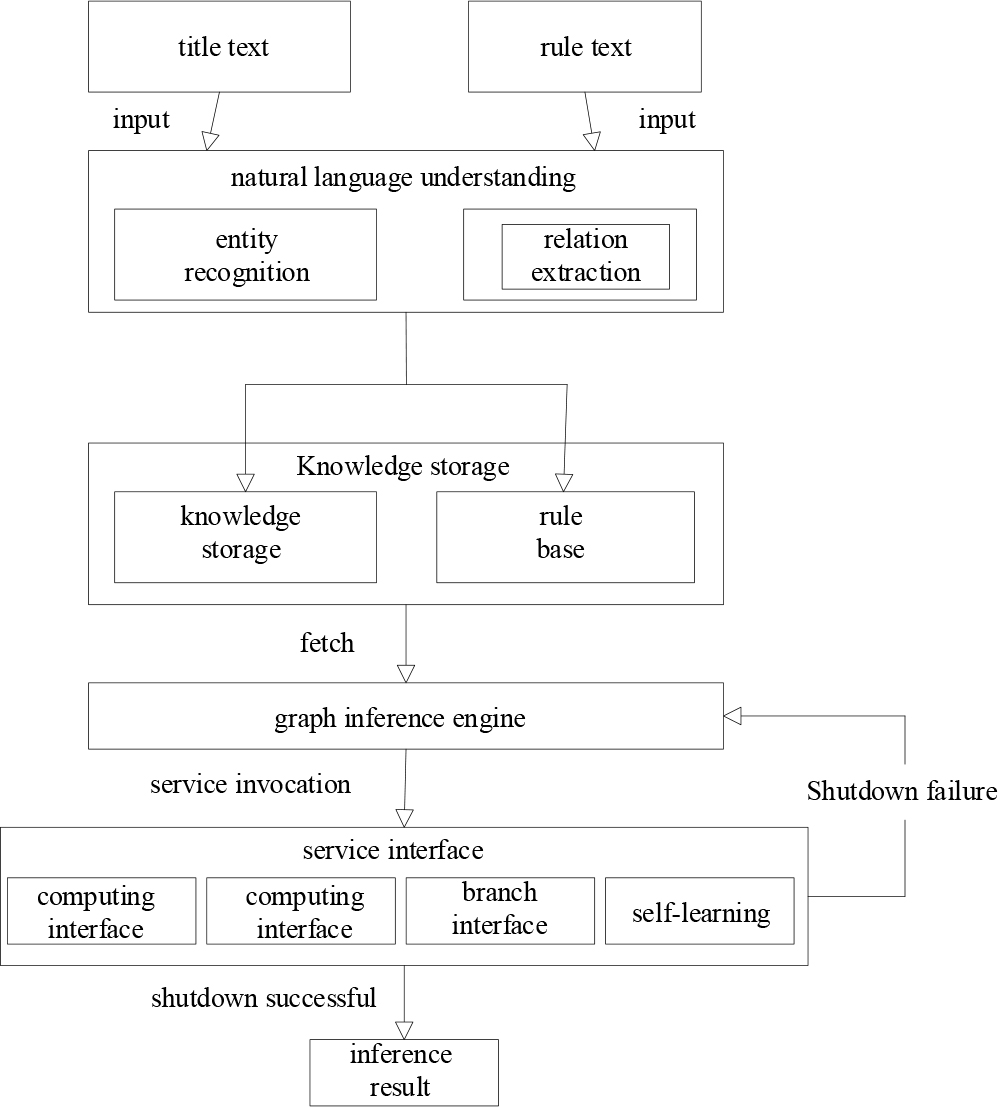
Figure 2.
Overall design of the system
TABLE I.
Rule structuring
| member name | data structure | describe |
|---|---|---|
| label | String | unique identification of the rule |
| ruleTriple | List<GraphTriple> | regular triplet |
| conclusionTriples | List<GraphTriple> | rule conclusion triplet |
| instantiatedCategory | String | Rule classification |
| instantiatedDescription | String | Simple description of rules |
| commonText | String | Regular mathematical text |
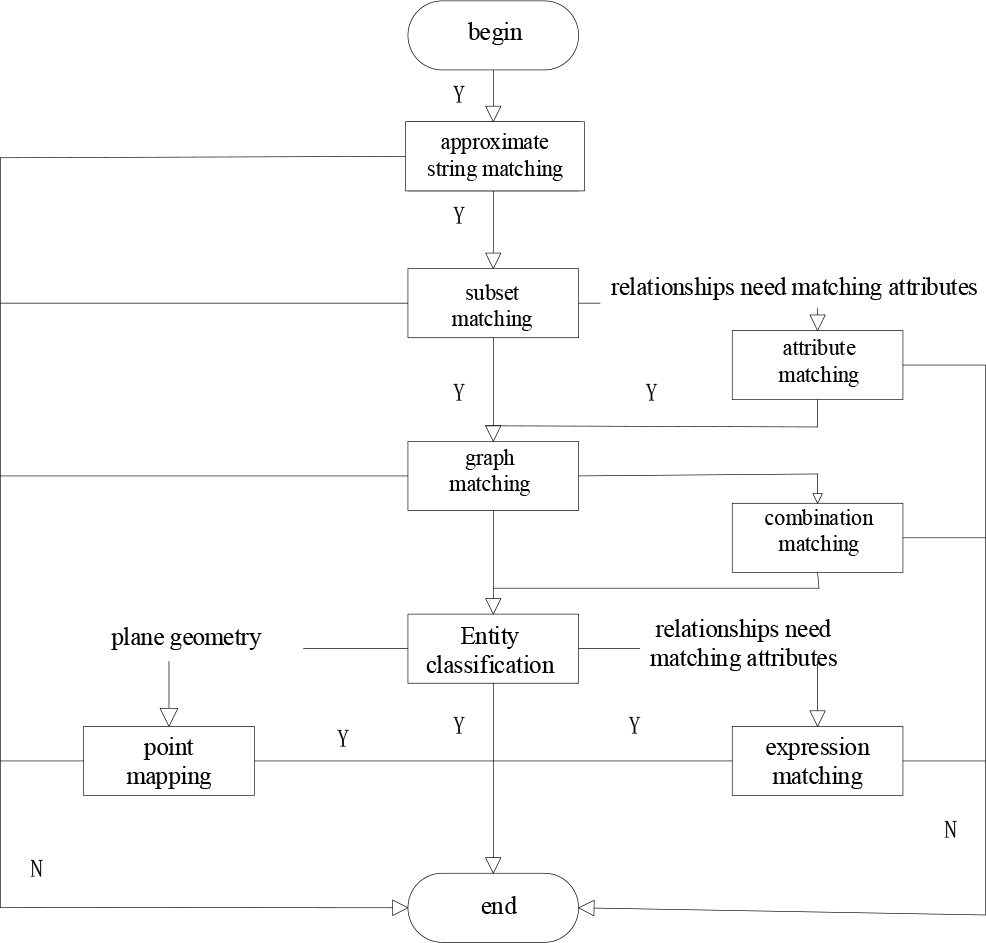
Figure 3.
Matching Process
TABLE II.
EXPERIMENTAL ENVIRONMENT
| Component | Details |
|---|---|
| Hardware | Intel(R) Core(TM) i7-3770 CPU |
| 16GB RAM | |
| 1.5T hard disk | |
| Software | Windows 10 |
| Java development platform IDEA | |
| Graph database Neo4j | |
| Symbolic computation platform Maple |
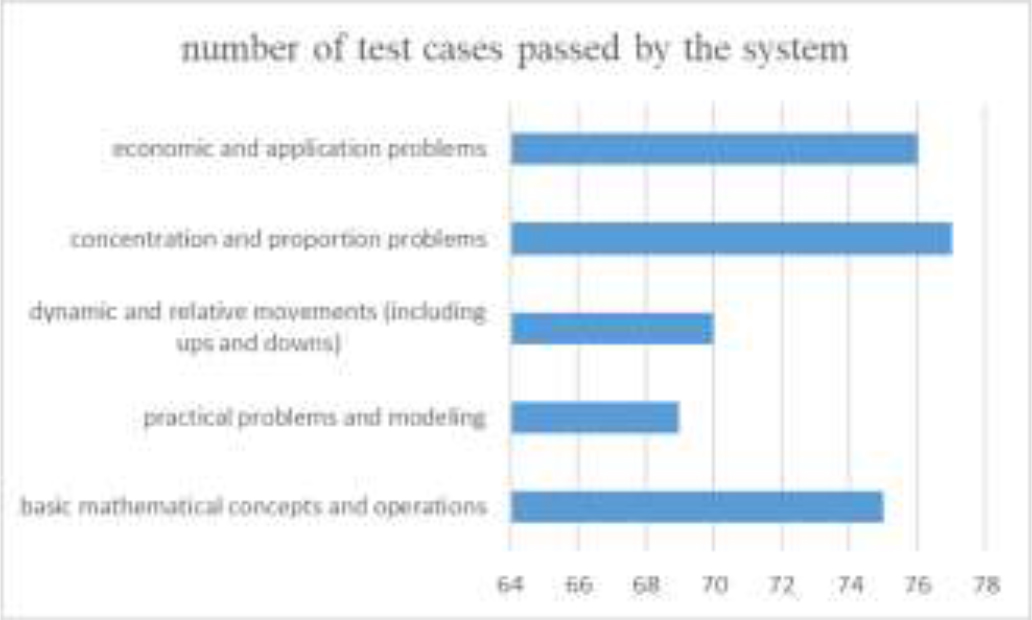
Figure 4.
Number of test cases passed by the system
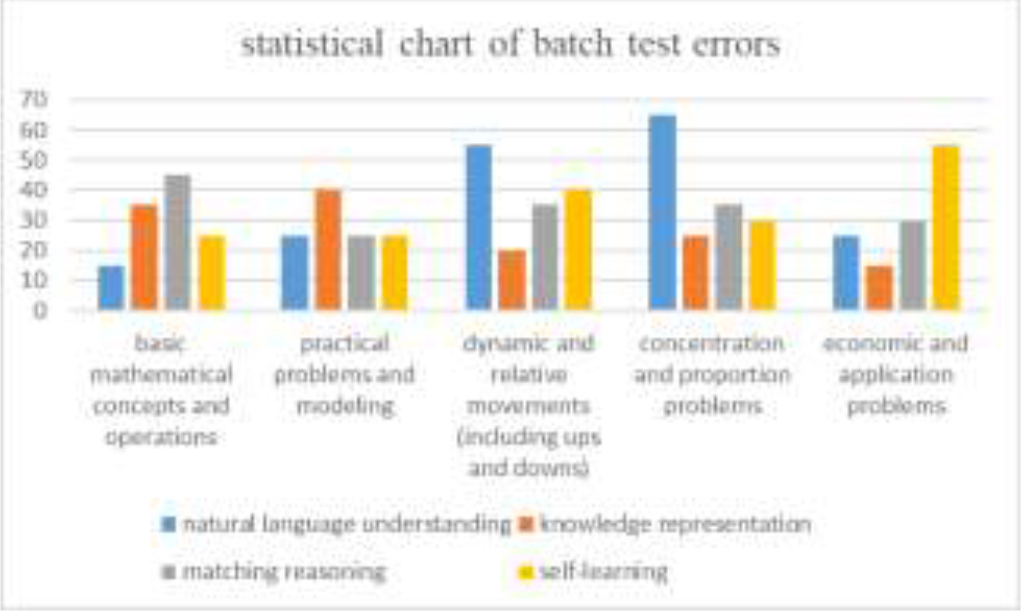
Figure 5.
Statistical chart of batch test errors
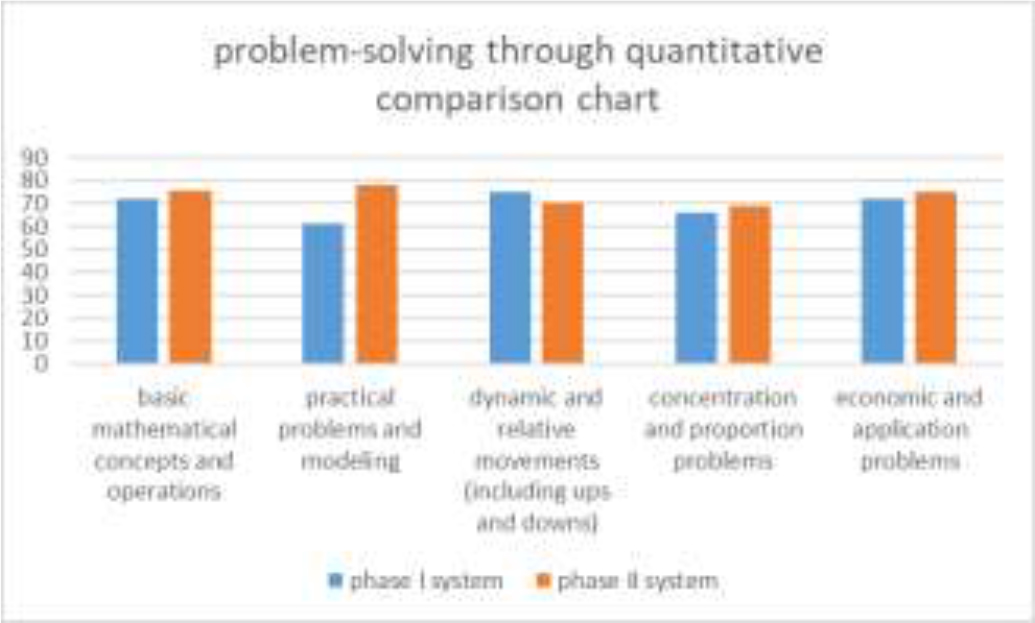
Figure 6.
Problem-solving through quantitative comparison chart
TABLE III.
THE COMPARISON OF THE PROBLEM-SOLVING SUCCESS RATES BETWEEN THIS SYSTEM AND OTHER PLATFORMS
| Problem-solving system | Success rate of problemsolving | Average problemsolving time |
|---|---|---|
| This system | 78.5% | 1min30s |
| Little ape search questions | 65% | 2min10s |
| Homework Help | 60% | 2min30s |
TABLE IV.
COMPARISON OF PROBLEM-SOLVING EFFECTIVENESS ACROSS DIFFERENT QUESTION TYPES
| Type of question category | Success rate of problem-solving | Average problemsolving time |
|---|---|---|
| Basic Operations and Relations | 85% | 1min10s |
| Geometry and tree planting | 75% | 1min30s |
| Application problems | 72% | 1min40s |
| Special question types and techniques | 68% | 1min50s |
| Other categories | 80% | 1min20s |
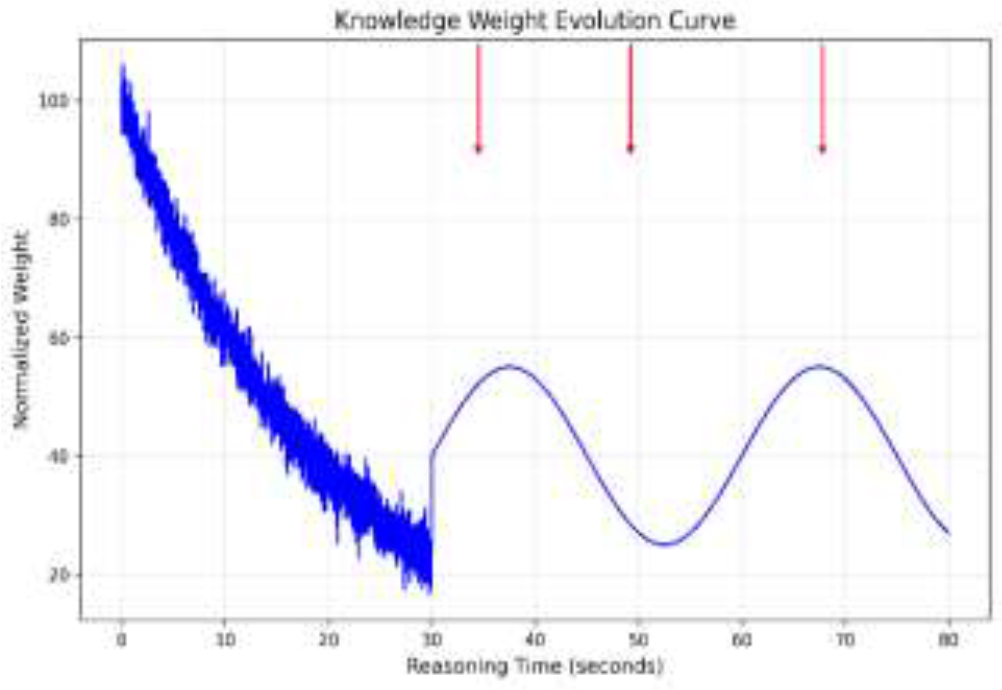
Figure 7.
Knowledge weight evolution during problem-solving process
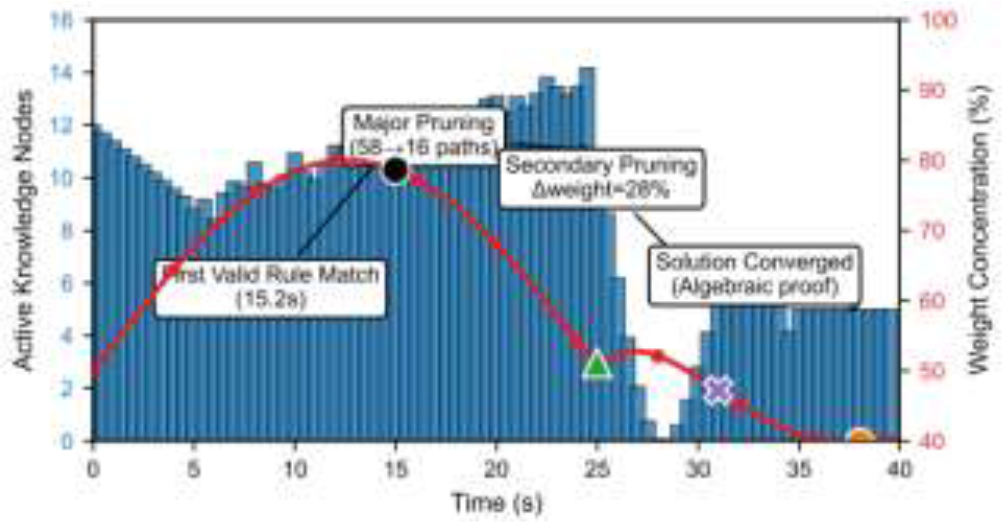
Figure 8.
Temporal evolution of active nodes (bars) and weight concentration (line) during problem solving