
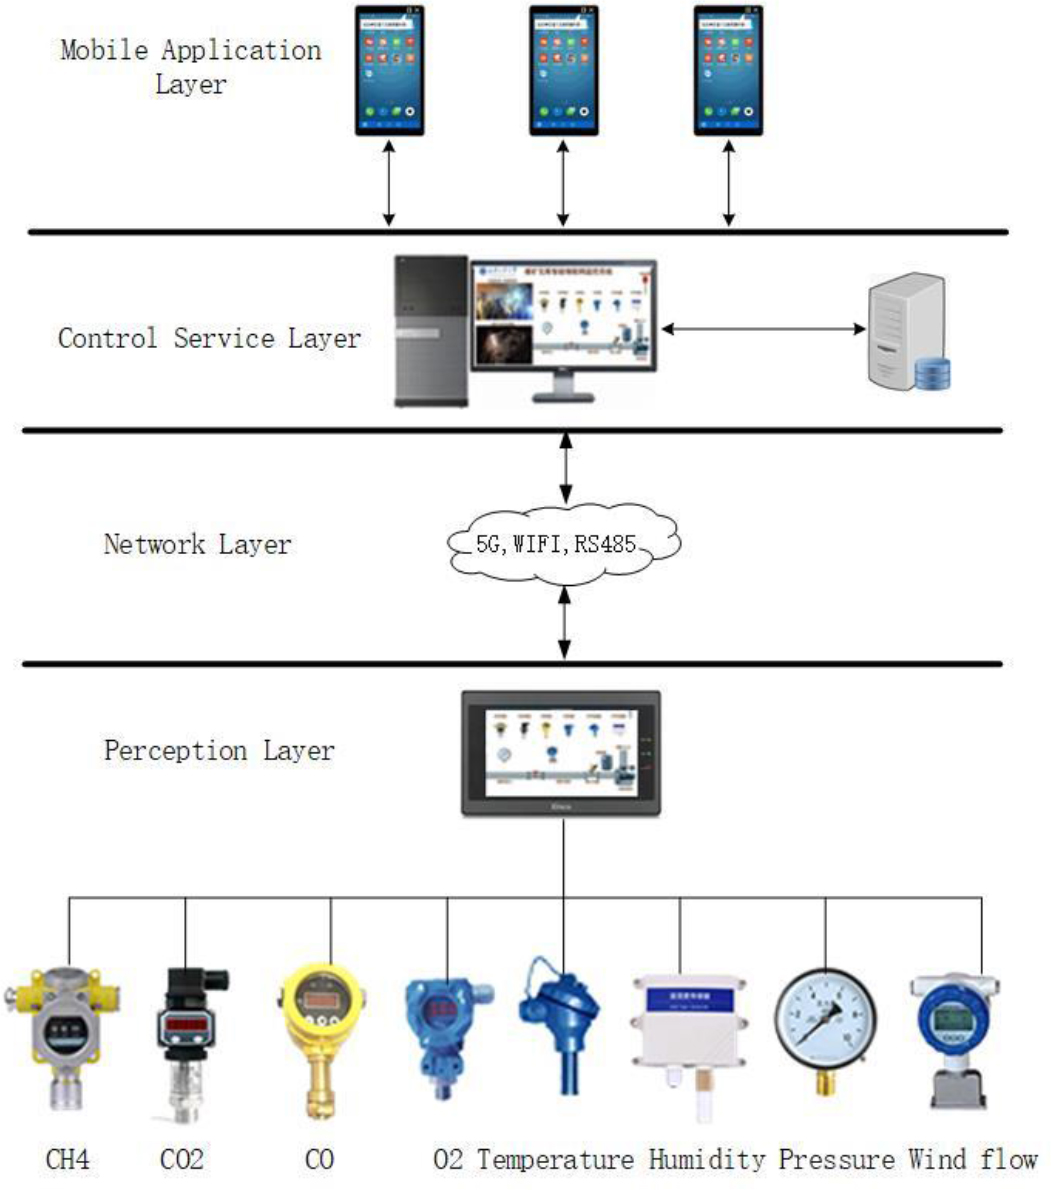
Figure 1.
The Overall Architecture Diagram of the Intelligent IoT Monitoring System for Coal Mine Gas
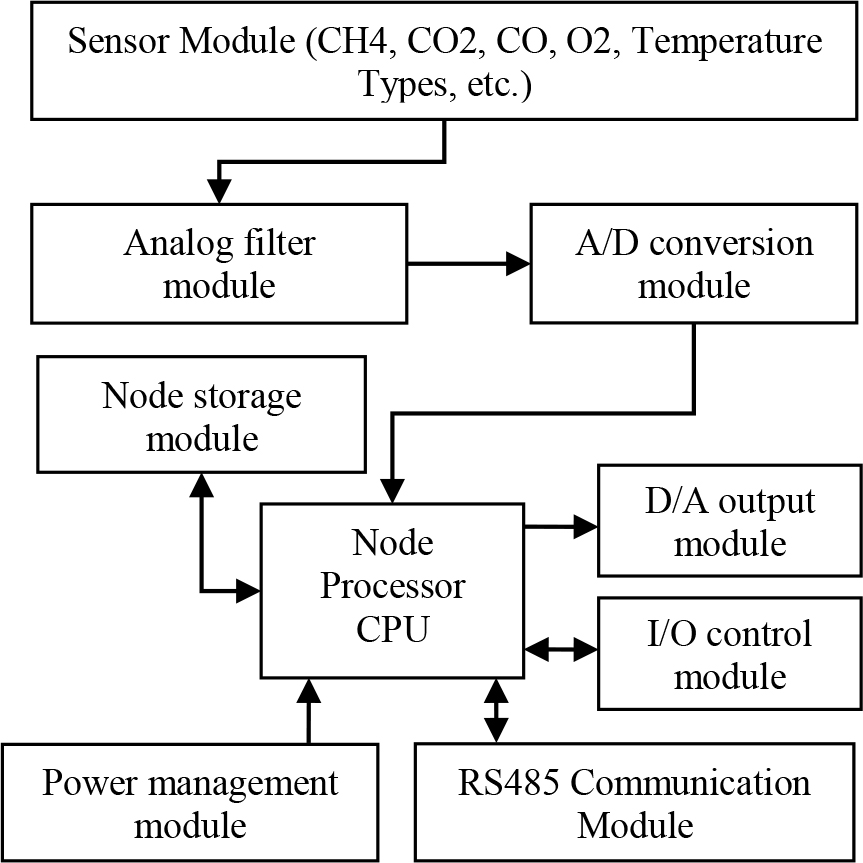
Figure 2.
Functional Block Diagram of the Hardware Composition of IoT Sensor Nodes for Coal Mine Gas Monitoring
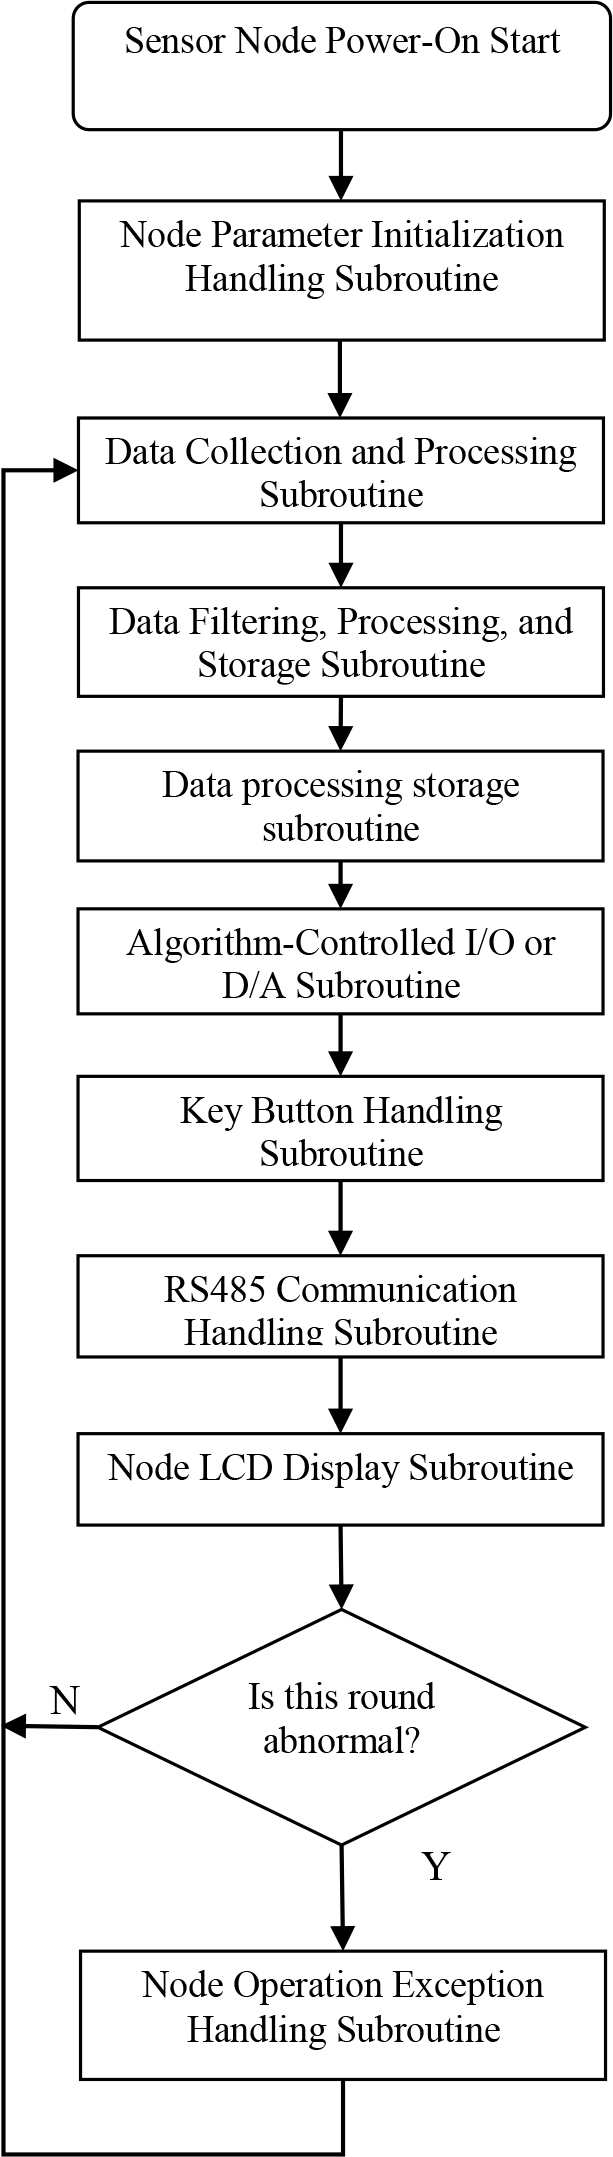
Figure 3.
Flowchart of the Microcontroller Software Design for Sensor Nodes
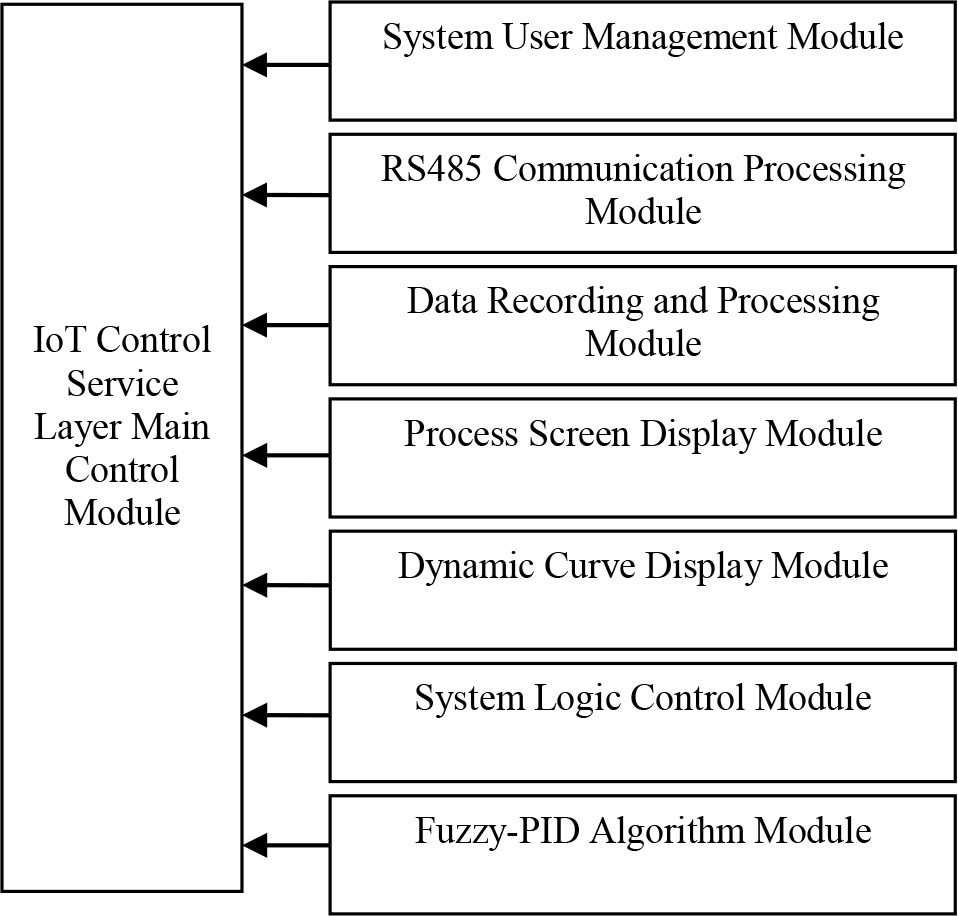
Figure 4.
Function Module Diagram of the Control Service Layer in the IoT Monitoring System
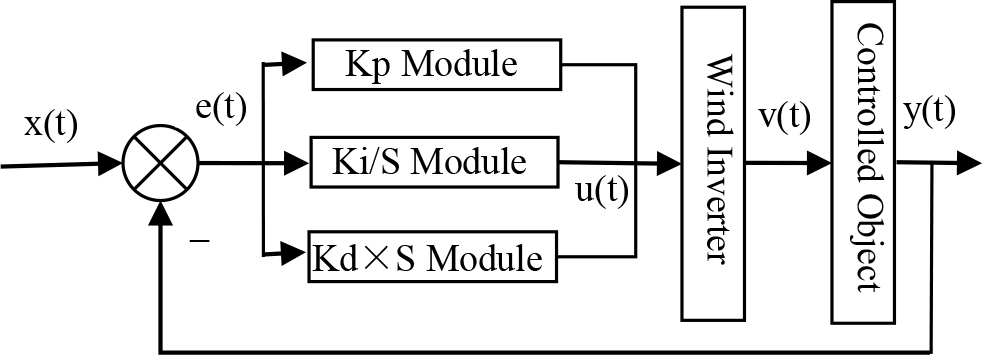
Figure 5.
Traditional PID Control Process for Ventilation Variable Frequency Drives in Coal Mine Gas IoT
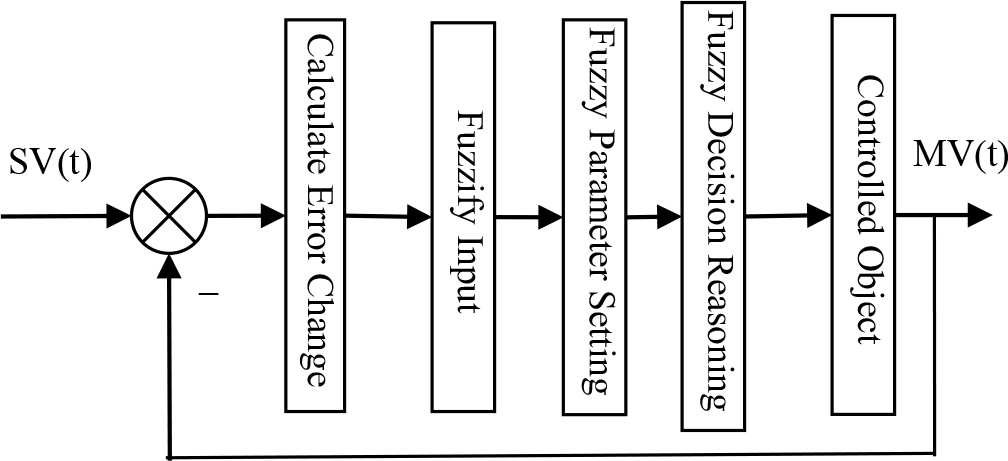
Figure 6.
Fuzzy Control System Block Diagram
TABLE I.
Fuzzy Control Rule Table
| UF | E | |||||||
|---|---|---|---|---|---|---|---|---|
| NB | NM | NS | ZE | PS | PM | PB | ||
| EC | NB | PB | PB | PM | PM | PS | ZE | ZE |
| NM | PB | PB | PM | PS | PS | ZE | NS | |
| NS | PM | PM | PM | PS | ZE | NS | NS | |
| ZE | PM | PM | PS | ZE | NS | NM | NM | |
| PS | PS | PS | ZE | NS | NS | NM | NM | |
| PM | PS | ZE | NS | NM | NM | NM | NB | |
| PB | ZE | ZE | NM | NM | NM | NB | NB | |
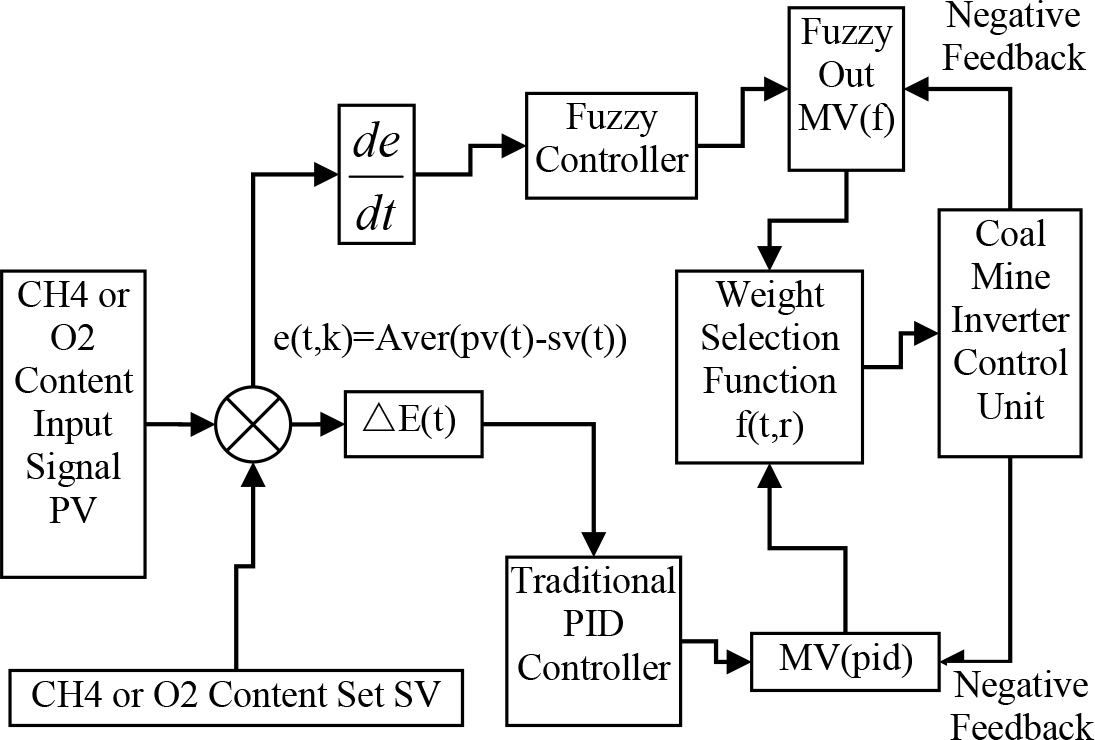
Figure 7.
Coal Mine Gas Intelligent IoT Fuzzy-PID Control Schematic
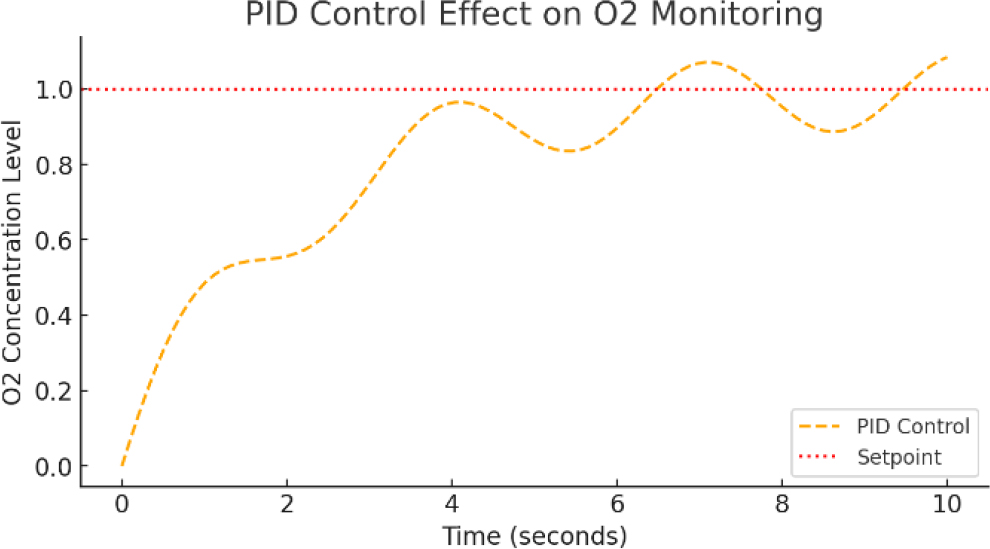
Figure 8.
Experimental Control Effect Curve of the Traditional PID
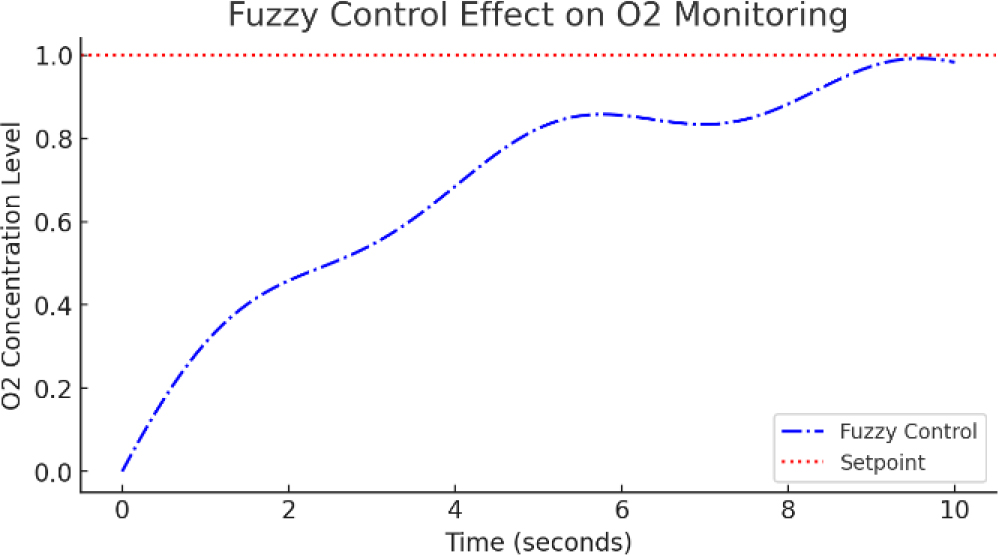
Figure 9.
Experimental Control Effect Curve of the Fuzzy Algorithm
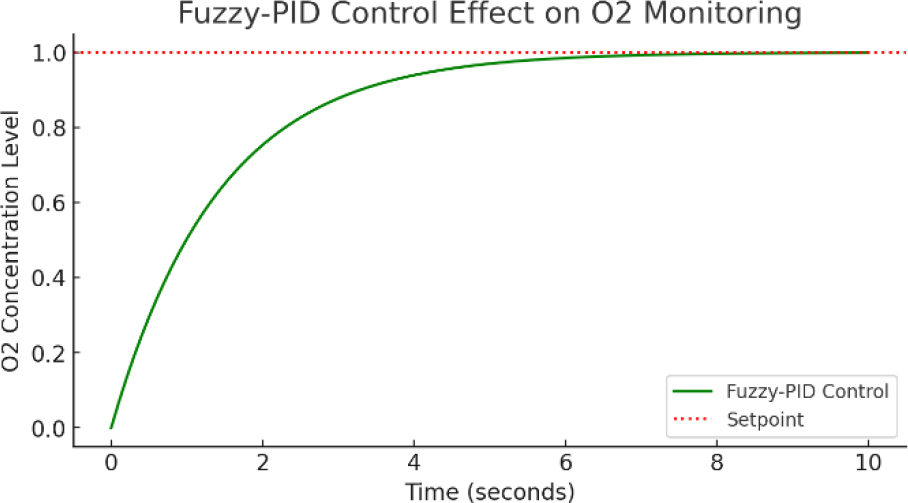
Figure 10.
Experimental Control Effect Curve of the Fuzzy-PID Algorithm
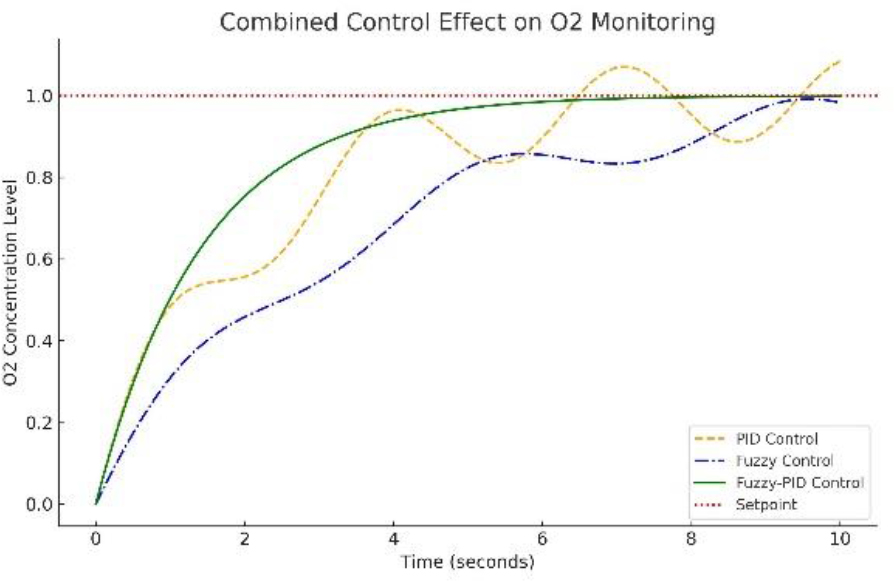
Figure 11.
Comparative Experimental Control Effect Curve of the Three Algorithms.
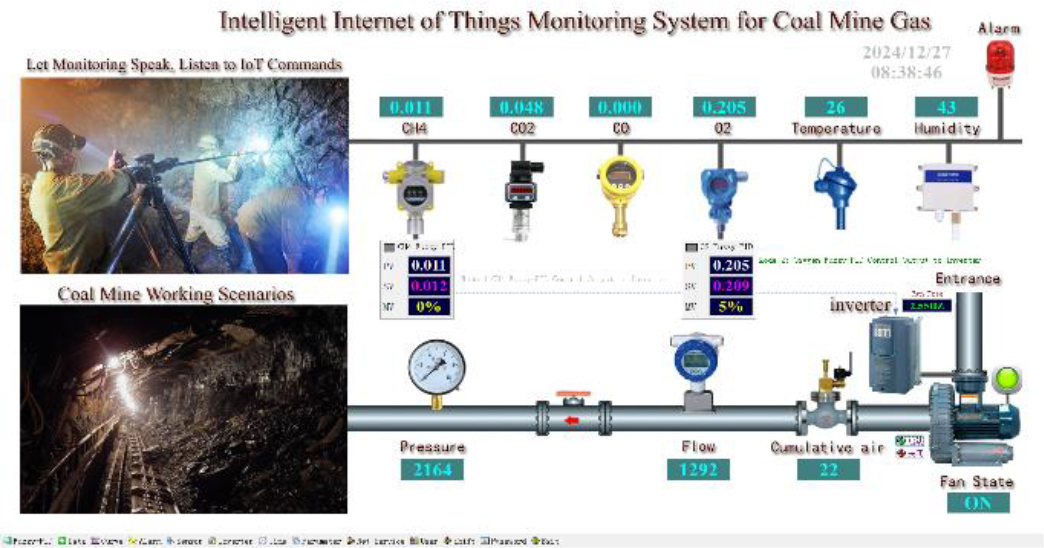
Figure 12.
The Main Screen of the Intelligent IoT Monitoring System for Coal Mine Gas Using the Fuzzy-PID Algorithm.