
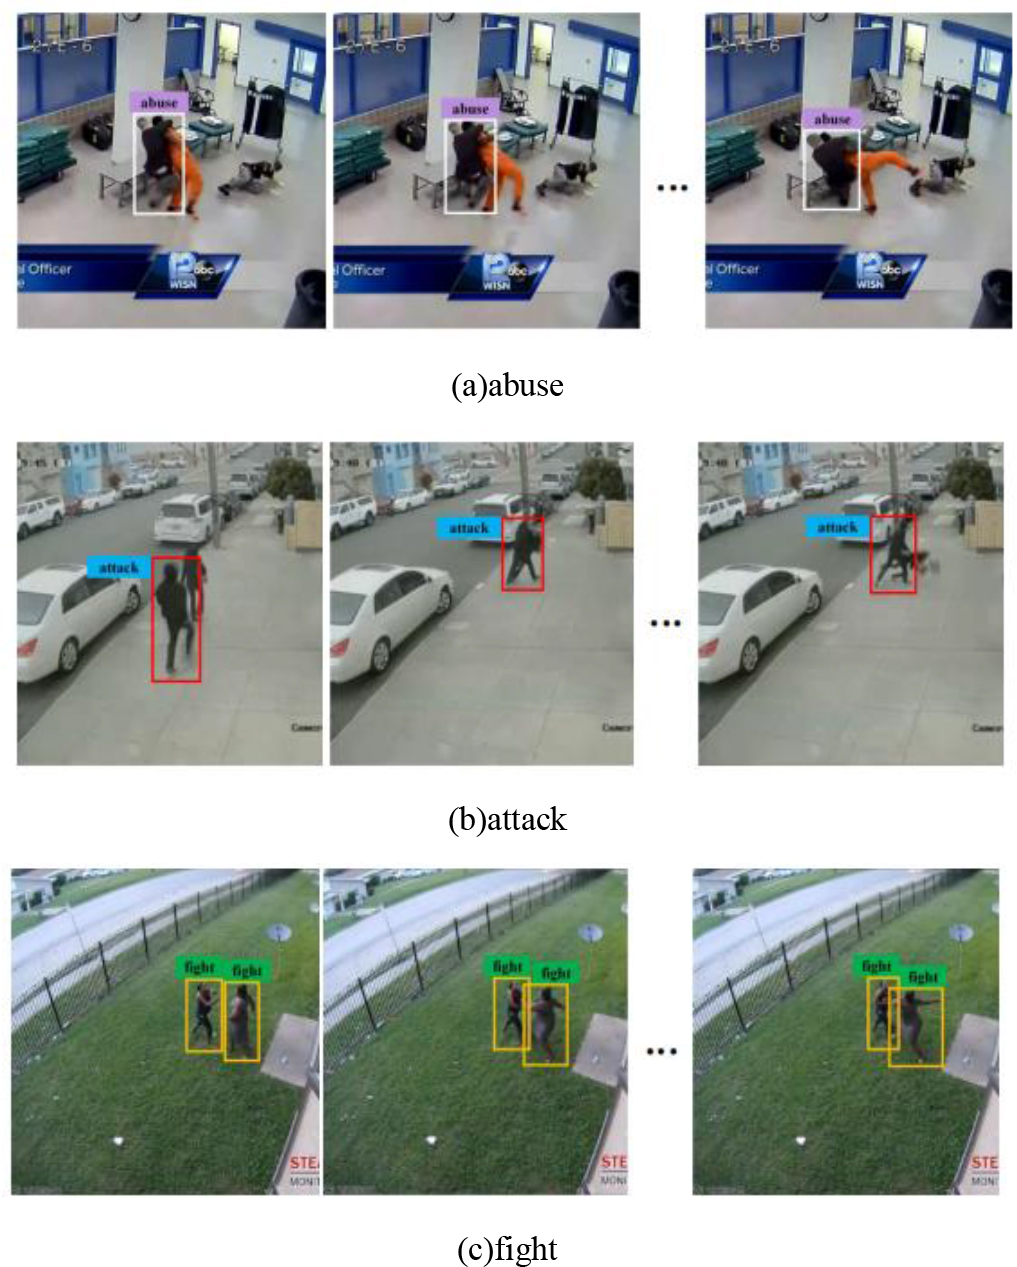
Figure 1.
Illustration of a sample of labeled acts of violence
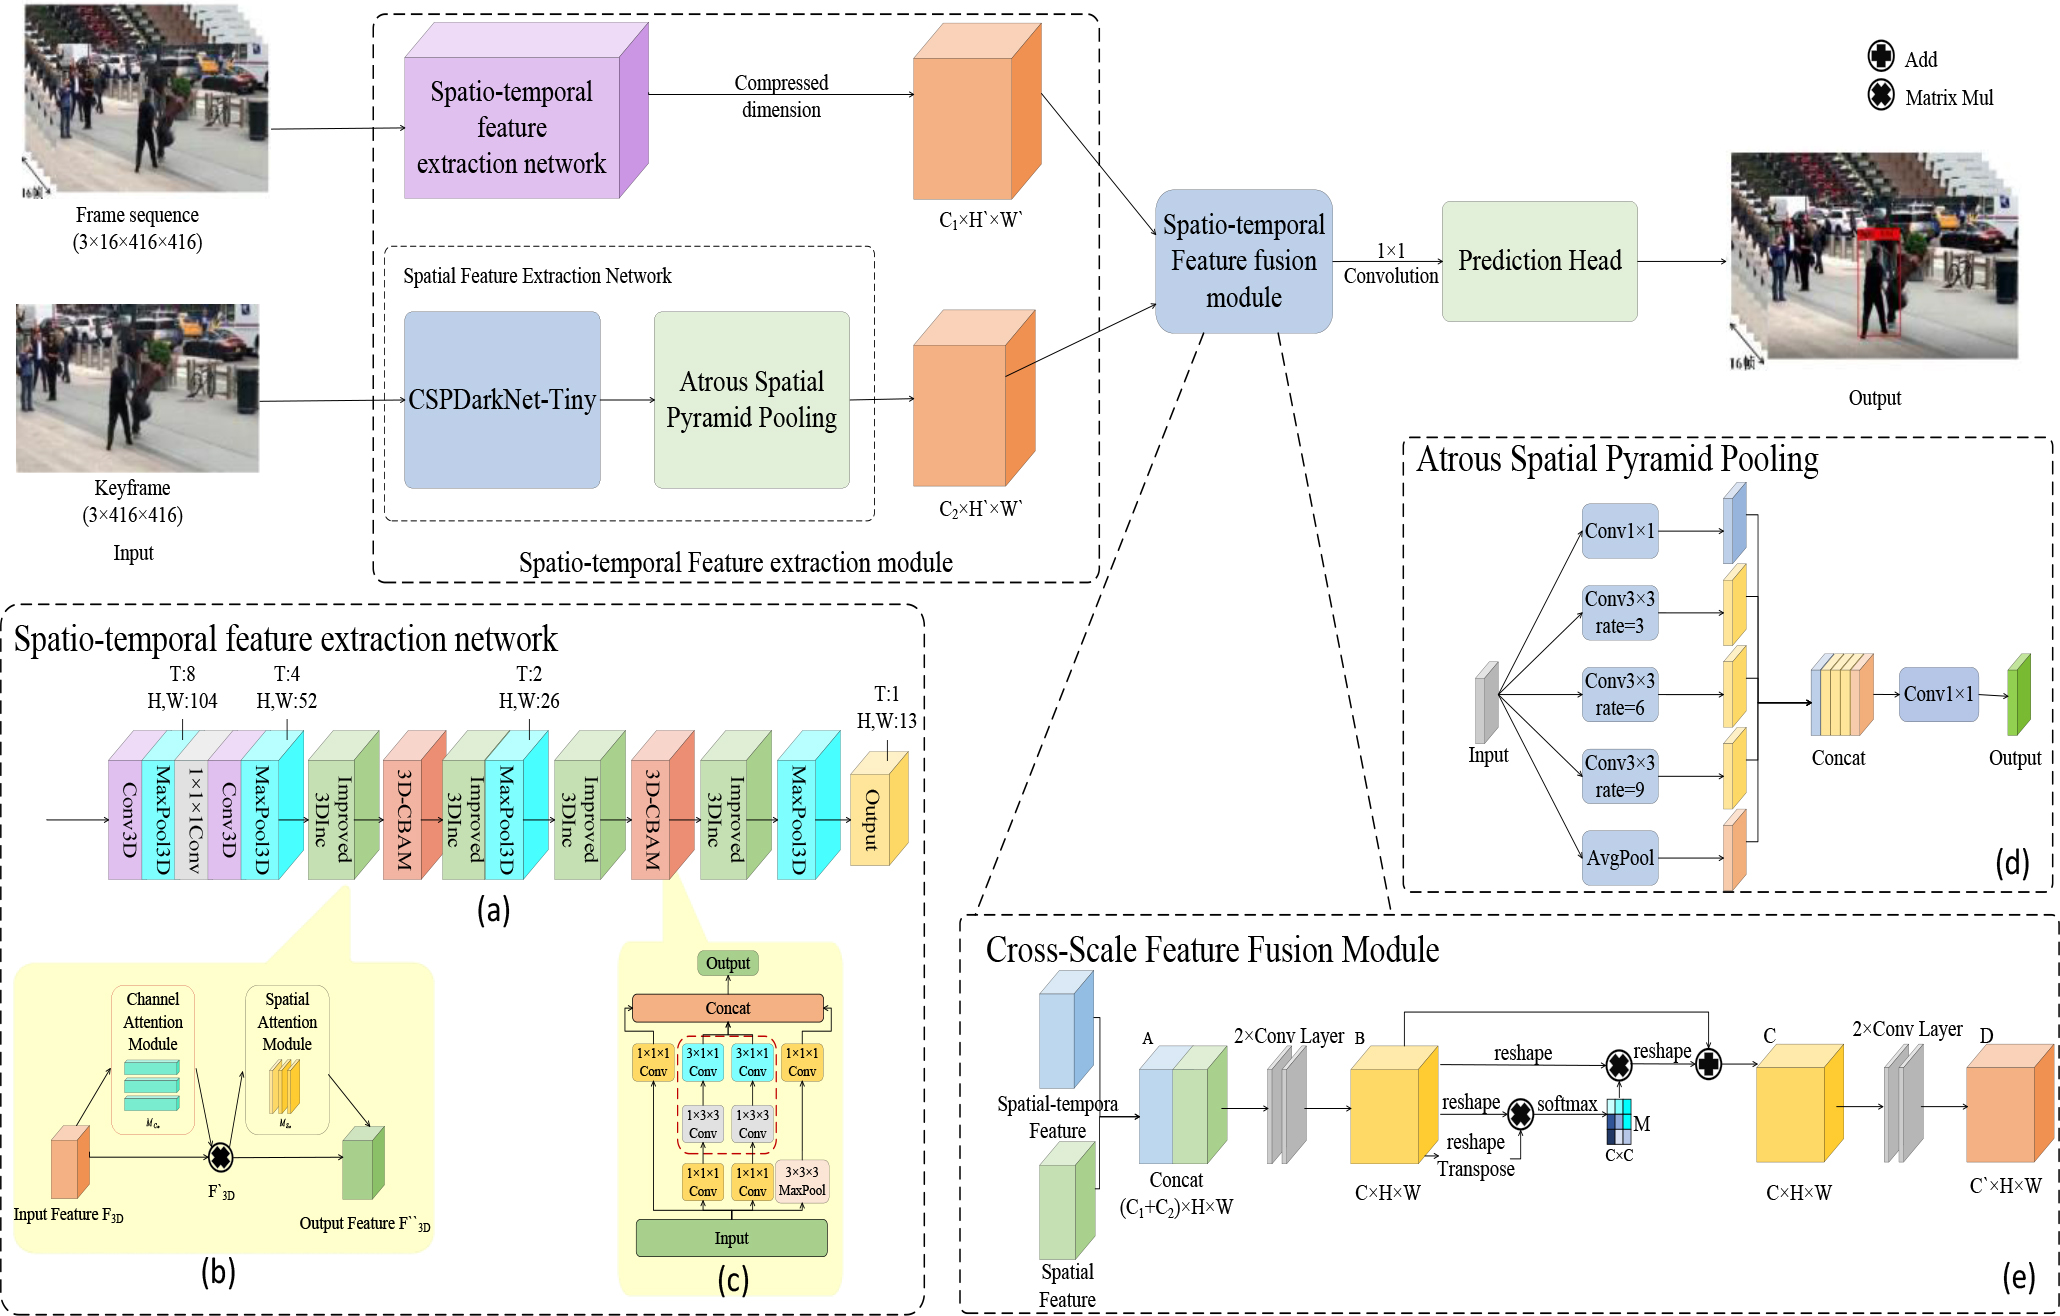
Figure 2.
The violence detection algorithm's framework is displayed in Fig.2. The model for extracting spatio-temporal features and the spatio-temporal feature fusion module make up the majority of the framework. The spatio-temporal feature extraction model is composed of the temporal feature extraction model and the spatial feature extraction module, and the I3D network is the network structure of the temporal feature extraction model, as illustrated in (a); (b)(c) are the 3D-CBAM Attention Mechanism and 3D Inception (3D Inc) module, respectively. The Atrous Spatial Pyramid Pooling (ASPP) model is added at the end of the spatial feature extraction model, which has the CSPDarkNet-Tiny network as its network structure, which is shown in (d), where rate denotes the expansion rate of the null convolution. atrous Spatial Pyramid Pooling (ASPP) has five branches, including one ordinary convolutional branch, three null convolutional branches, and one global average pooling branch; (e) shows the overall structure of Channel Fusion and Attention Mechanism(CFAM); D is the final output feature map of CFAM, and C1 and C2 are the number of feature map output channels for the I3D network and the ASP module, respectively.
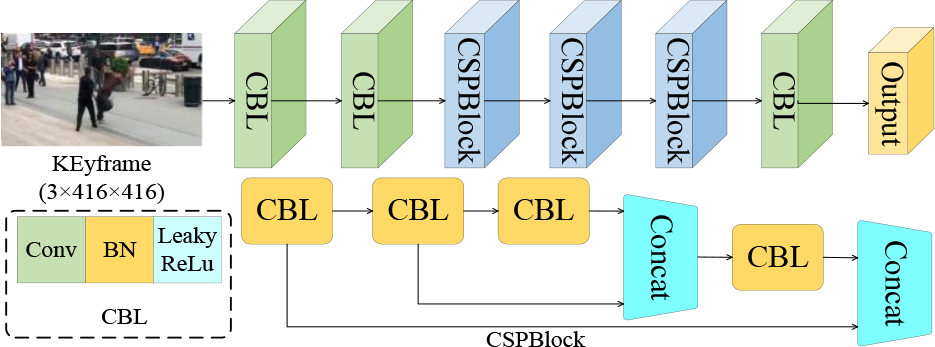
Figure 3.
CSPDarkNet-Tiny Network Overall Structure
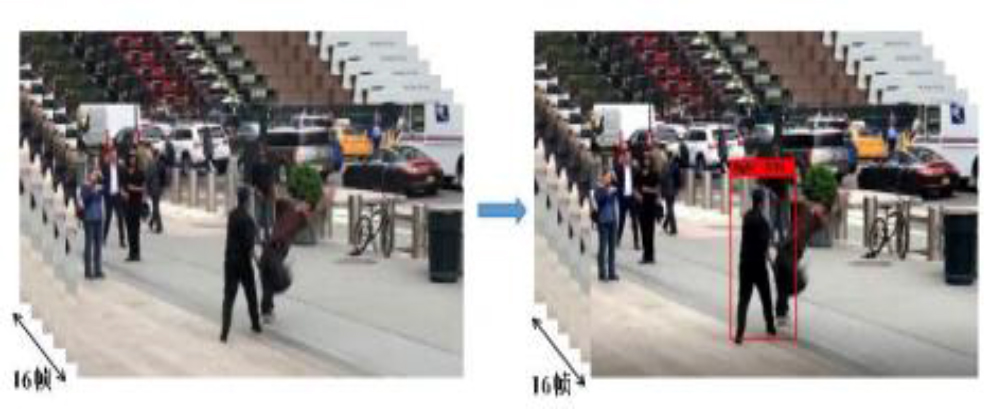
Figure 4.
Violence detection results
TABLE I.
Parameter settings in network training
| Parameter | Setting |
|---|---|
| Initial Learning Rate | 0.001 |
| Epoch | 230 |
| ReSize | (416,416) |
| ReSize | (416,416) |
| Weight Decay | 0.0005 |
| Optimizer | Adam |
TABLE II.
Results of violence detection accuracy of different models
| Method | UCF101-24 | JHMDB | VioData |
|---|---|---|---|
| mAP | |||
| MPS | 82.4% | - | 85.3 |
| P3D-CTN | - | 84.0% | 84.9% |
| STEP | 83.1% | - | 86.4% |
| YOWO | 82.5% | 85.7% | 88.0% |
| ours | 89.8% | 88.6% | 91.8% |
TABLE III.
Detection results with embedded ASPP model and introduction of spatio-temporal depth separable convolution
| Network | UCF101-24 | JHMDB | VioData |
|---|---|---|---|
| mAP | |||
| Baseline | 78.5% | 75.3% | 78.9% |
| CSPDarkNet-Tiny+ASPP | 80.7% | 76.6% | 82.0% |
| CSPDarkNet-Tiny+ASPP++I3D(Impr oved 3D Inc) | 84.8% | 80.4% | 86.5% |
TABLE IV.
Detection results of 3D-CBAM attention model embedded at different locations
| Network | Embedding position | UCF101-24 | JHMDB | VioData |
|---|---|---|---|---|
| mAP | ||||
| - | 84.4% | 80.4% | 86.5% | |
| 3D Inc_1 | 86.1% | 83.7% | 89.0% | |
| 3D Inc_2 | 86.7% | 83.3% | 88.3% | |
| 3D Inc_3 | 85.9% | 84.2% | 89.6% | |
| 3D Inc_1+3D Inc_2 | 88.2% | 87.5% | 90.7% | |
| I3D | 3D Inc_1+3D Inc_3 | 89.8% | 88.6% | 91.8% |
| 3D Inc_2+3D Inc_3 | 88.0% | 88.0% | 91.4% | |
| 3D Inc_1+3D Inc_2+3D Inc_3 | 90.0% | 88.7% | 92.0% | |