
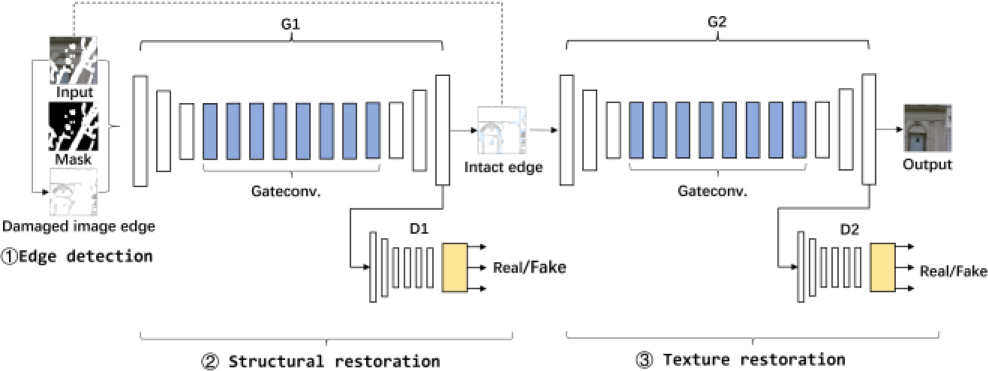
Figure 1.
Overall structure of the image inpainting network
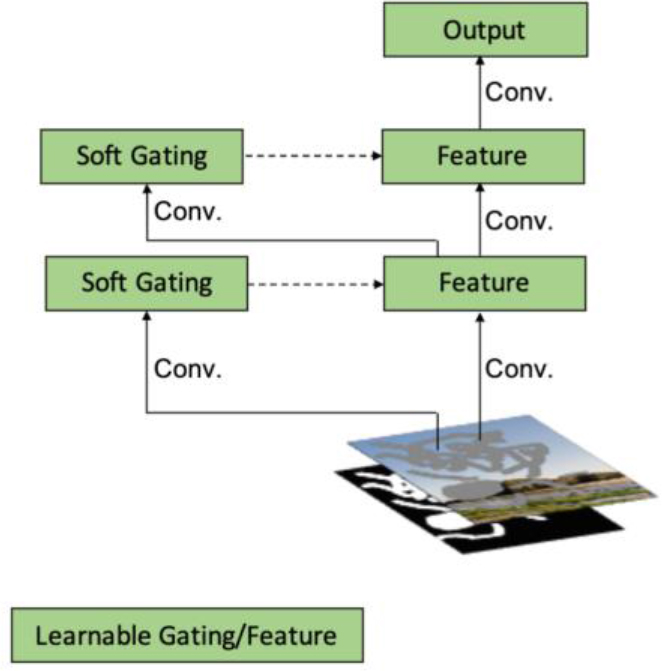
Figure 2.
Schematic diagram of gated convolution structure
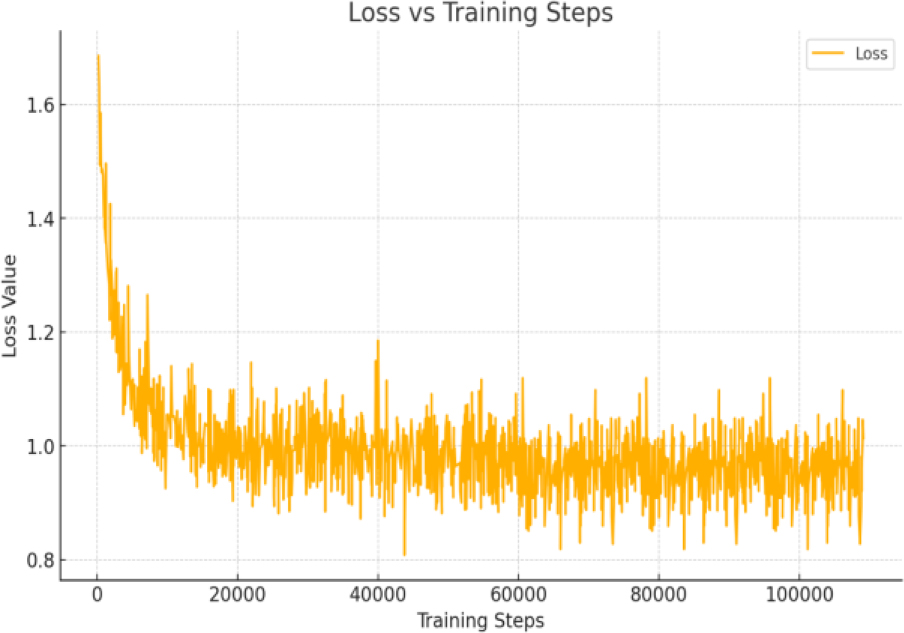
Figure 3.
Curves of Loss Functions during Model Training
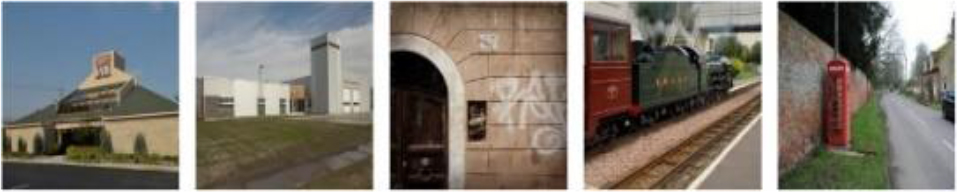
Figure 4.
A partial sample of the Places2 dataset
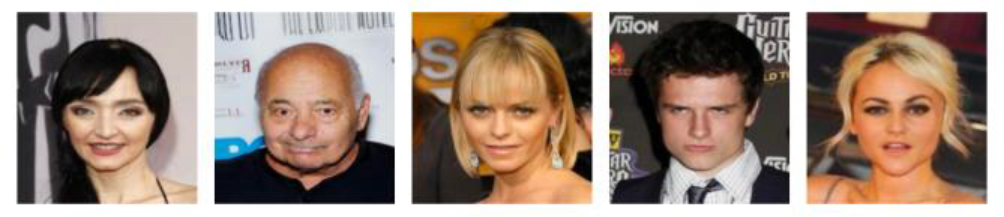
Figure 5.
A partial sample of the CelebA dataset
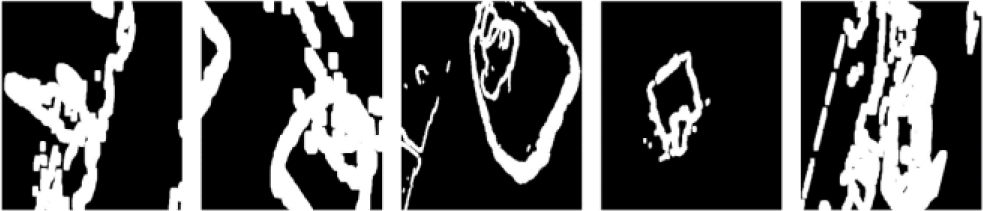
Figure 6.
A partial sample of the Irregular mask dataset
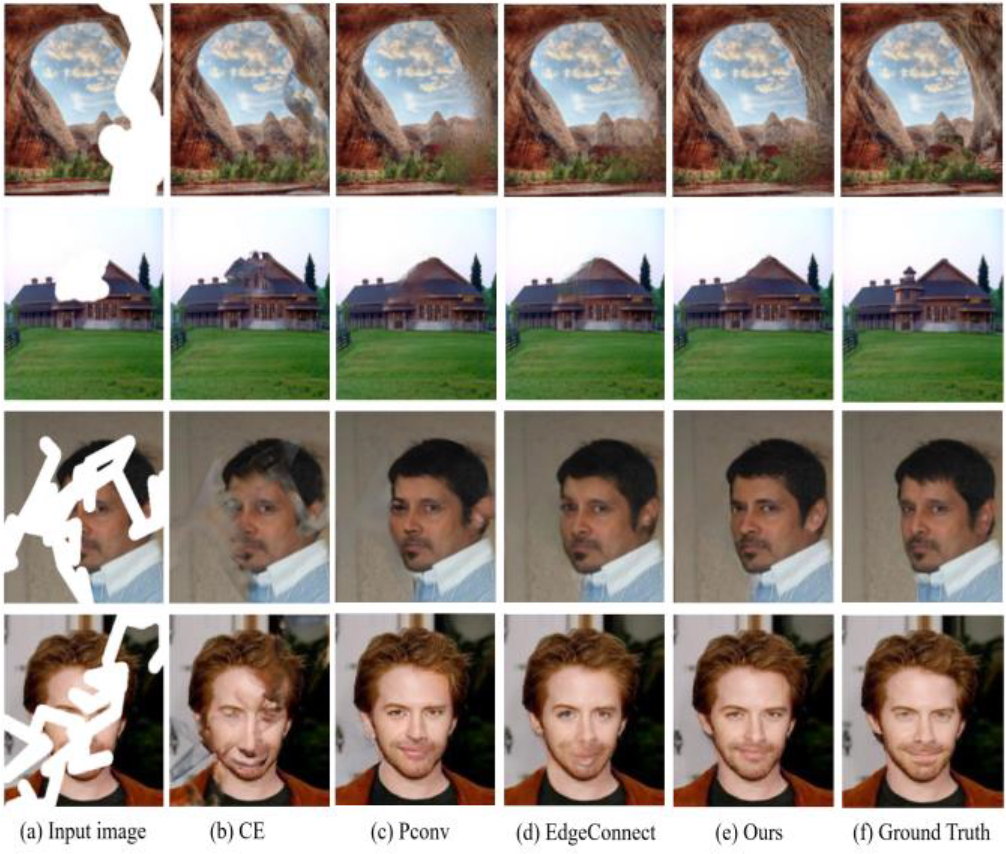
Figure 7.
The repair effect of each algorithm is displayed
TABLE I.
PSNR/SSIM for different image inpainting methods and different mask area ratios on the places2 dataset
| Mask Ratio | PSNR/SSIM | ||||
|---|---|---|---|---|---|
| CE | Pconv | EC | Ours | ||
| 1%-10% | 29.26/0.937 | 30.87/0.929 | 32.58/0.947 | 33.89/0.961 | |
| 10%-20% | 21.34/0.746 | 24.62/0.887 | 27.15/0.916 | 28.43/0.935 | |
| 20%-30% | 19.58/0.658 | 21.43/0.824 | 24.33/0.859 | 25.58/0.878 | |
| 30%-40% | 17.82/0.549 | 19.32/0.751 | 23.17/0.782 | 23.81/0.814 | |
| 40%-50% | 15.77/0.475 | 17.48/0.682 | 21.64/0.747 | 22.04/0.763 | |
| 50%-60% | 14.25/0.416 | 16.44/0.613 | 19.46/0.651 | 20.53/0.686 | |
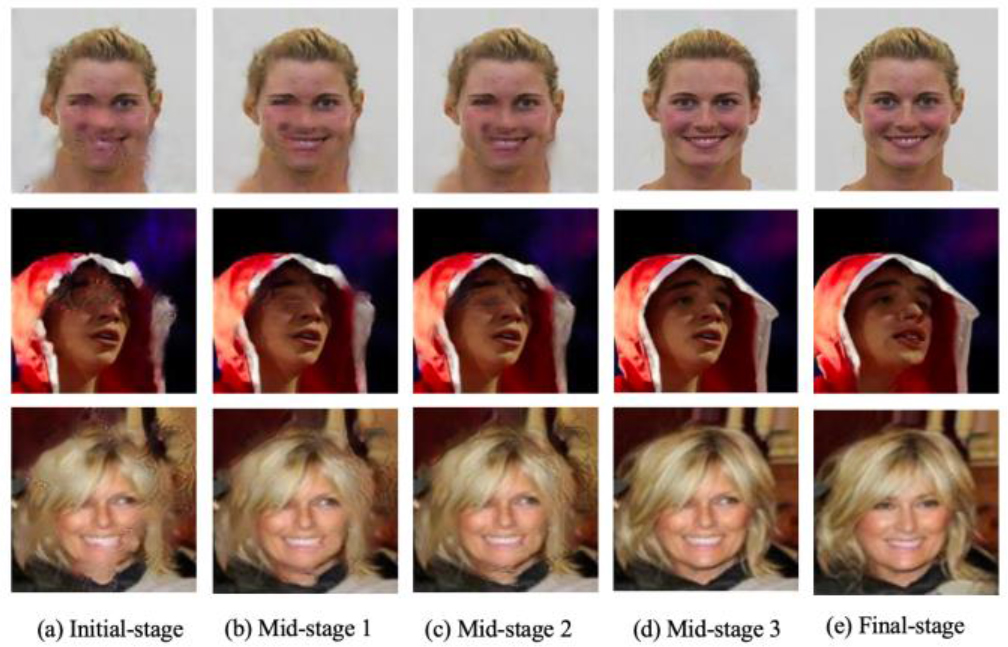
Figure 8.
Comparison of Inpainting Results at Different Iterations during Training