
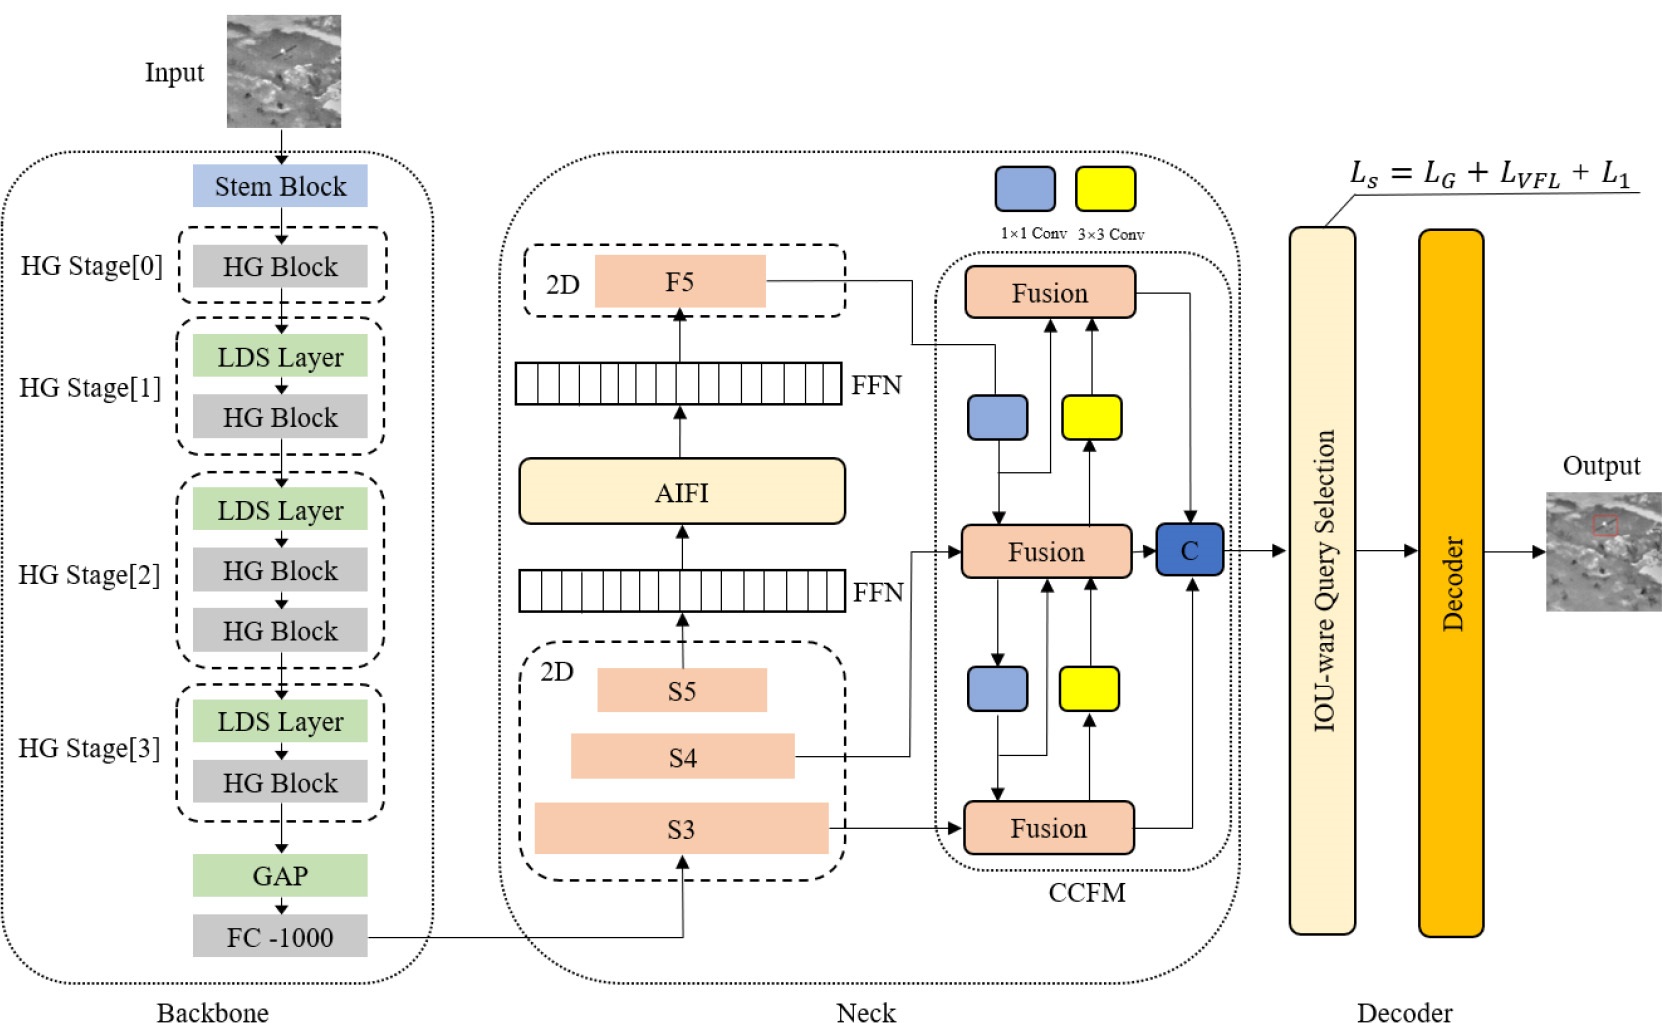
Figure 1.
RT-DETR network structure
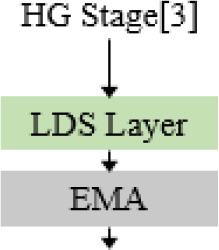
Figure 2
EMA module
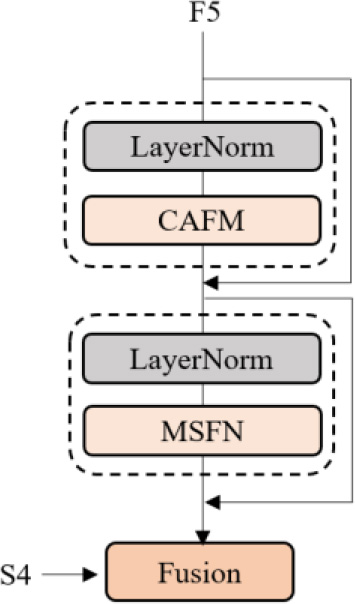
Figure 3.
CAMixing module
TABLE I.
experimental environment
| Experimental environment | Version |
|---|---|
| CPU | IntelCorei7-11800H |
| GPU | NVIDIA GeForce RTX2080 Ti |
| Language | Python3.8 |
| Deep Learning Framework | Pytorch1.14.0 |
| CUDA | 11.8.0 |
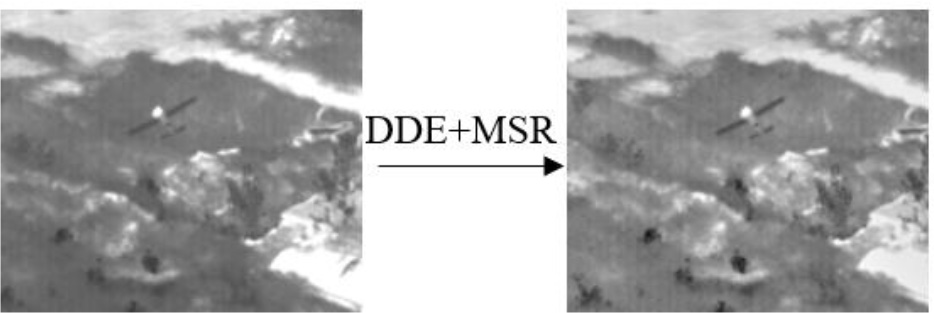
Figure 4.
Image enhancement effect
TABLE II.
Ccomparison of algorithm enhancements
| index algorithm | PSNR | SSIM | Entropy | AG | EME |
|---|---|---|---|---|---|
| Original image | 6.2850 | 41.9135 | 2.6388 | ||
| SSR | 28.2970 | 0.85522 | 5.7150 | 44.2675 | 2.8967 |
| MSR | 28.7772 | 0.8676 | 6.2176 | 44.9135 | 2.8932 |
| DDE | 36.0989 | 0.9679 | 6.4594 | 44.2206 | 2.6857 |
| Bilateral filtering | 34.6621 | 0.8395 | 6.3155 | 21.7407 | 1.4891 |
| DDE+MSR | 28.7581 | 0.8436 | 6.2793 | 46.8969 | 2.8882 |
TABLE III.
Comparative experiments of different parameters of shape-iou
| s | 0.1 | 0.2 | 0.3 | 0.4 | 0.5 | 0.6 | 1.0 |
|---|---|---|---|---|---|---|---|
| mAP(%) | 83.5 | 83.4 | 84.9 | 85.3 | 84.8 | 83.5 | 83.4 |
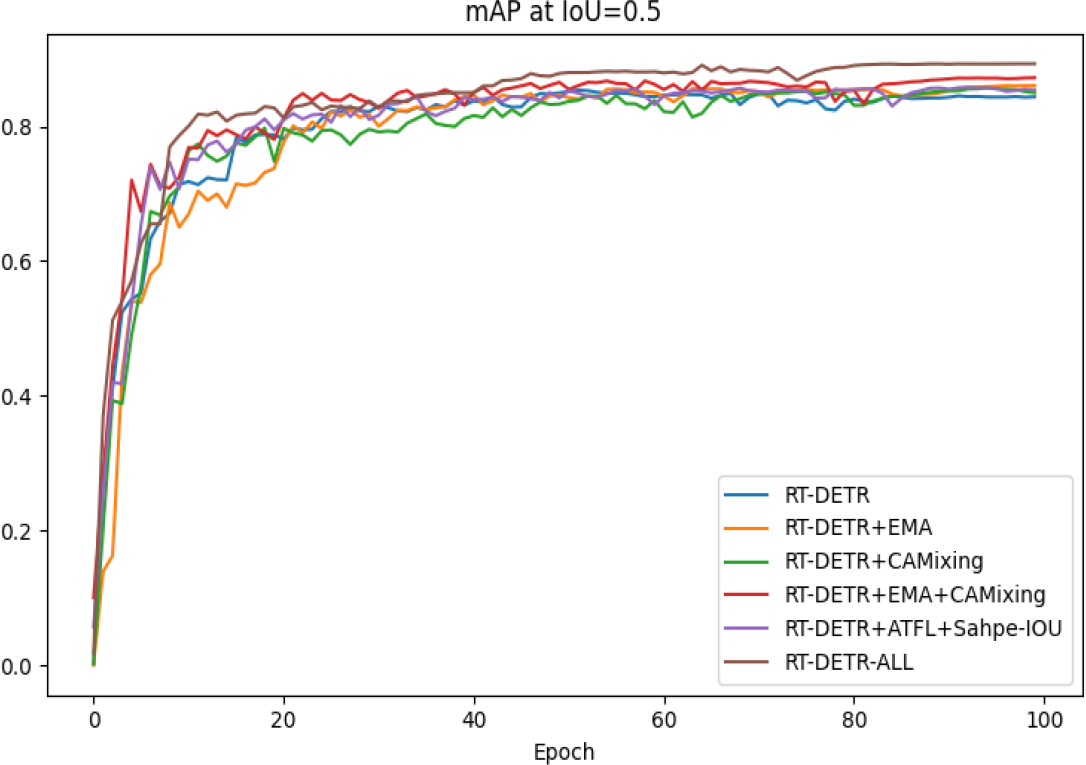
Figure 5.
AP change curve
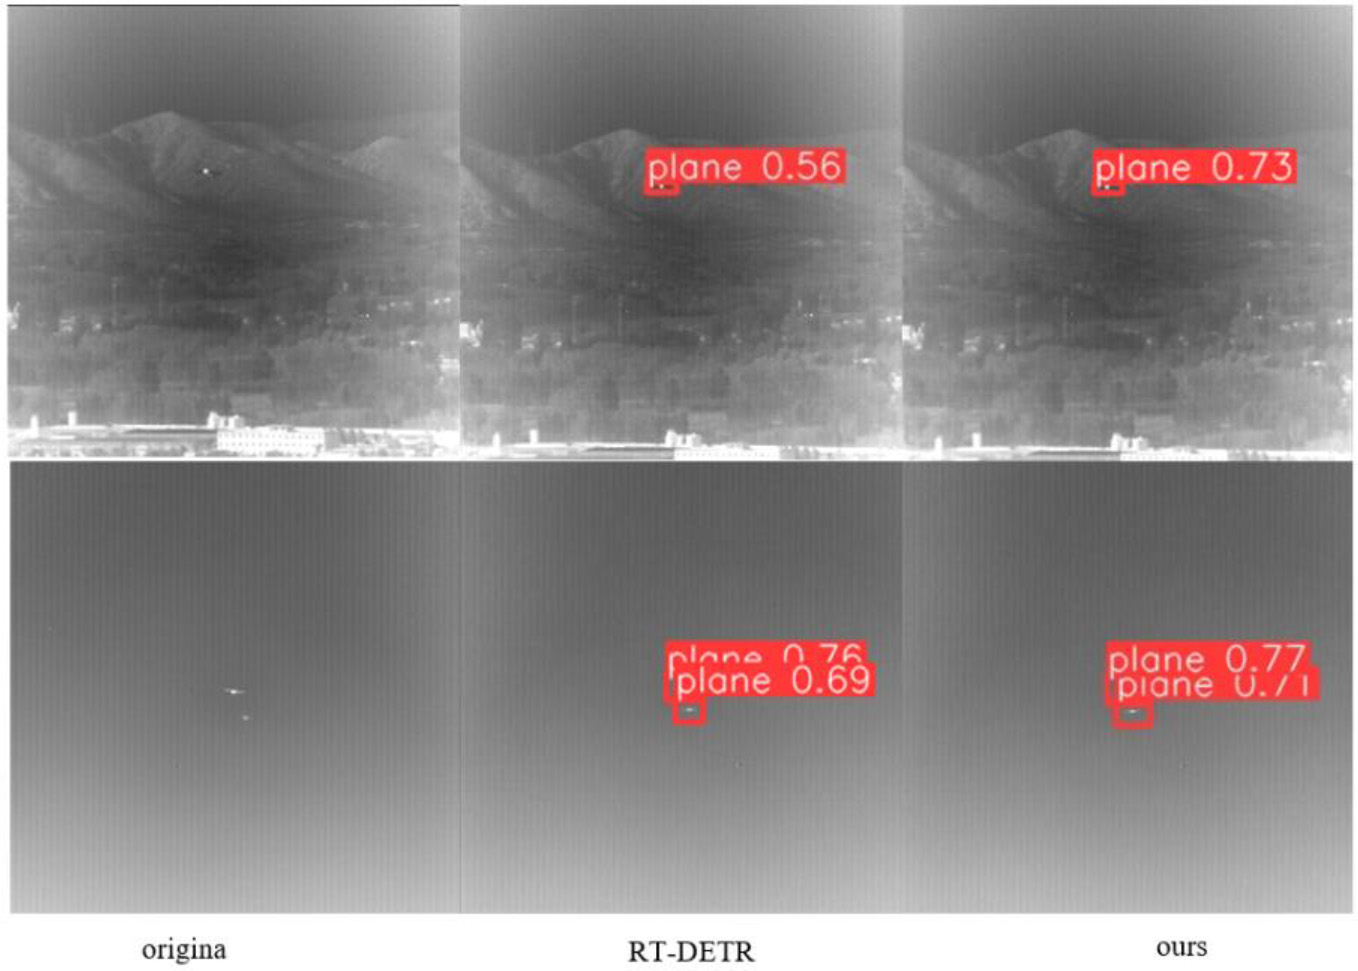
Figure 6.
Improved detection results