
TABLE I.
European disaster committee table for building damage assessment
| Masonry Construction | Fortified Buildings | Damage Level |
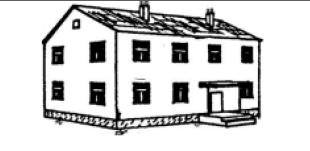 | 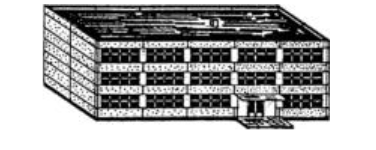 | Undamaged |
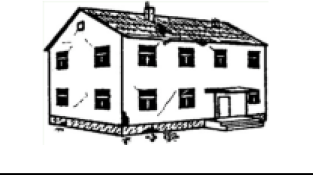 | 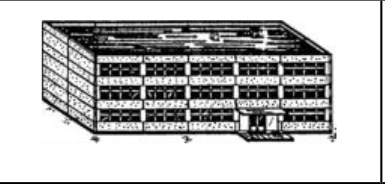 | Minor Damaged |
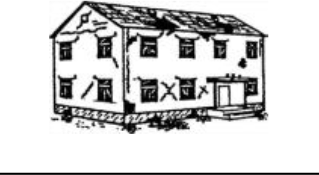 | 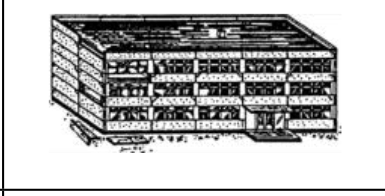 | Medium Damaged |
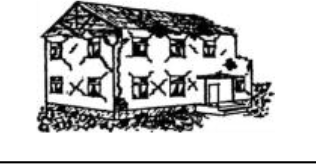 | 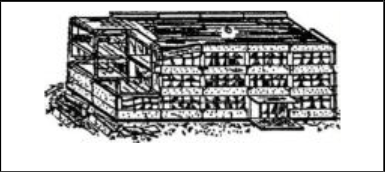 | Major Damage |
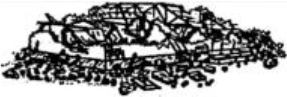 | 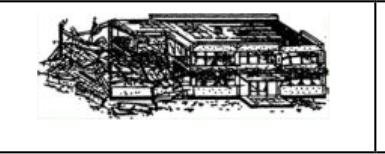 | Destroyed |
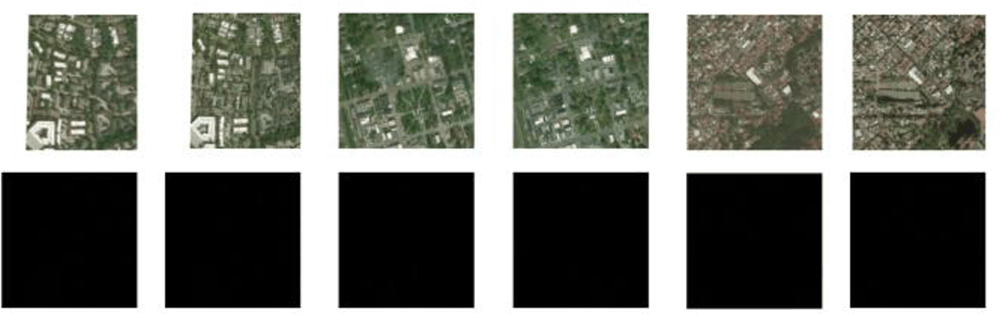
Figure 1.
Schematic diagram of xBD dataset
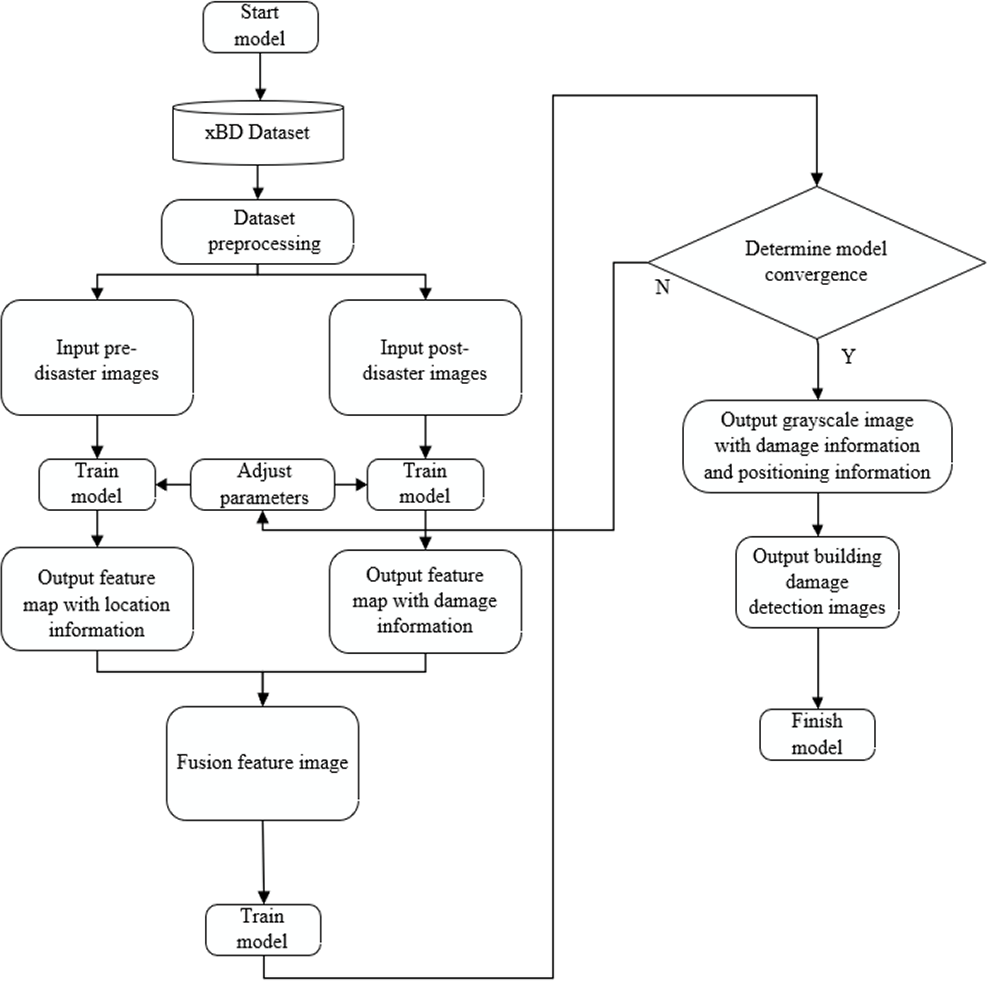
Figure 2.
Network model flow chart based on machine learning
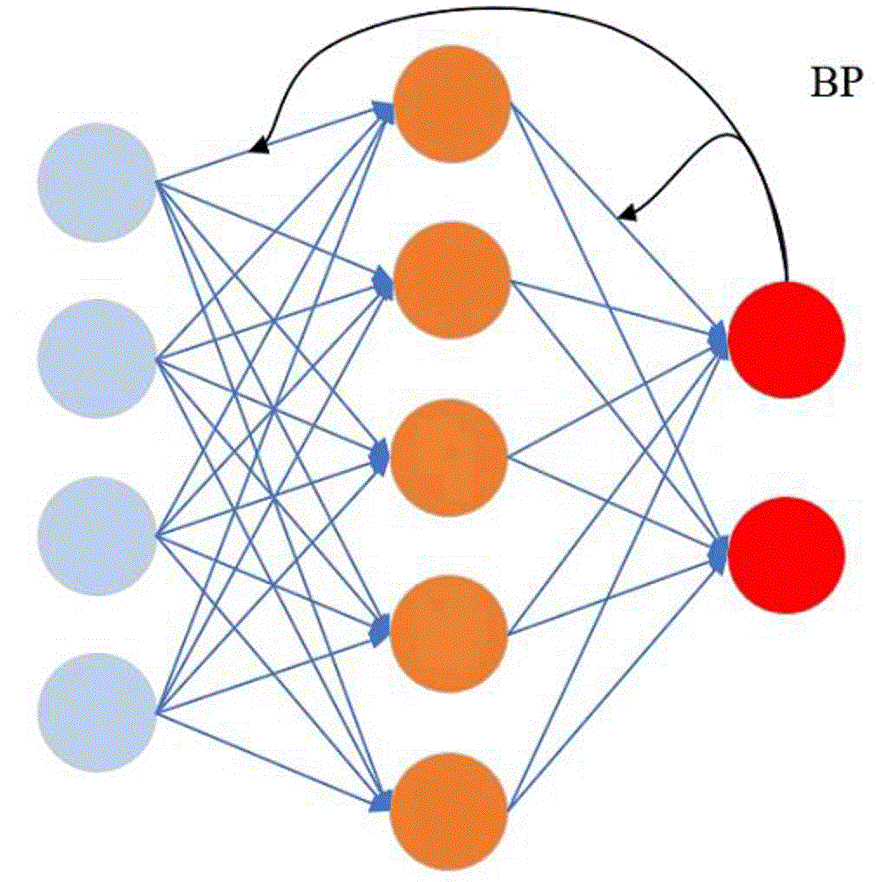
Figure 3.
The network structure of the FCN
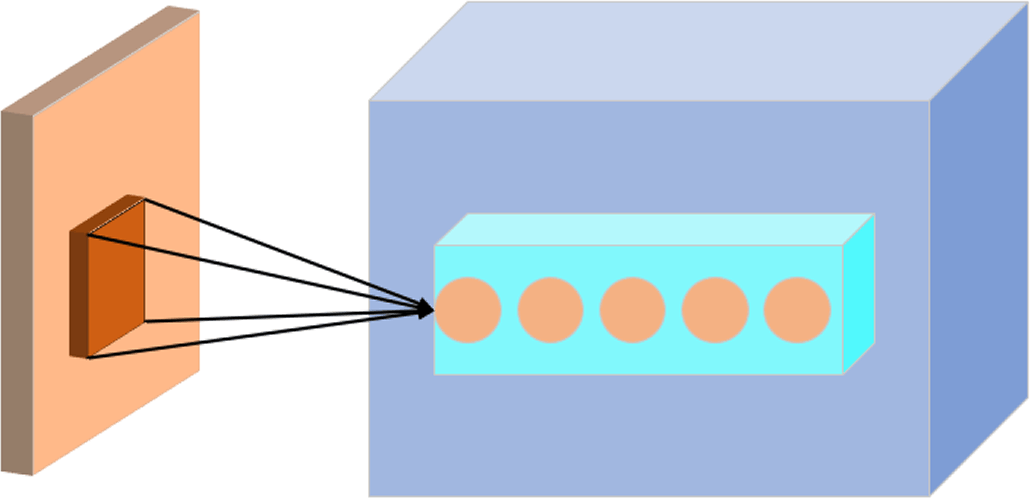
Figure 4.
CNN receptive field
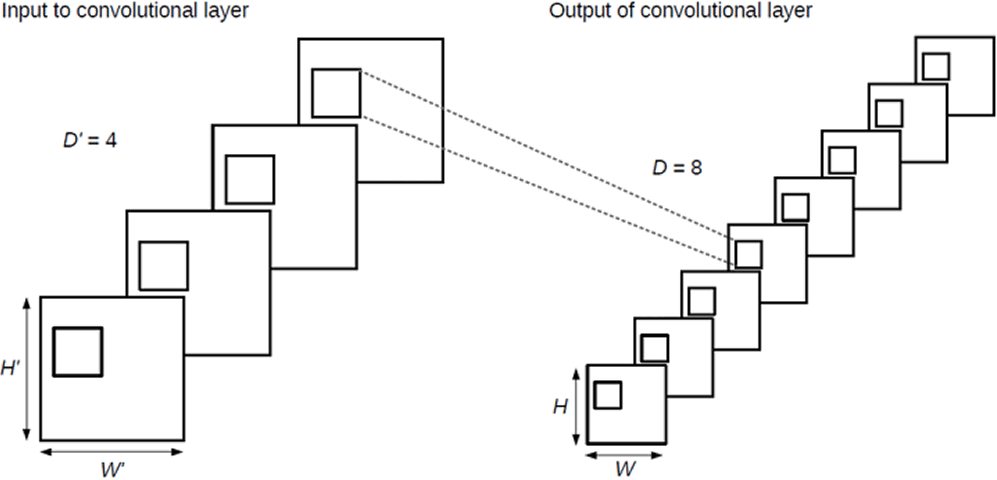
Figure 5.
Convolutional layer input and output diagram
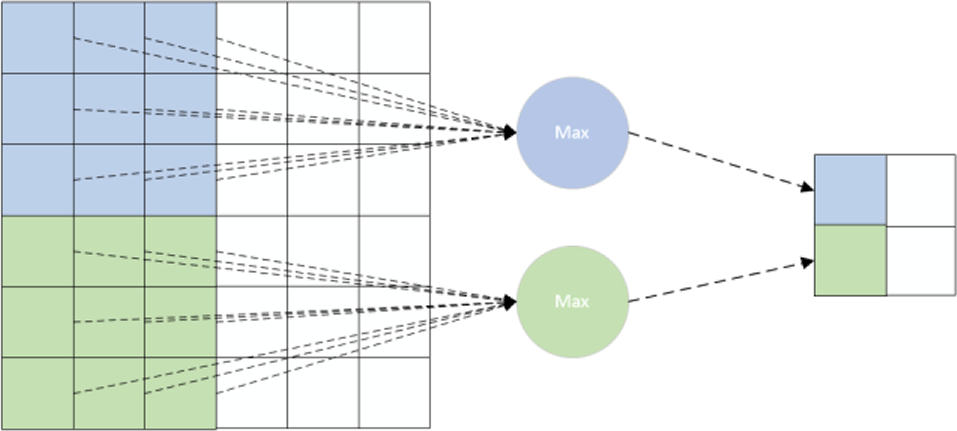
Figure 6.
Feature Pyramid Network structure diagram
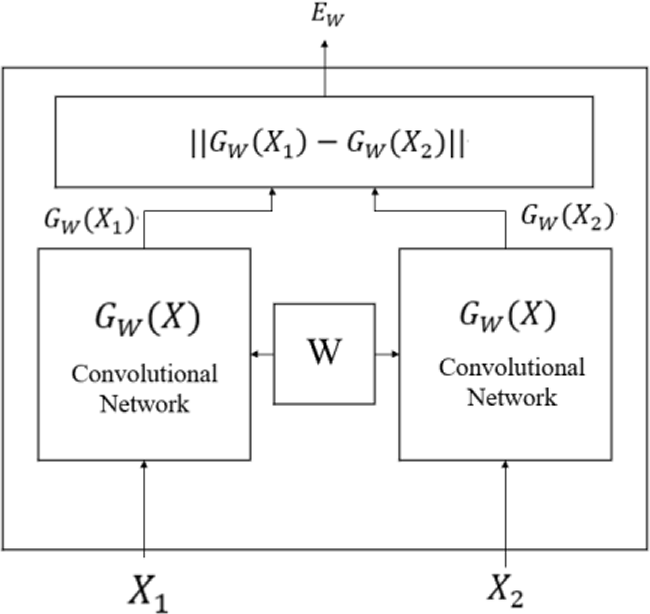
Figure 7.
Basic structure diagram of Siamese Convolutional Neural Network
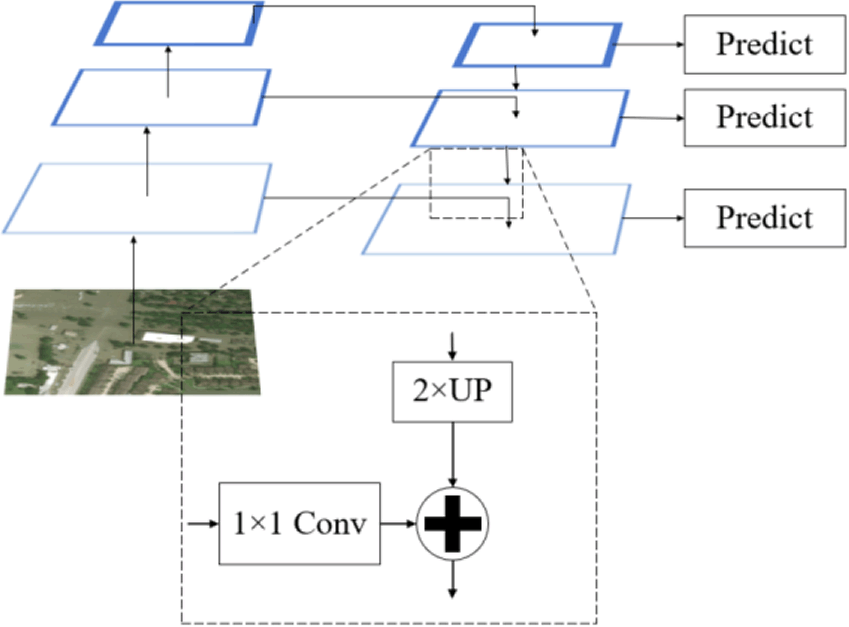
Figure 8.
Feature Pyramid Network structure diagram
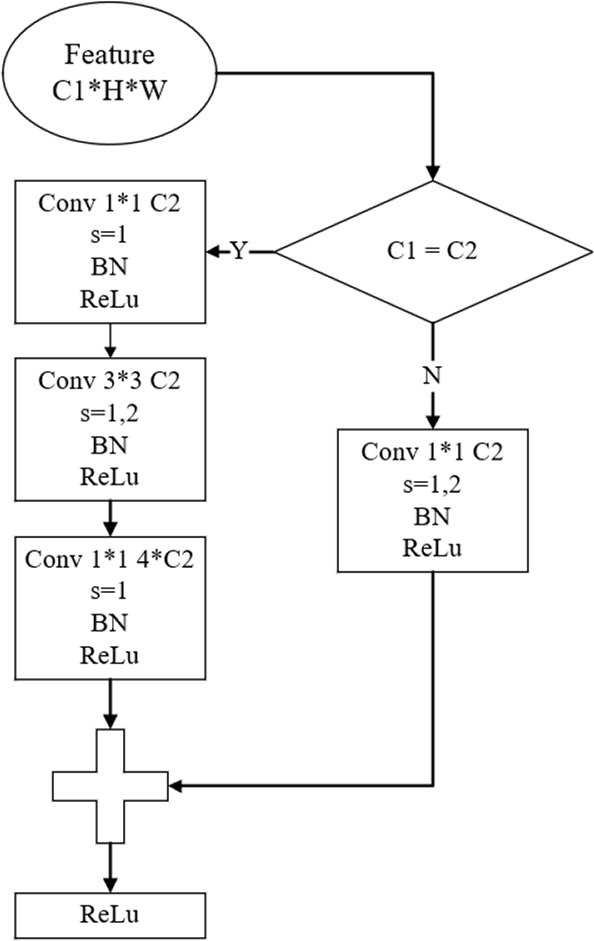
Figure 9.
Basic structure of the BottleNeck module
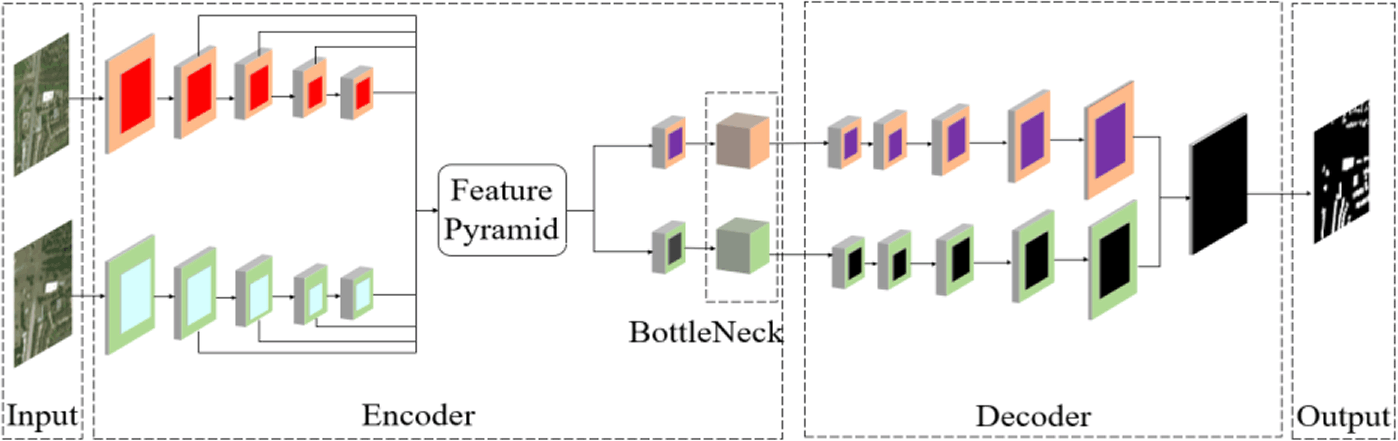
Figure 10.
Structure diagram of Siamese-CNN network model
TABLE II.
Based on the building damage level table defined in this article
| Class | Description |
|---|---|
| 0 | Undamaged |
| 1 | Minor damage |
| 2 | Major damage |
| 3 | Destroyed |
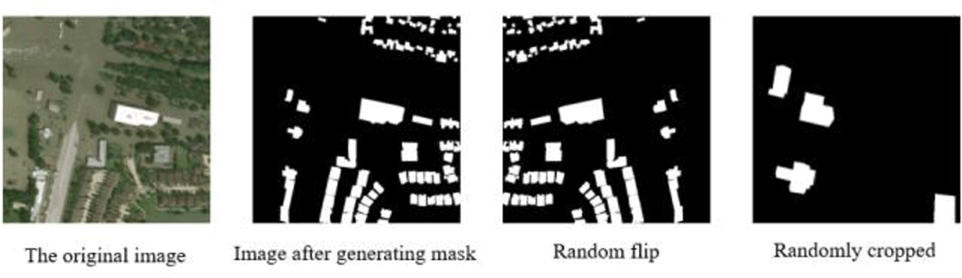
Figure 11.
Data processing renderings
TABLE III.
Training environment configuration table
| Configuration information | Detail |
|---|---|
| Hardware Configuration | Nivdia RTX 3080 12G |
| Language | Python 3.8 |
| Main Frame | Pytorch 2.1.0 Cuda11.8 |
| Image information | 1024×1024 20248 photos |
| Optimization Function | Adam |
| Loss Function | cross entropy loss |
| Epoch | 30 |
| Training time | 12h |
TABLE IV.
Confusion matrix formal table
| Prediction category | True category | Positive sample | Negative sample |
|---|---|---|---|
| Positive sample | TP | FP | |
| Negative sample | FN | TN | |
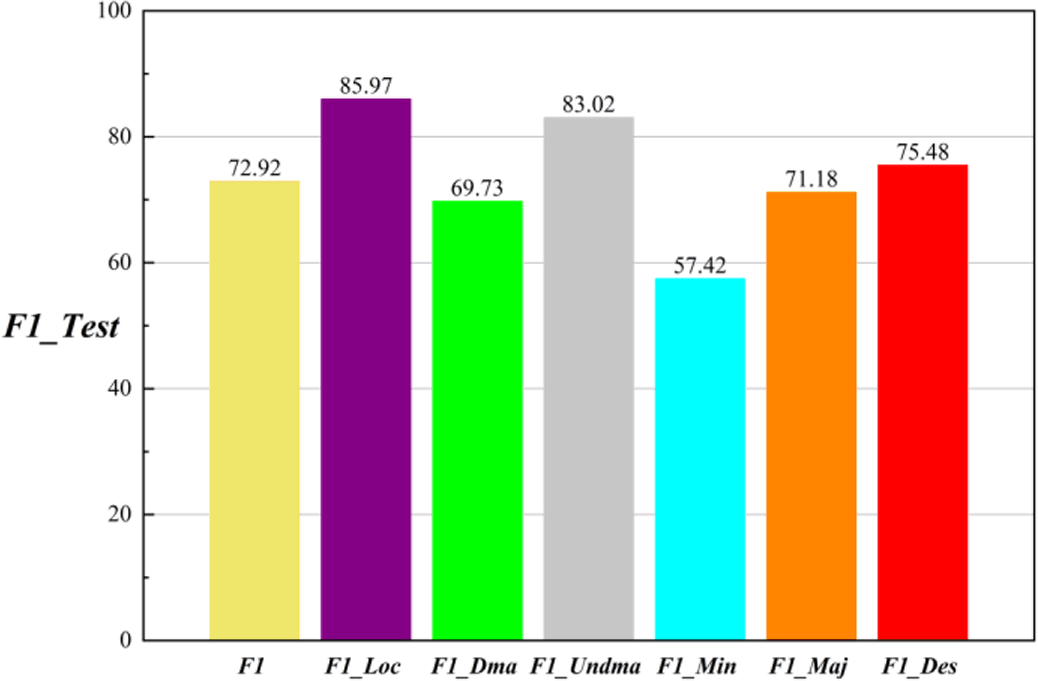
Figure 12.
The F1 Value evaluation results on test set
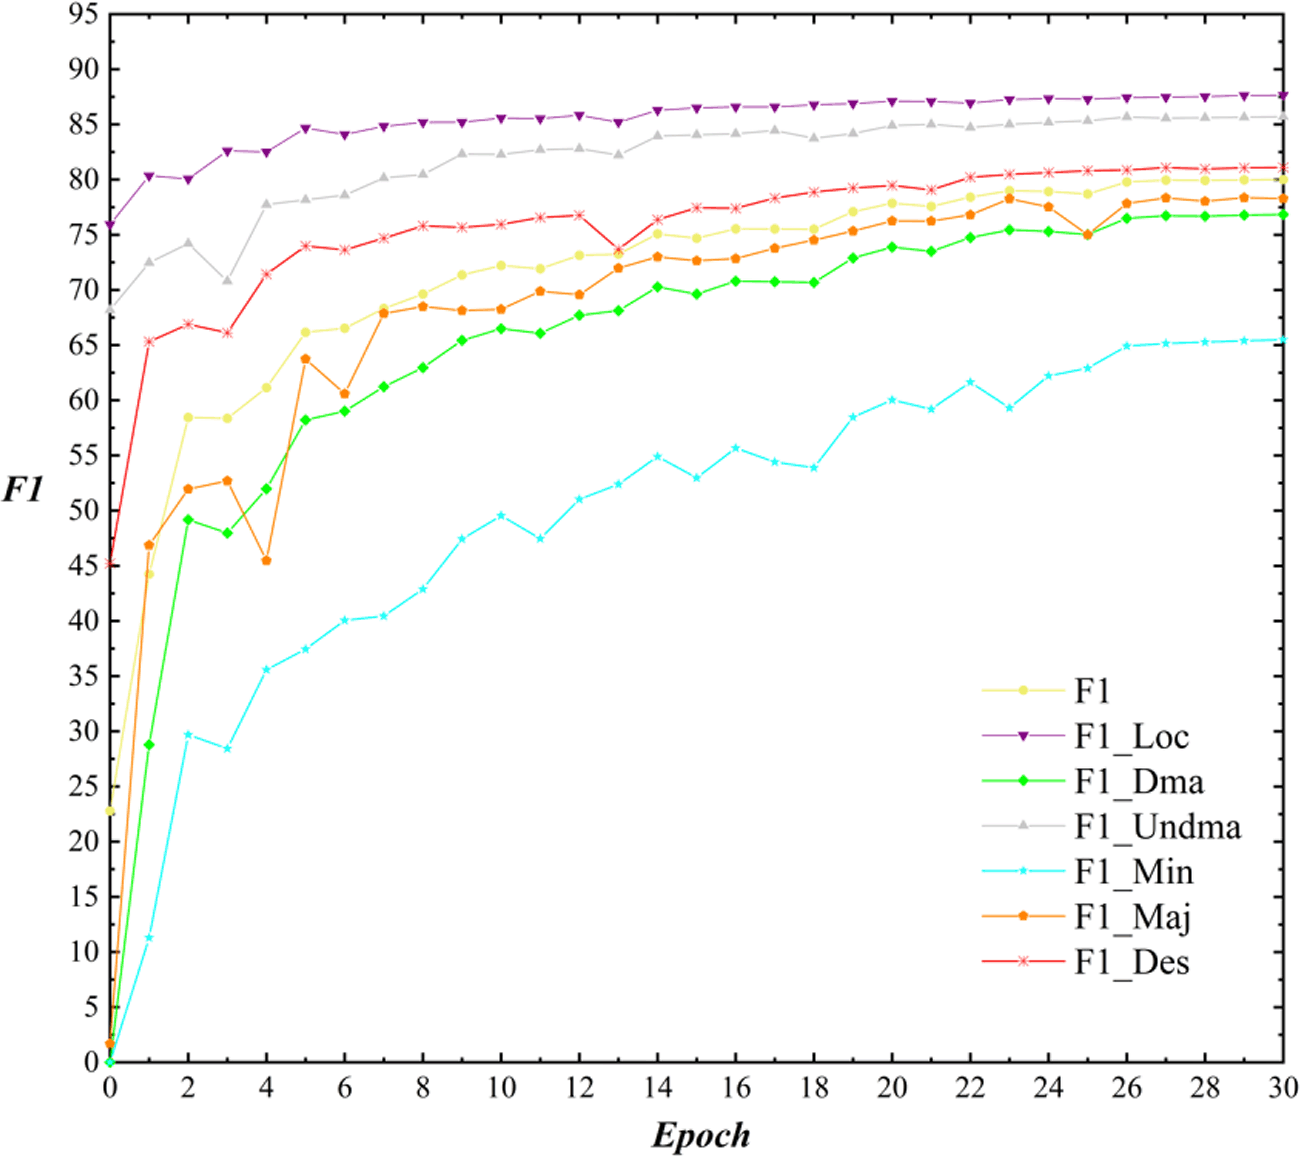
Figure 13.
Training results on validation dataset
TABLE V.
Training results on validation dataset
| Name | Explanation | Color |
|---|---|---|
| F1 | The overall F1 value of the building damage assessment on the xBD validation set | Yellow |
| F1_Loc | F1 values for segmentation of building localization on the xBD validation set | Purple |
| F1_Dam | F1 value for building damage classification on the xBD validation set | Green |
| F1_Undam | F1 value for classification of undamaged buildings on the xBD validation set | Grey |
| F1_Min | F1 value for classification of minor damage buildings on the xBD validation set | Blue |
| F1_Maj | F1 value for classification of major damage buildings on the xBD validation set | Orange |
| F1_Des | F1 value for classification of destroyed buildings on the xBD validation set | Red |
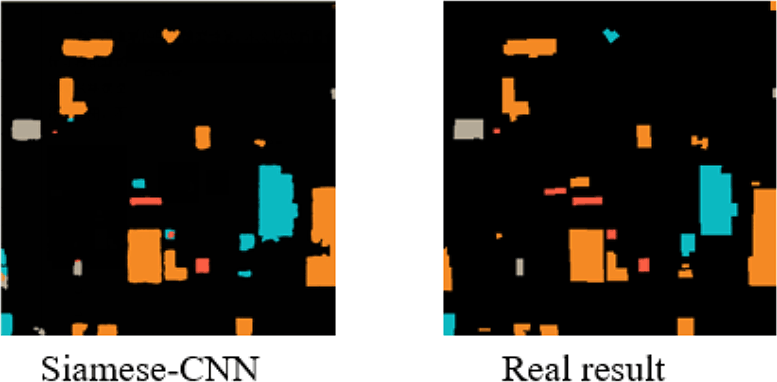
Figure 14.
Visual results of testing using Siamese-CNN network model