
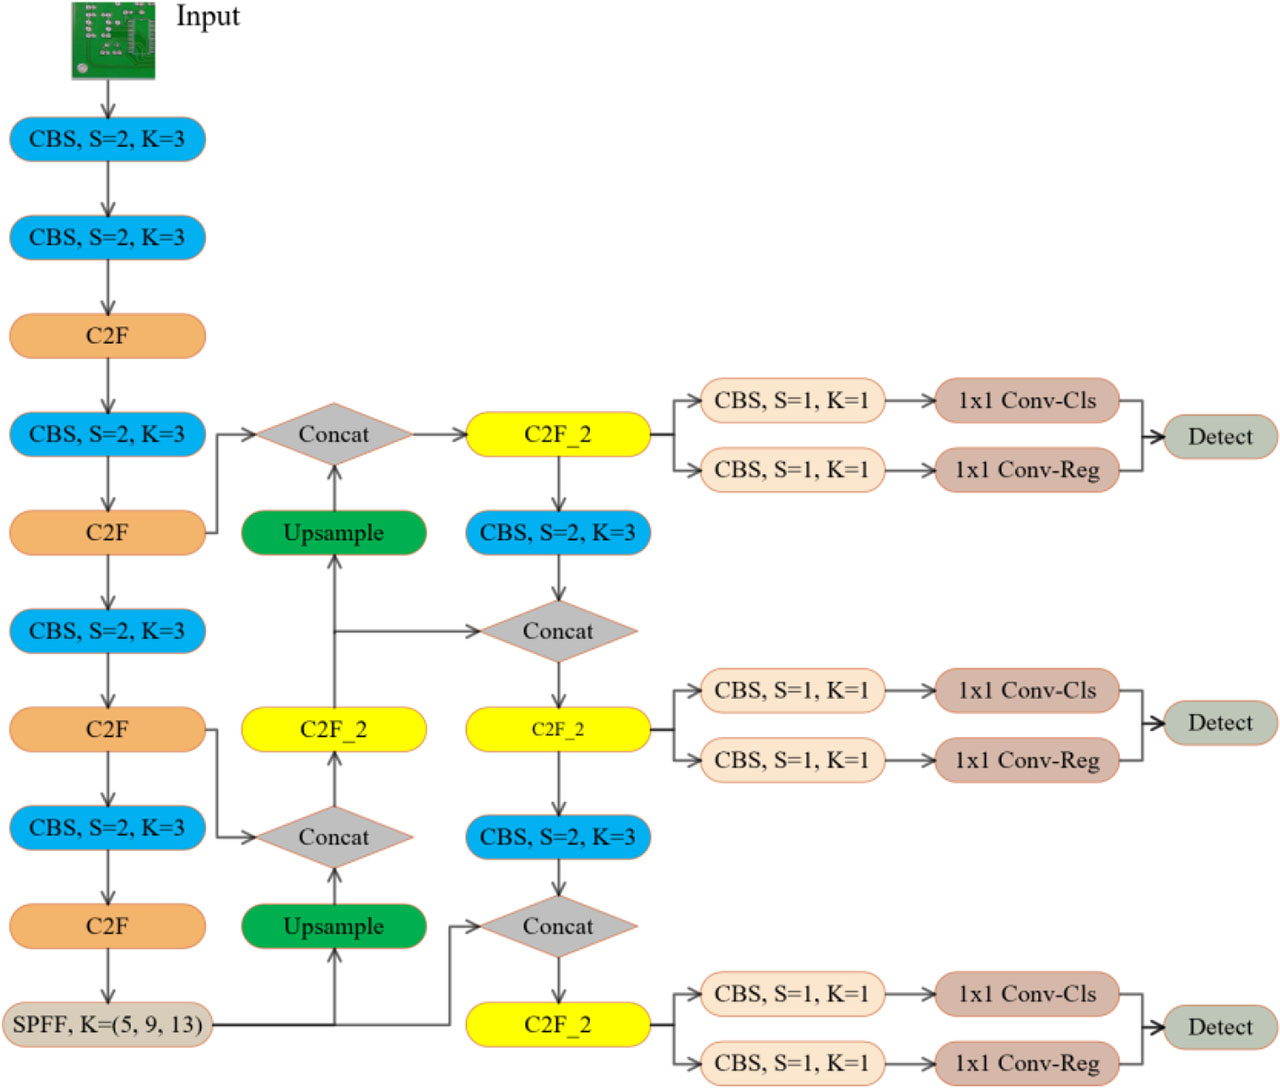
Figure 1.
Diagram of YOLOv8 structure
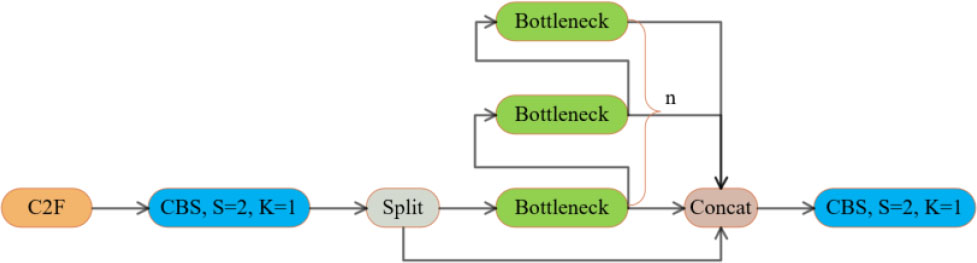
Figure 2.
Schematic diagram of C2F module

Figure 3.
Bottleneck Schematic Diagram
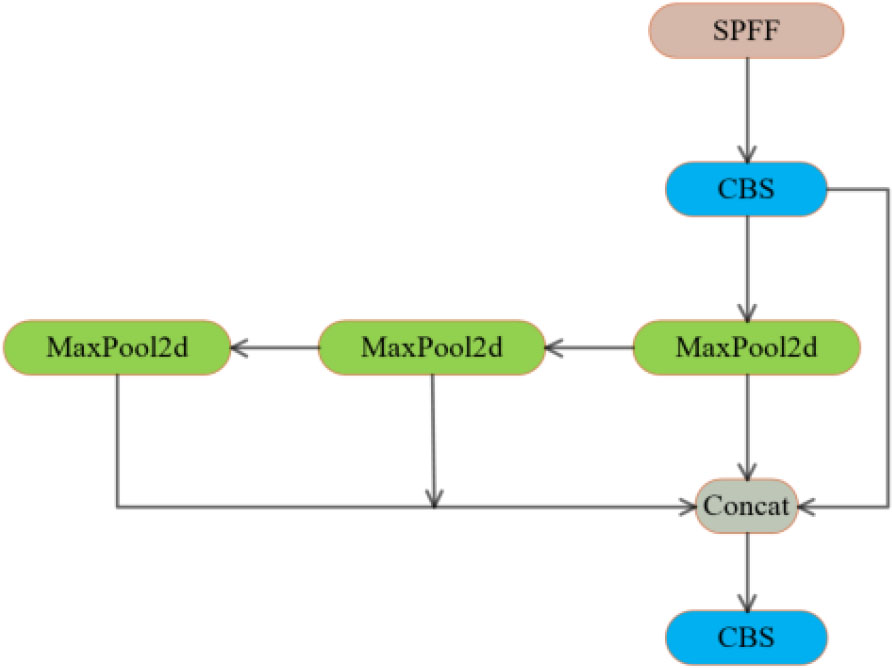
Figure 4.
Schematic diagram of SPPF structure
TABLE I.
Experimental Environment
| Experimental environment | Version |
|---|---|
| CPU | Intel Core i7-11800H |
| GPU | NVIDIA GeForce RTX307 |
| Language | Python3.7 |
| Deep Learning Framework | Pytorch1.11.0 |
| CUDA | 11.3.0 |
| Compiler | Pycharm2021 |
TABLE II.
Experimental Results
| Model | mAP(%) | FPS | Quantity of participants/M |
|---|---|---|---|
| Faster R-CNN | 89.5 | 20.5 | 125.3 |
| YOLOv5 | 85.3 | 79.4 | 42.7 |
| YOLOv7 | 87.1 | 102.5 | 37.2 |
| YOLOv8 | 92.3 | 157.2 | 28.5 |
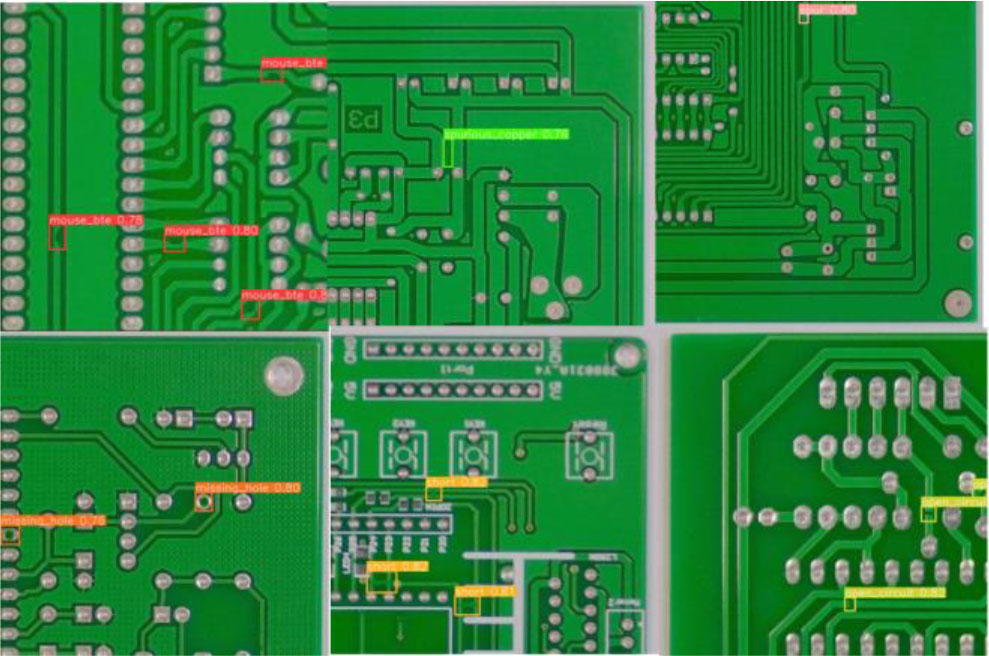
Figure 5.
Pcb defect detection effect
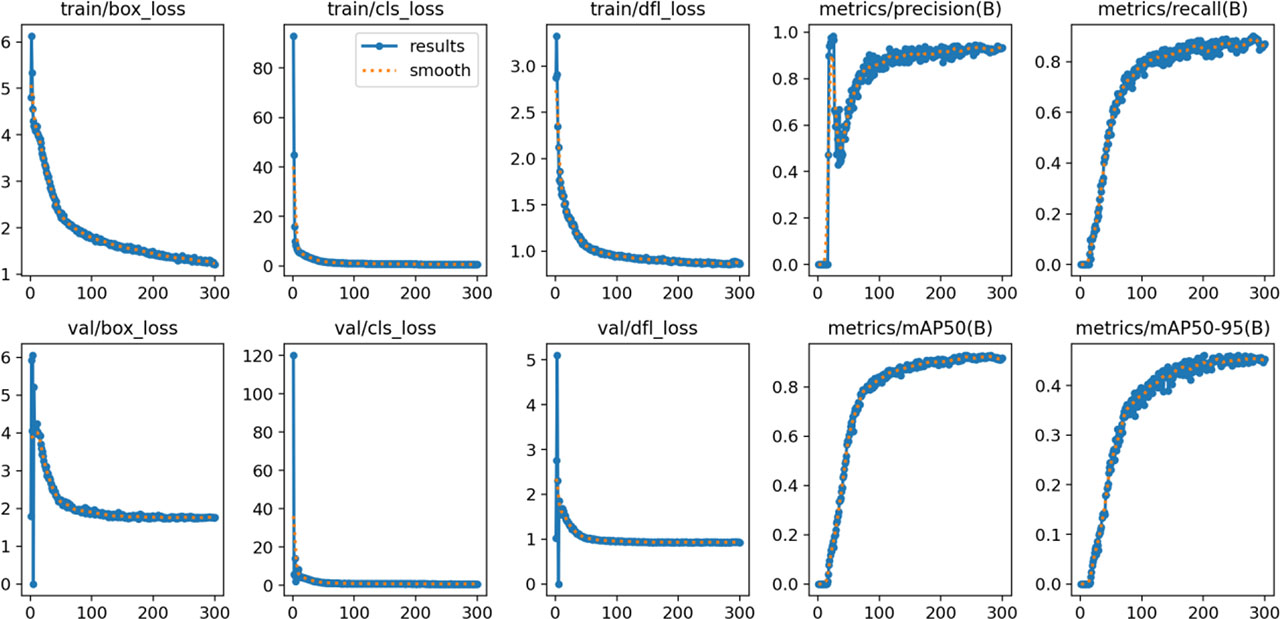
Figure 6.
Loss, Precision, Recall, mPA0.5 and mAP0.5-0.95 curves