
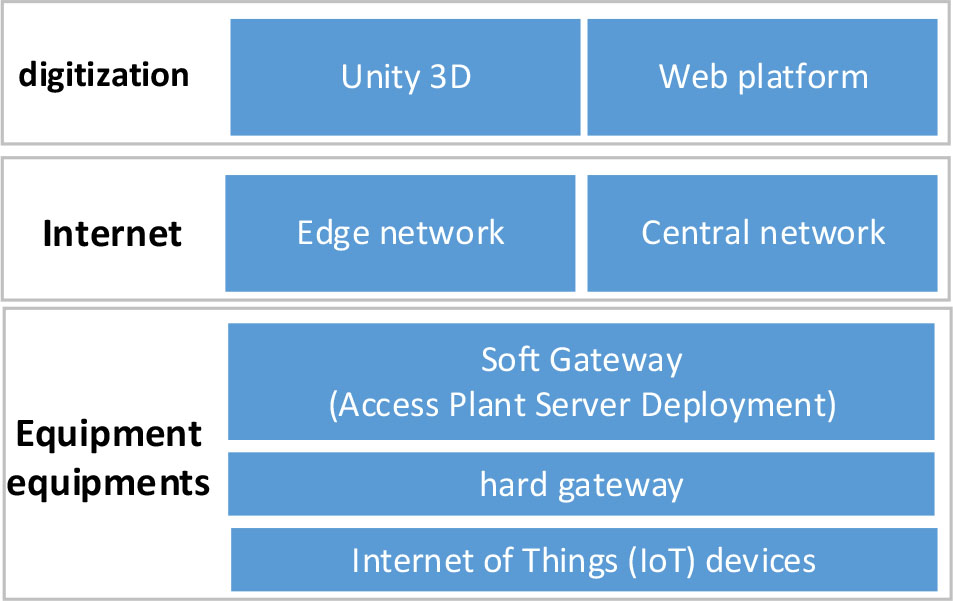
Figure 1.
Platform Deployment Architecture Diagram
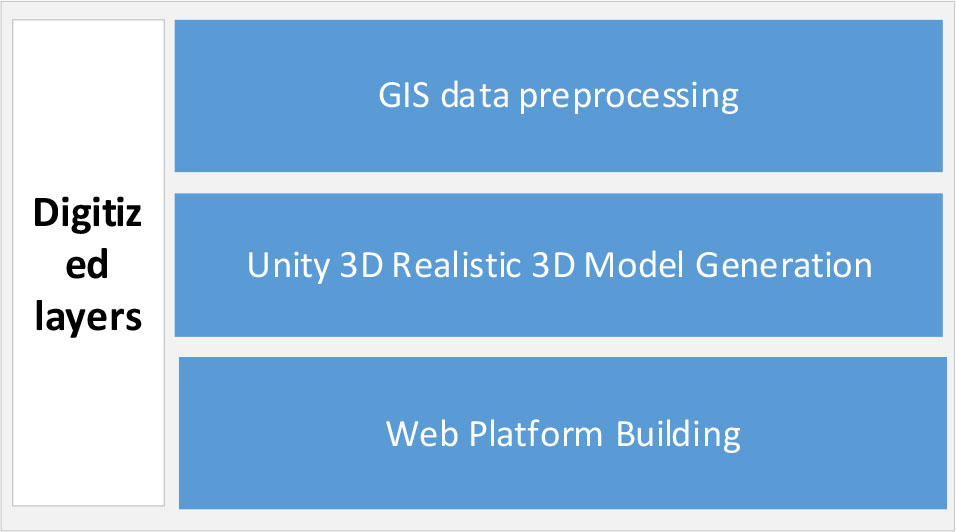
Figure 2.
Mathematical Layer Architecture Diagram
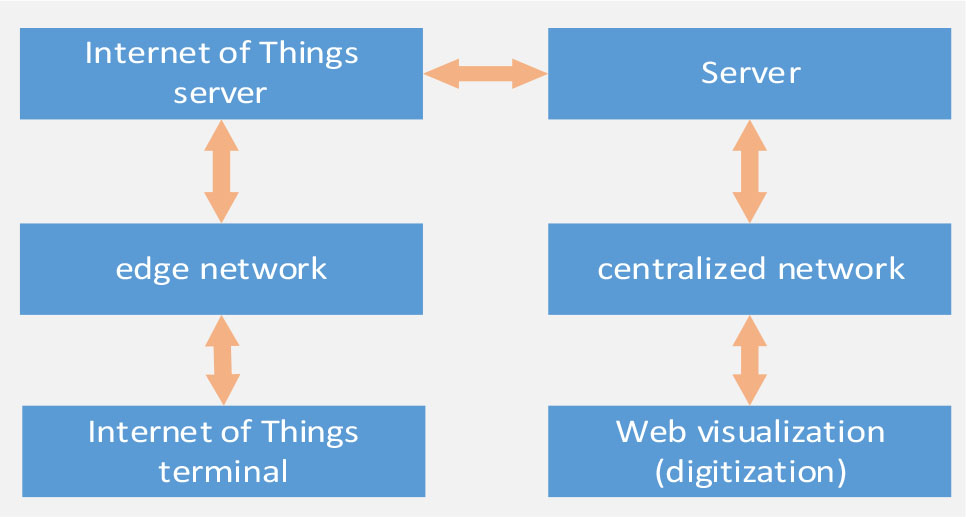
Figure 3.
Network layer architecture diagram
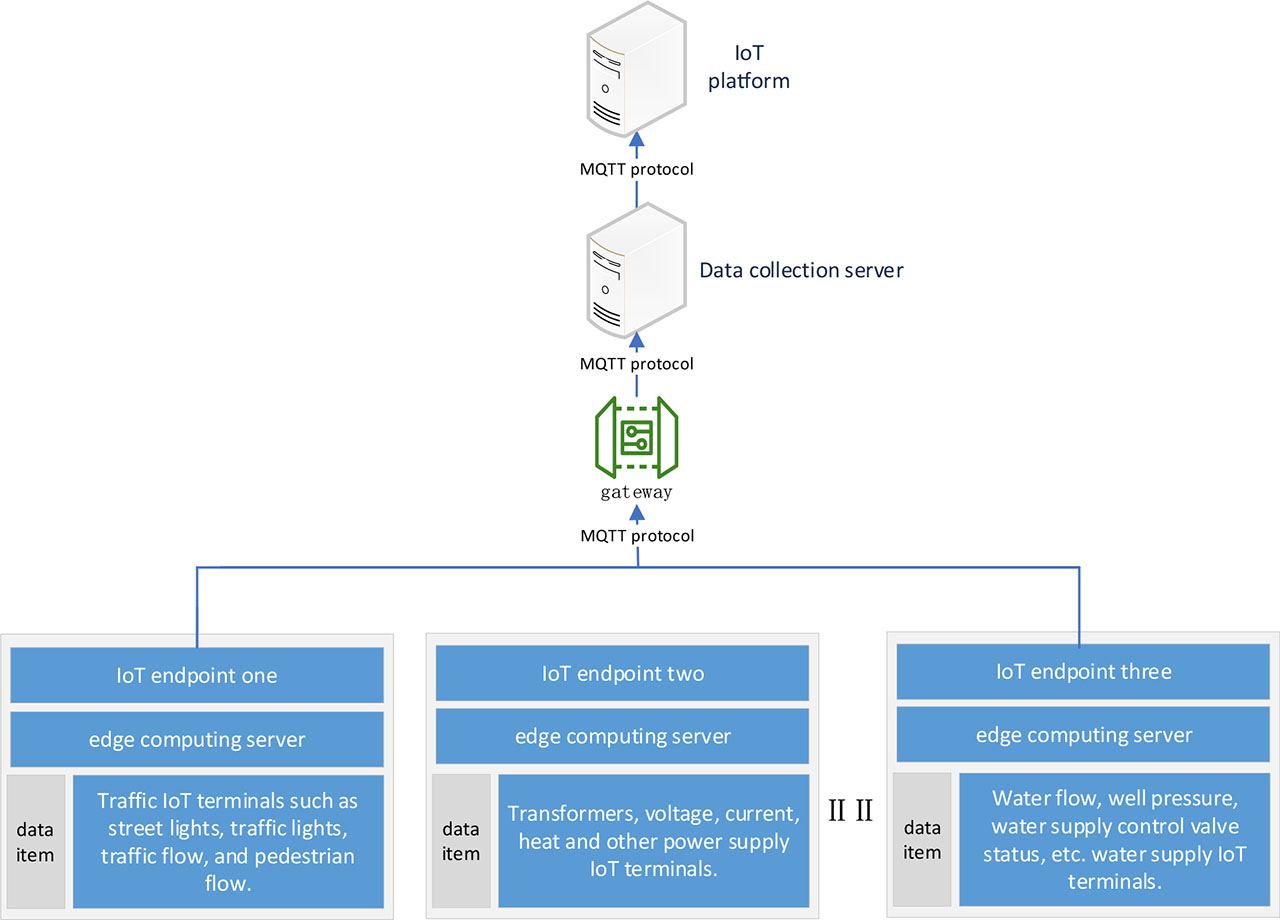
Figure 4.
Device layer network topology diagram
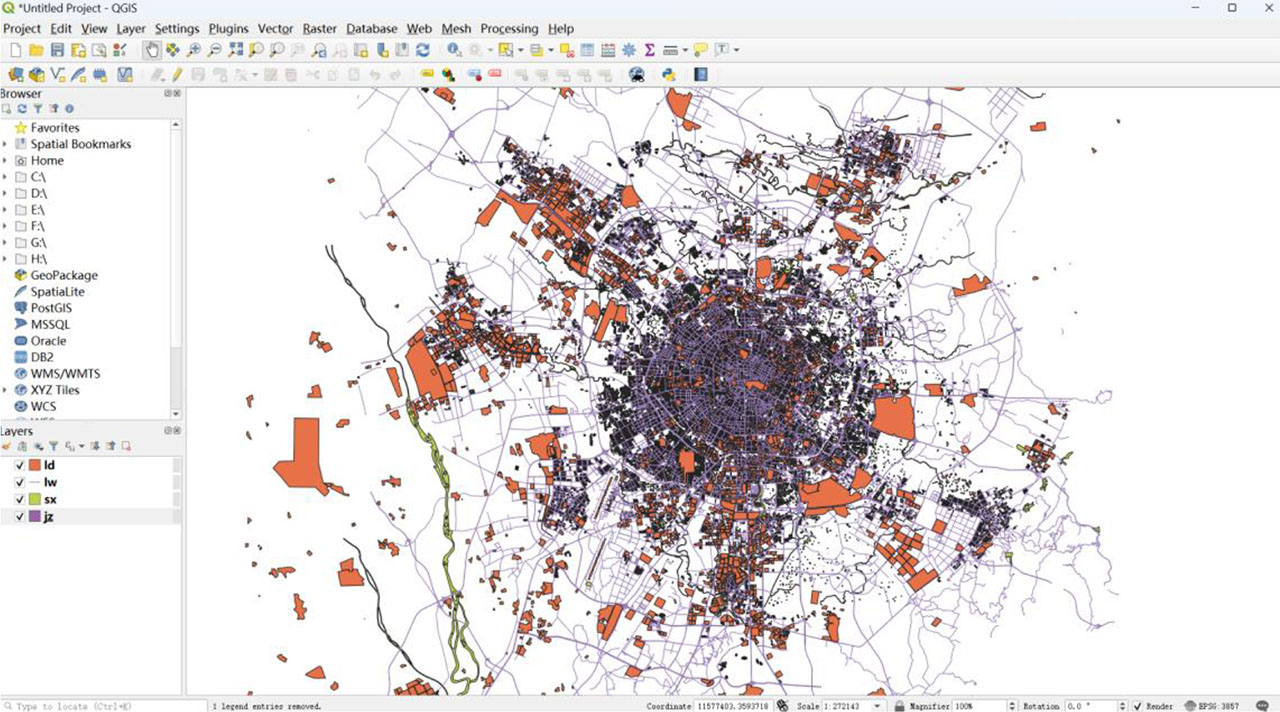
Figure 5.
GIS data preprocessing diagram
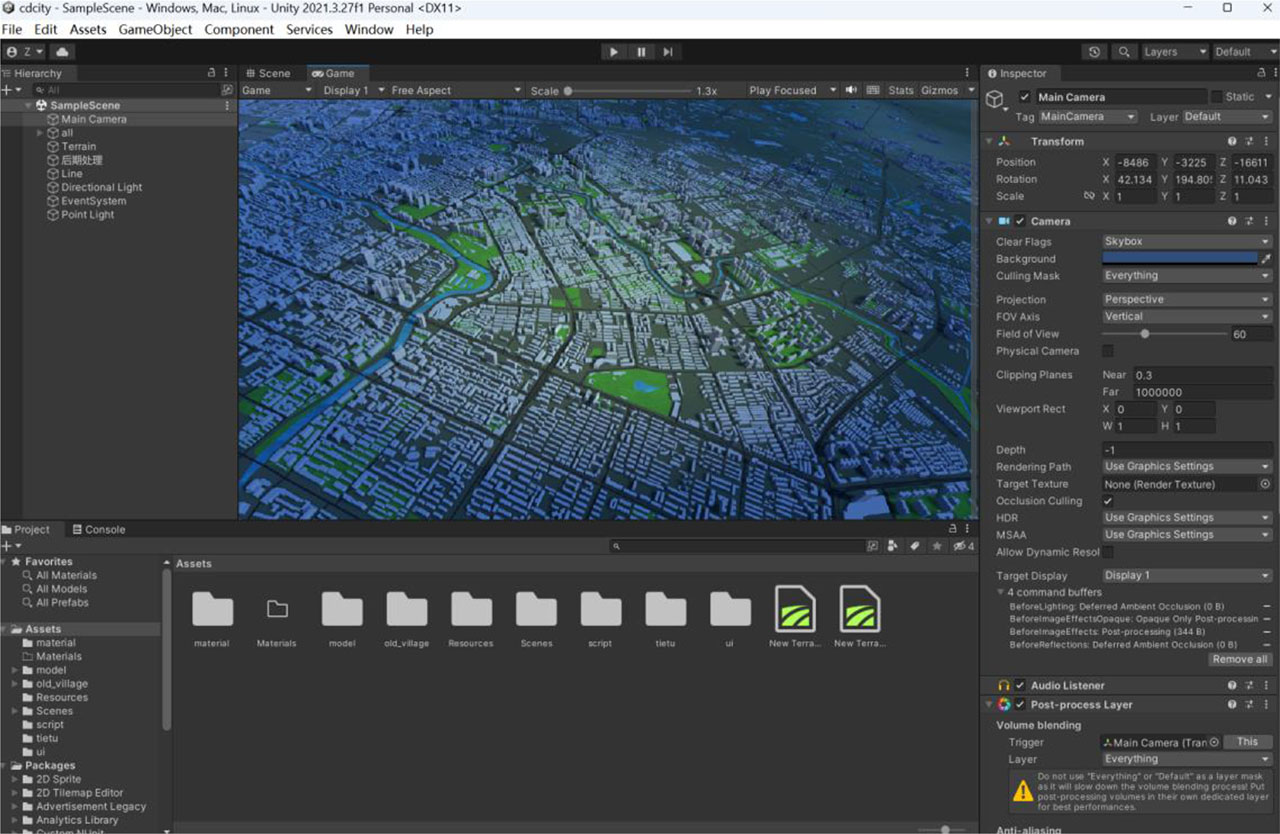
Figure 6.
Unity 3D generates three-dimensional real-life imagesimages

Figure 7.
IoT server visual interface
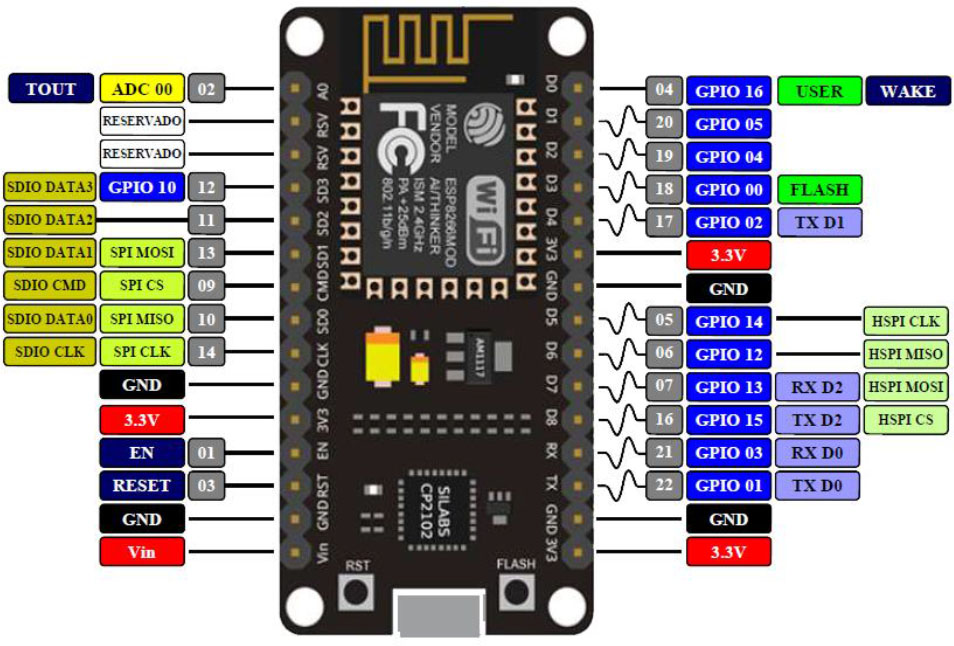
Figure 8.
NodeMCU Development Board Pinout
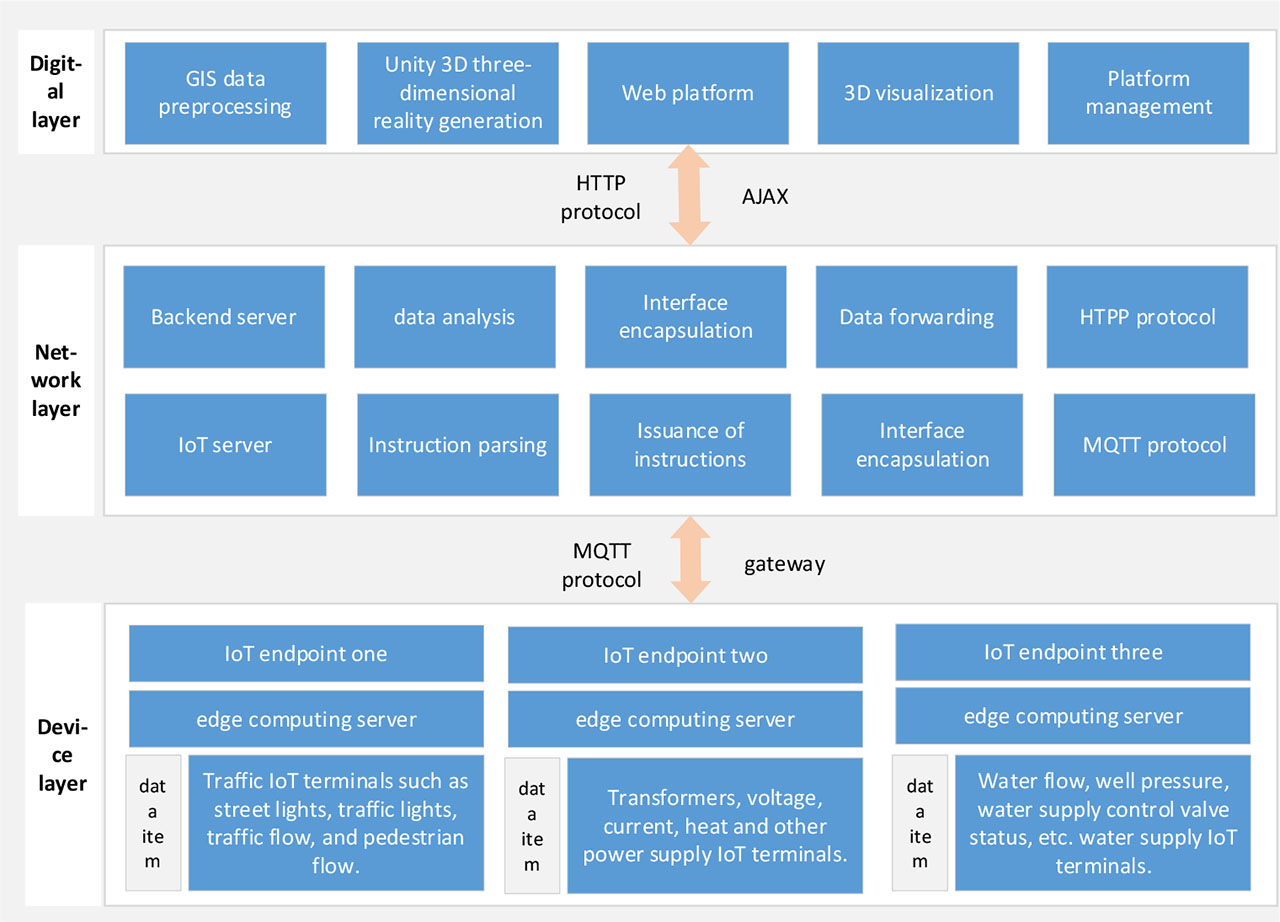
Figure 9.
General Architecture Diagram of a Smart City
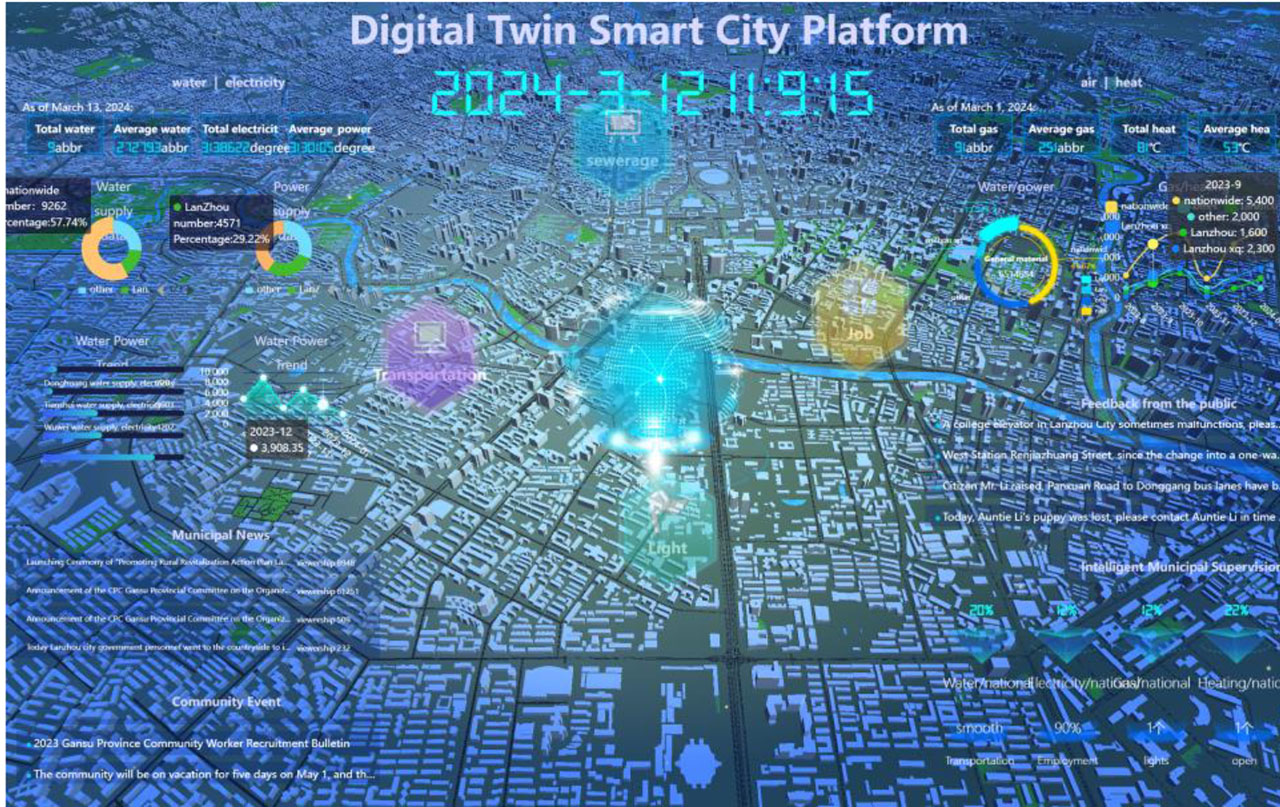
Figure 10.
Digital twin platform for a smart city
TABLE I.
Coupling, independent working, cross-platform verification table
| module | Coupling | working independently | cross-platform |
|---|---|---|---|
| Unity 3D | Low coupling | Yes | Yes |
| Web platform | Low coupling | Yes | Yes |
| IoT terminal | Low coupling | Yes | Yes |
| backend server | Low coupling | Yes | Yes |
TABLE II.
Software used in engineering and its functions
| software | effect |
|---|---|
| Visual Studio Code | Develop web platform and server and write corresponding code. |
| QGIS | Preprocess GIS data, such as data pruning. |
| Unity 3D | Generate 3D reality models. |
| Visual Studio 2022 | Write C# scripts for dynamic interaction in Unity 3D. |
| Arduino IDE | Hardware program writing and burning. |
| Postman | Data interaction API interface test. |
TABLE III.
Comparison of Architecture Development Cycle Times and Their Coupling Data Table
| Construction Methods | traditionally constructed | this paper constructs |
|---|---|---|
| digitalization layer | 24h(high coupling) | 18h(Low coupling) |
| network layer | 48h(high coupling) | 40h(Low coupling) |
| device layer | 10h(high coupling) | 8h(Low coupling) |
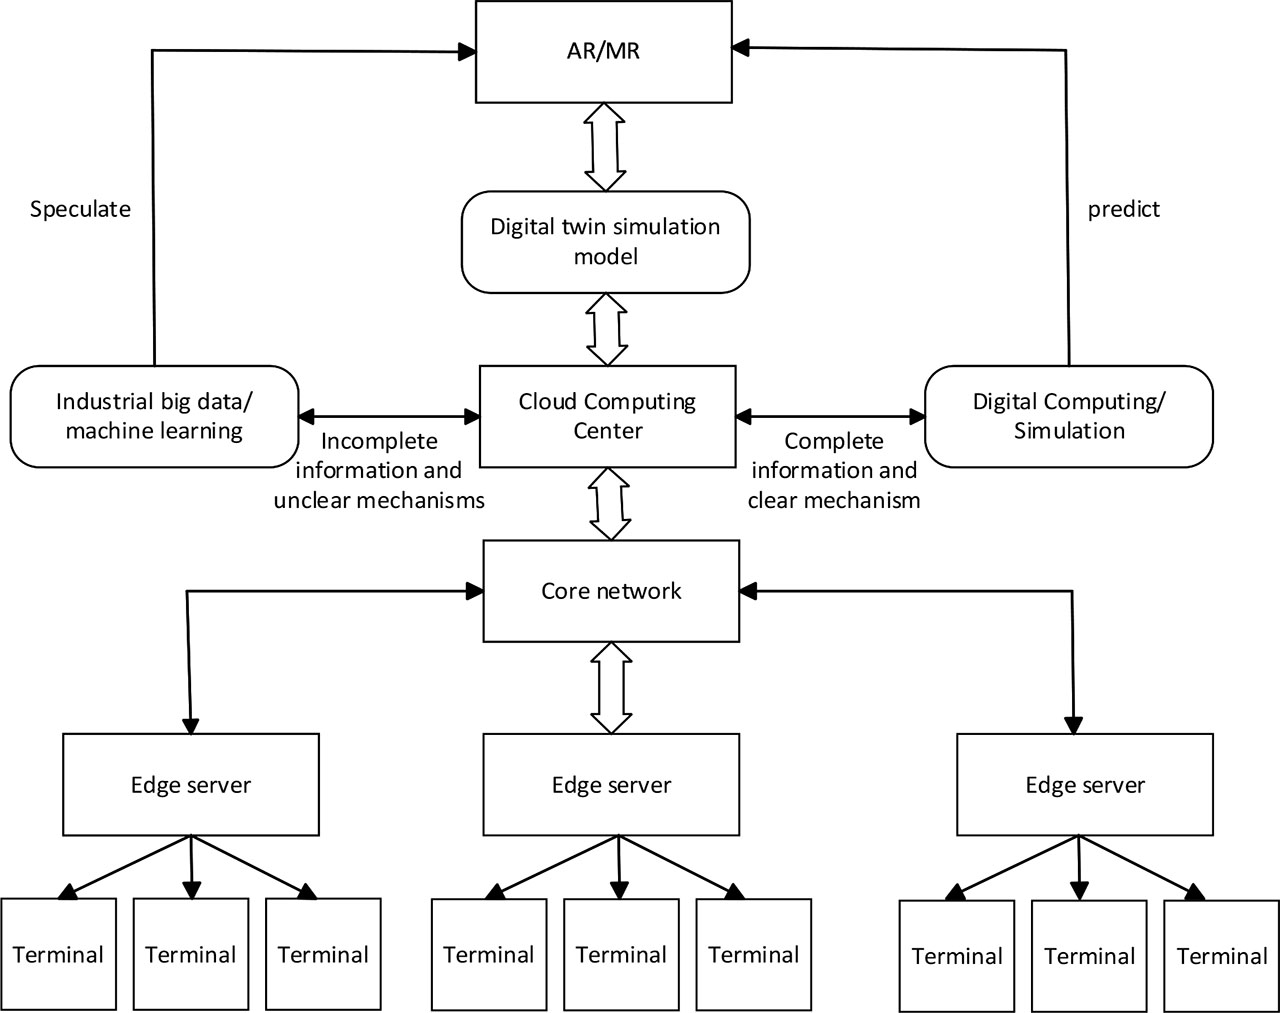
Figure 11.
Architecture upgrade flow chart