
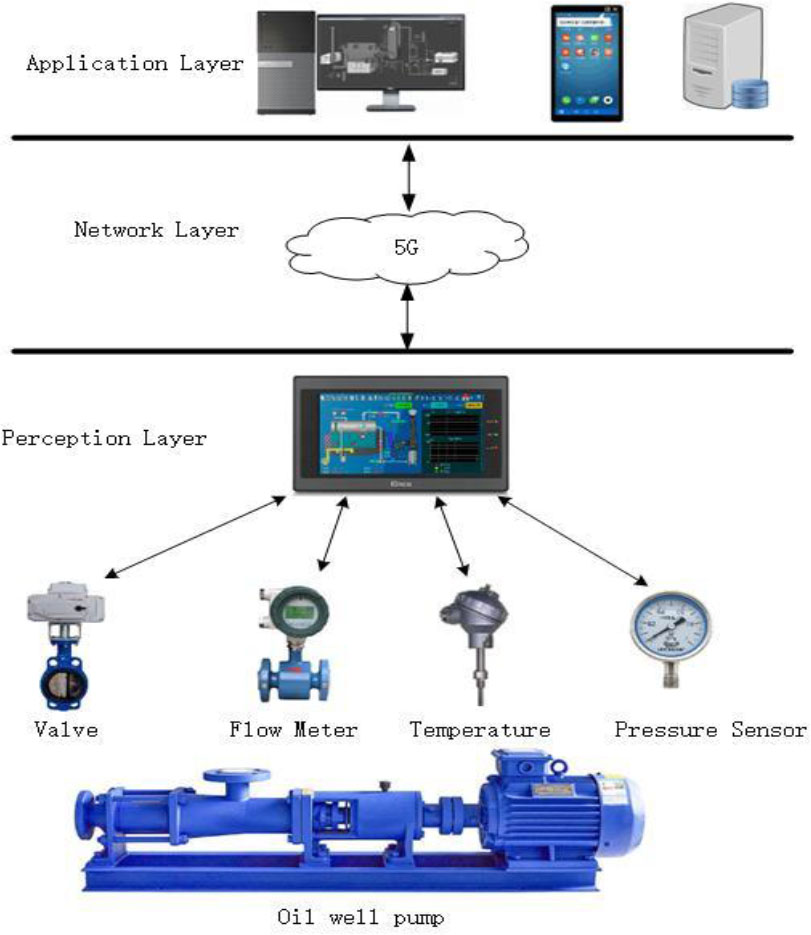
Figure 1.
Organization structure of the system based on internet of things technology
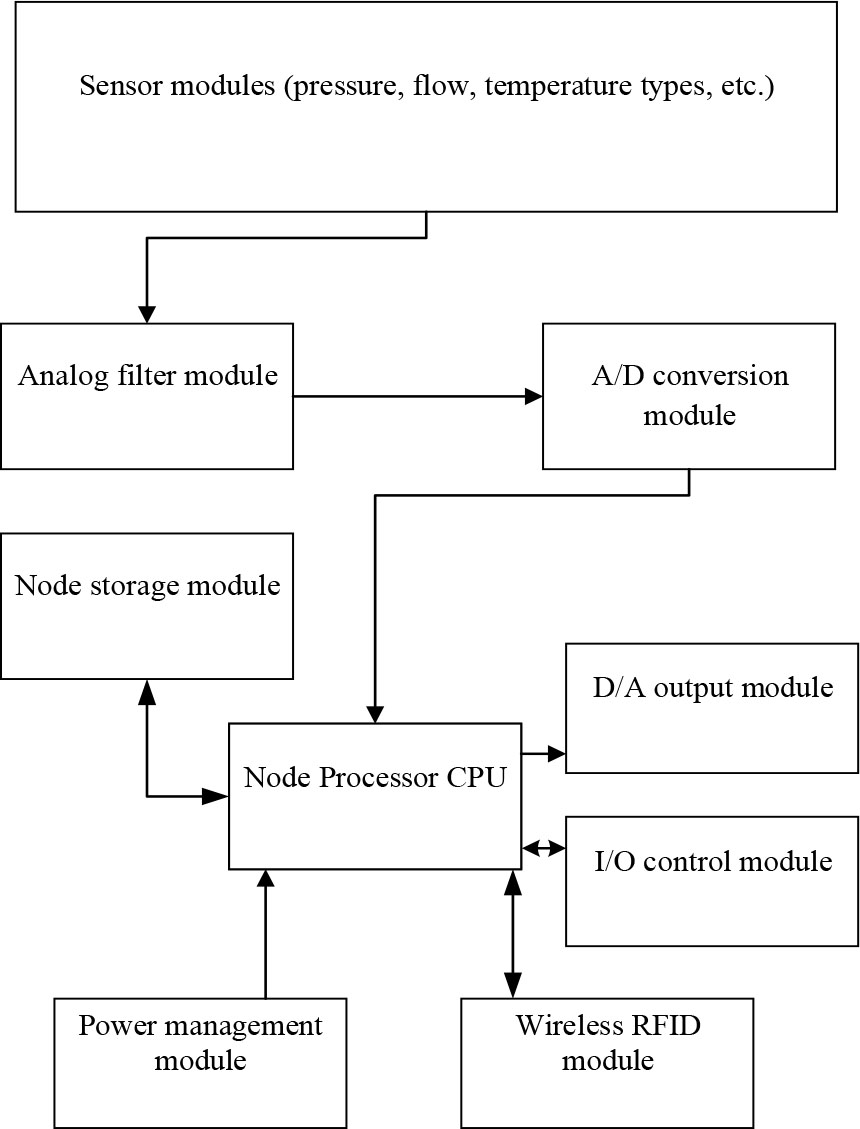
Figure 2.
Hardware components theory block diagram of the fuel pump sensor instrument node
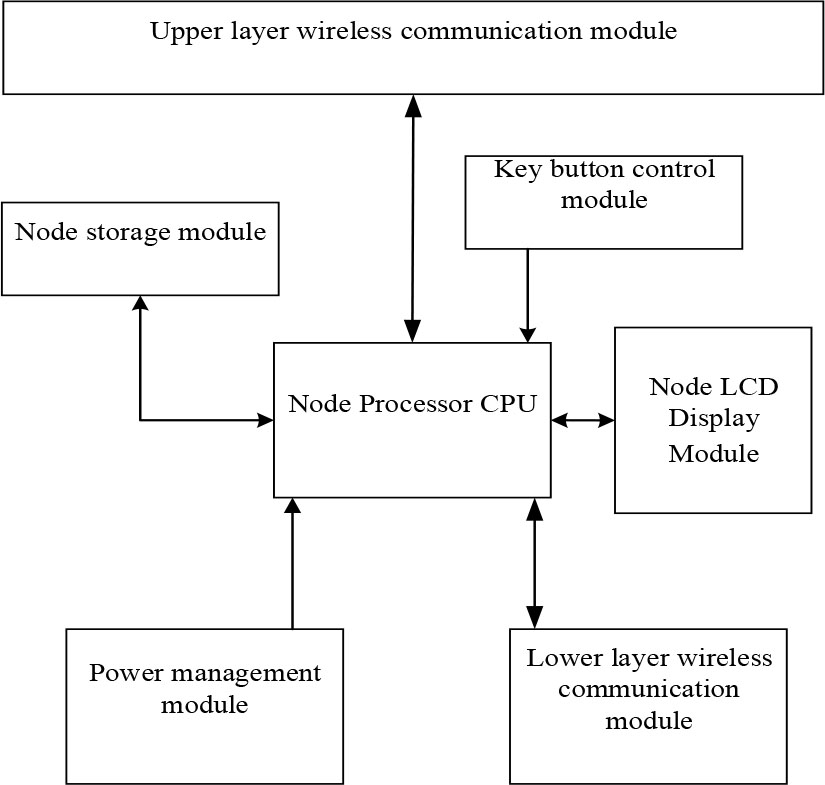
Figure 3.
Hardware components theory block diagram of the IOT aggregation instrument node
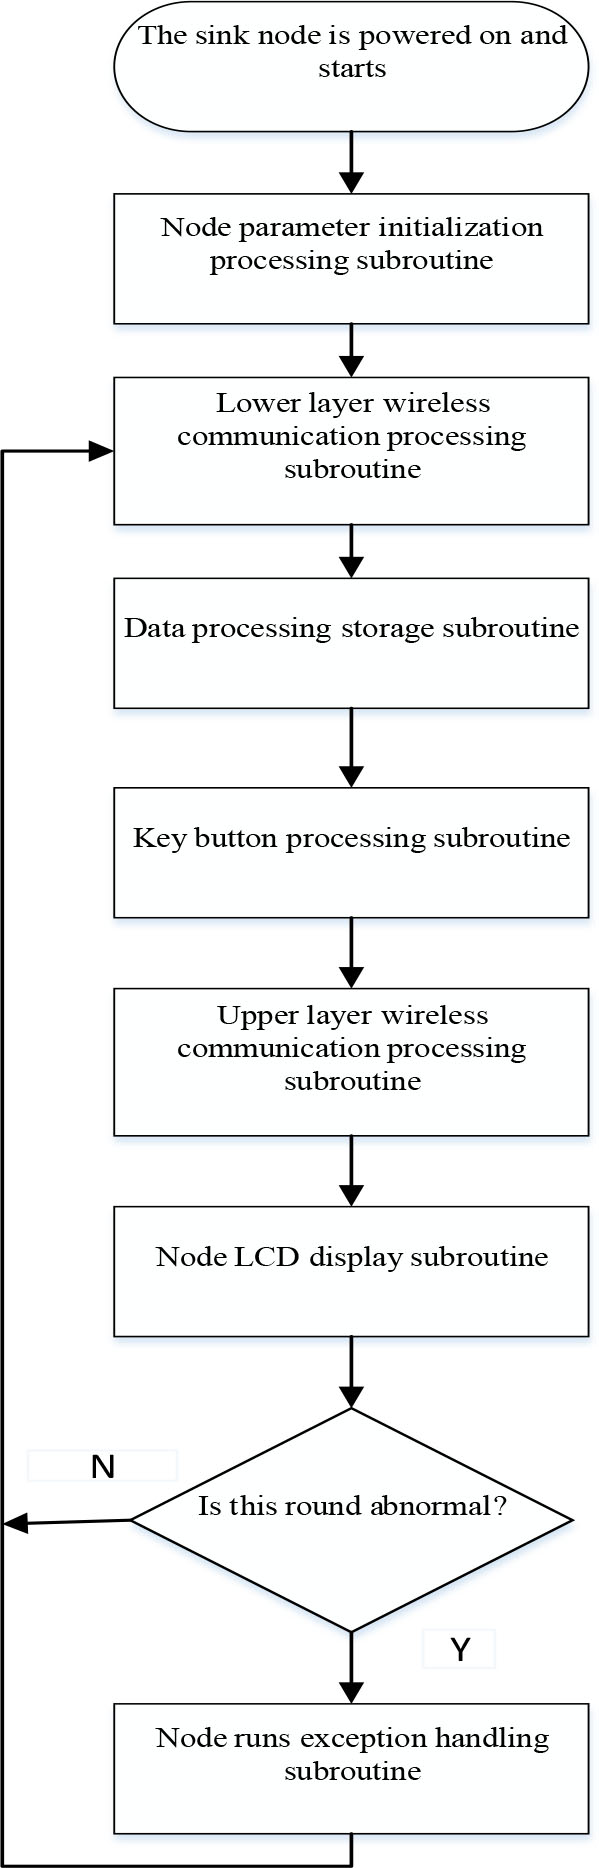
Figure 4.
MCU control program flow chart of the IOT aggregation instrument node
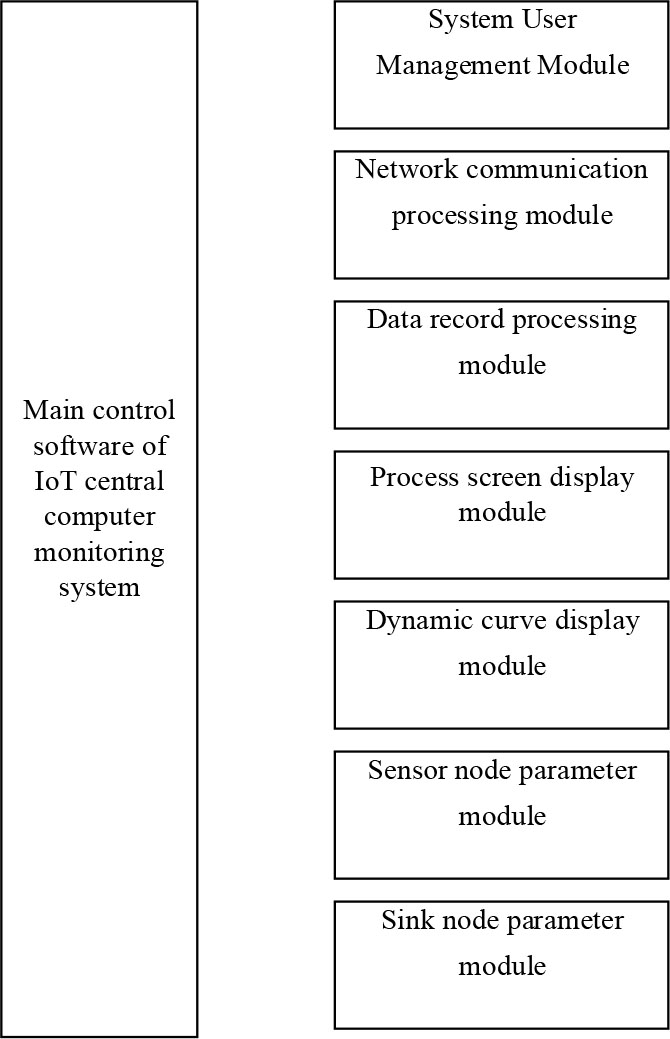
Figure 5.
Module structure diagram of the IOT center computer monitor system software
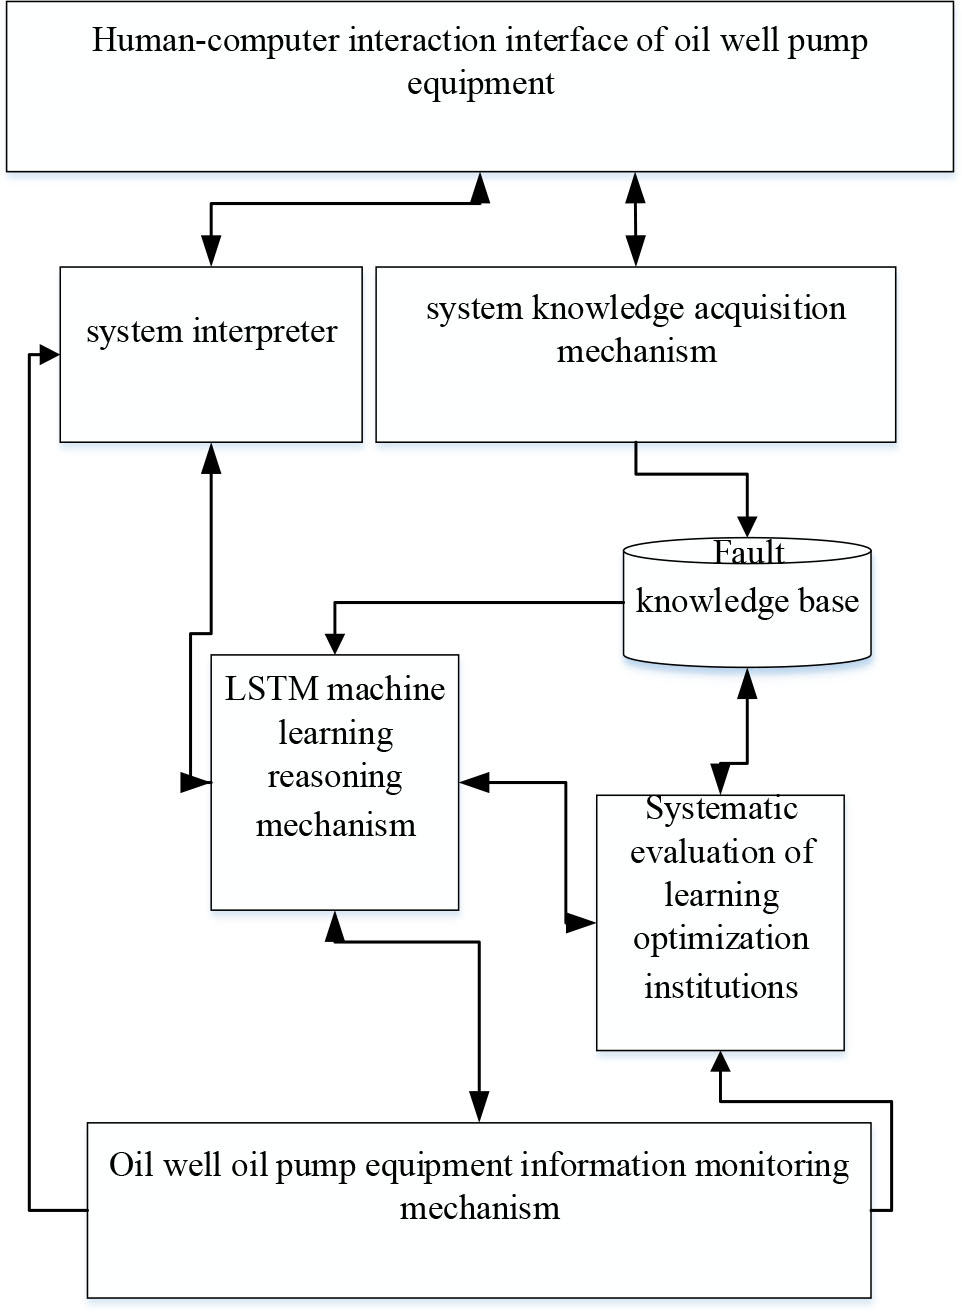
Figure 6.
The structure of the expert system for oil well pump LSTM machine learning fault diagnosis
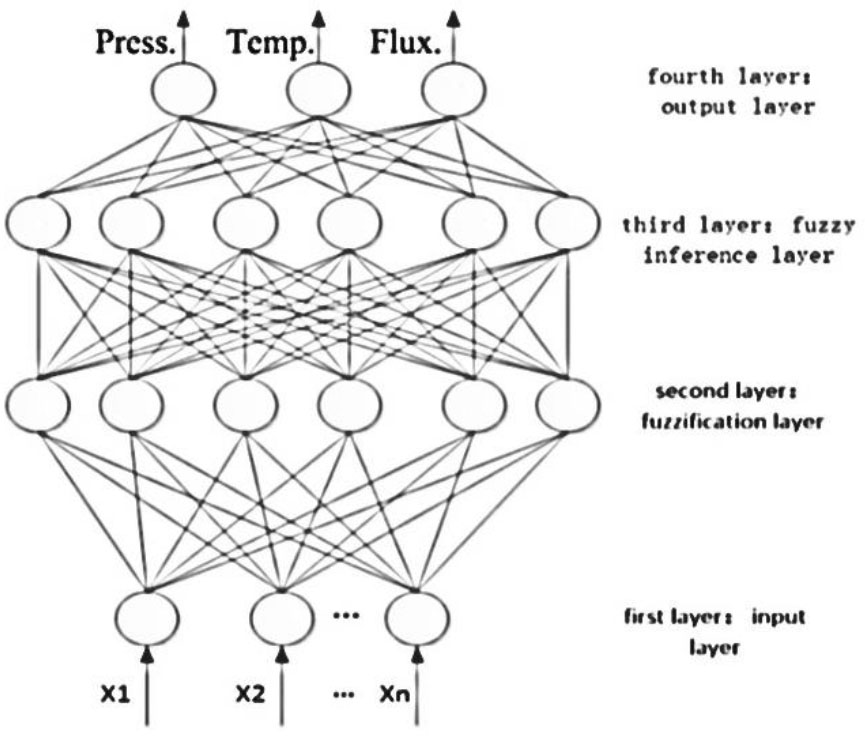
Figure 7.
Neural network module structure diagram
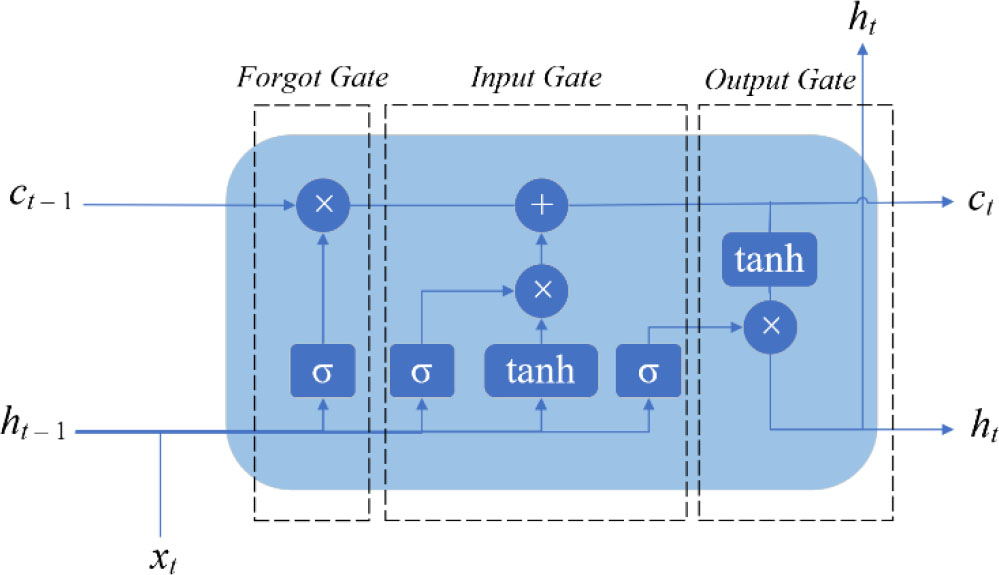
Figure 8.
LSTM machine learning model structure principle
TABLE I.
Top 20 records in the data set used by oil well pump machine learning
| Code | Date | Time | Oil Pressure (Mpa) |
|---|---|---|---|
| 1 | 6/1 | 0:00 | 1.69 |
| 2 | 6/1 | 1:00 | 1.81 |
| 3 | 6/1 | 2.00 | 2 |
| 4 | 6/1 | 300 | 1.97 |
| 5 | 6/1 | 4:00 | 1.84 |
| 6 | 6/1 | 5:00 | 2.01 |
| 7 | 6/1 | 6:00 | 1.62 |
| 8 | 6/1 | 7:00 | 1.89 |
| 9 | 6/1 | 8:00 | 2.14 |
| 10 | 6/1 | 9.00 | 2 |
| 11 | 6/1 | 10:00 | 2.06 |
| 12 | 6/1 | 1100 | 1.8 |
| 13 | 6/1 | 12:00 | 1.65 |
| 14 | 6/1 | 13:00 | 1.67 |
| 15 | 6/1 | 14:00 | 2.11 |
| 16 | 6/1 | 15.00 | 1.88 |
| 17 | 6/1 | 16:00 | 2.12 |
| 18 | 6/1 | 17:00 | 1.54 |
| 19 | 6/1 | 18:00 | 2.08 |
| 20 | 6/1 | 19:00 | 2.02 |
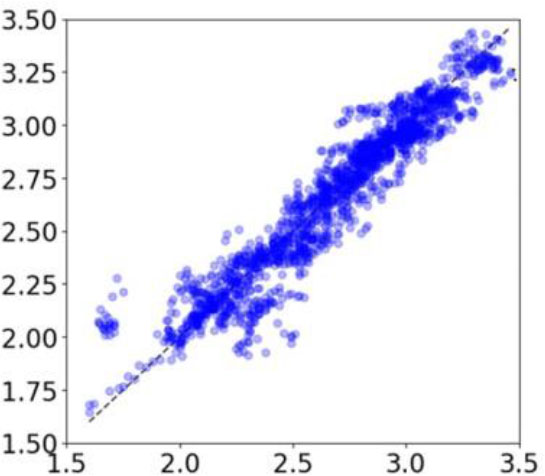
Figure 9.
Fault diagnosis and prediction scatter diagram of oil well pump oil delivery pressure training set
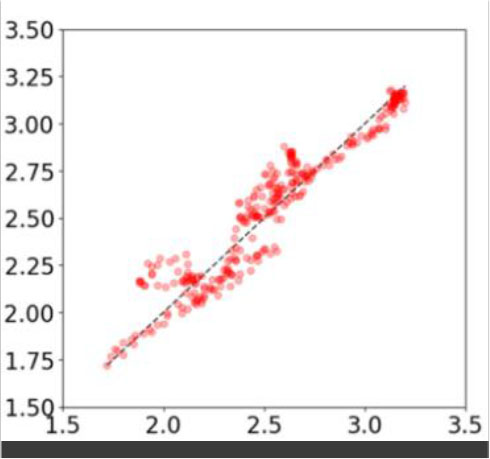
Figure 10.
Oil well pump oil delivery pressure test set fault diagnosis and prediction scatter diagram
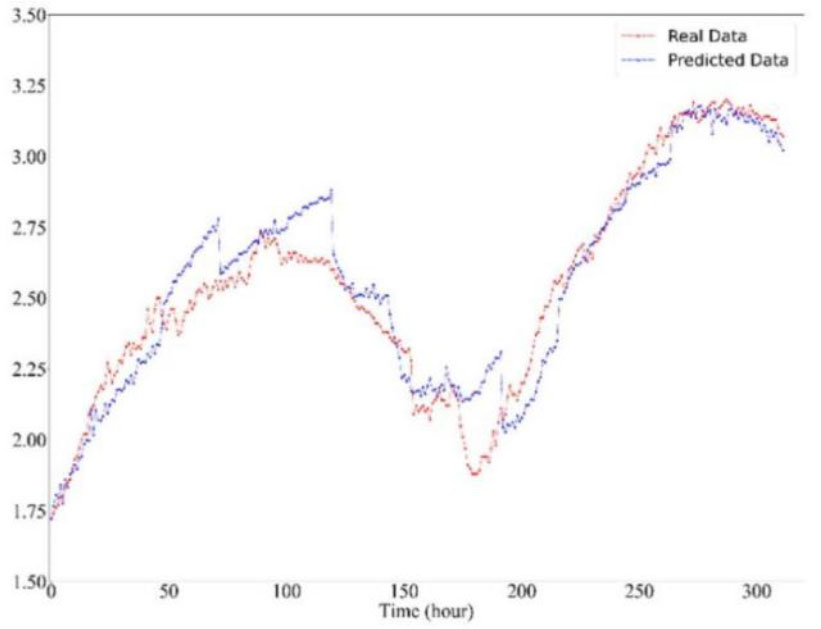
Figure 11.
Comparison chart of machine learning actual value and predicted value of oil delivery pressure of oil well delivery pump