
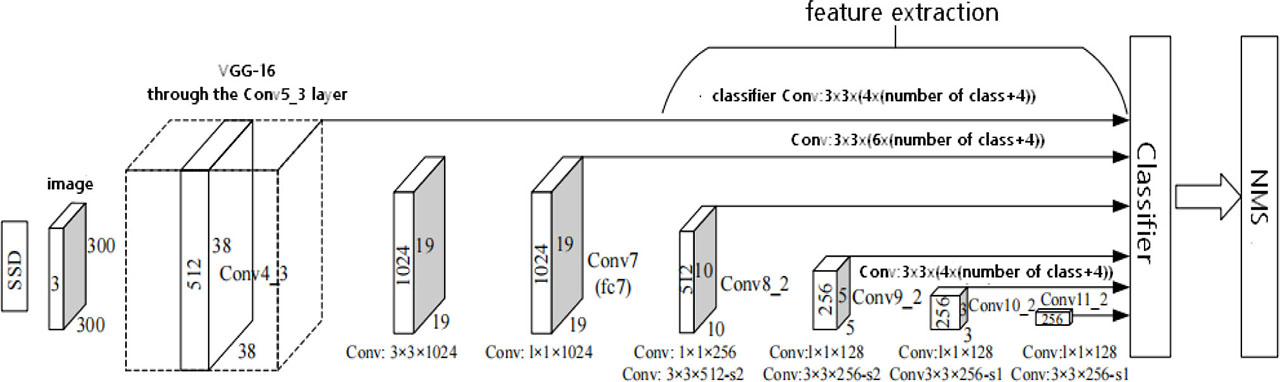
Figure 1.
Schematic diagram of SSD network structure
TABLE I.
Default dimension and quantity of feature map
| Feature Map | Width and height of the feature map | Default boxes size | Number of default boxes |
| Feature Map1 | 38 × 38 | 21{1/2,1,2}; {1} | 38 × 38 × 4 |
| Feature Map2 | 19 × 19 | 45{1/3,1/2,1,2,3}; {1} | 19 × 19 × 6 |
| Feature Map3 | 10 × 10 | 99{1/3,1/2,1,2,3}; {1} | 10 × 10 × 6 |
| Feature Map4 | 5 × 5 | 153{1/3,1/2,1,2,3}; {1} | 5 × 5 × 6 |
| Feature Map5 | 3 × 3 | 207{1/2,1,2}; {1} | 3 × 3 × 4 |
| Feature Map6 | 1 × 1 | 261{1/2,1,2}; {1} | 1 × 1 × 4 |
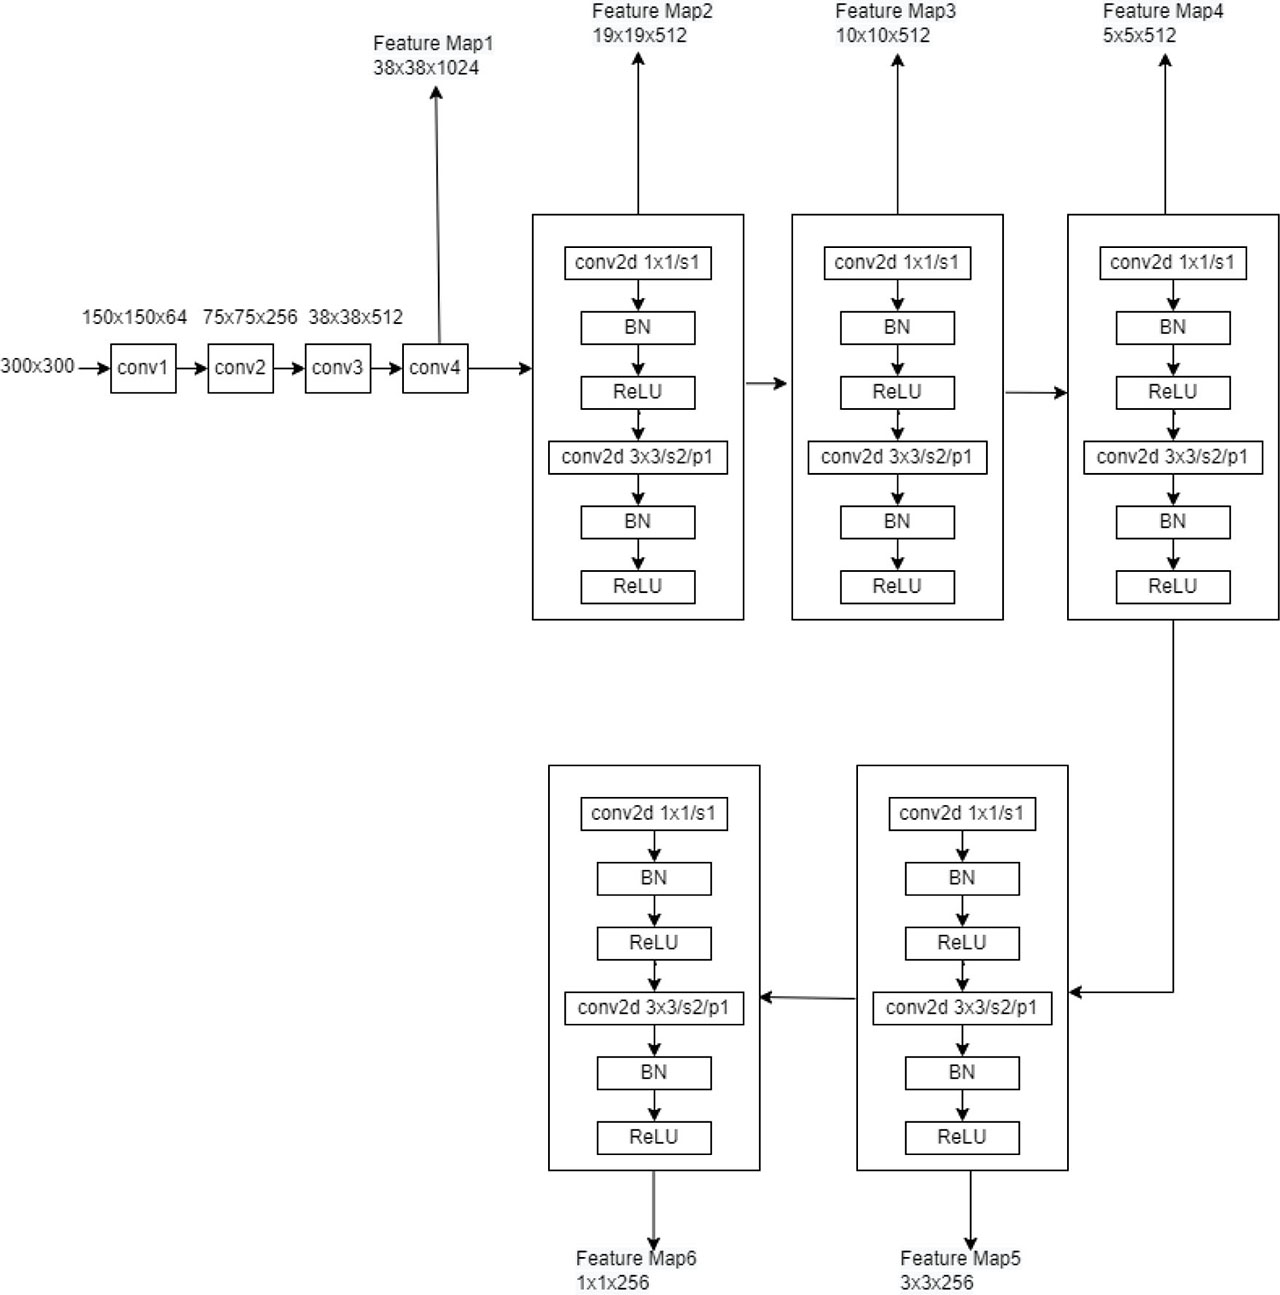
Figure 2.
Schematic diagram of the base network with improved SSD
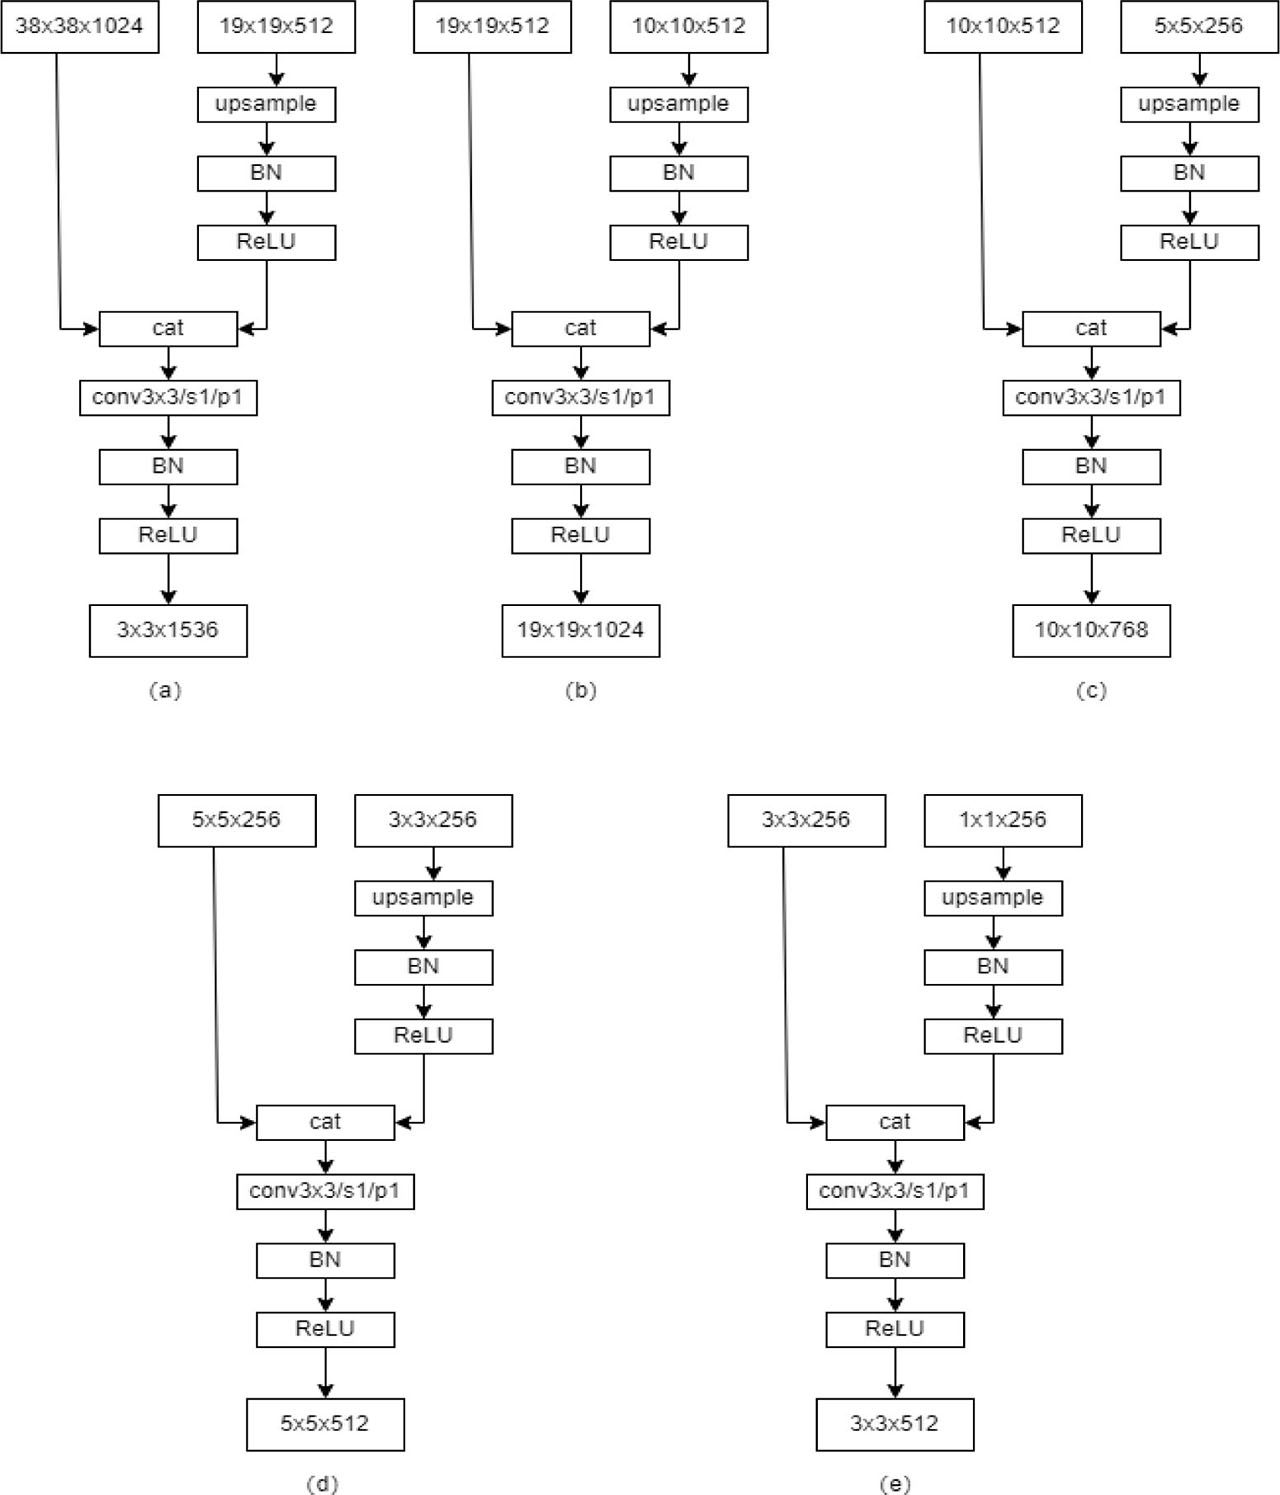
Figure 3.
Schematic diagram of the fusion of shallow features and deep features
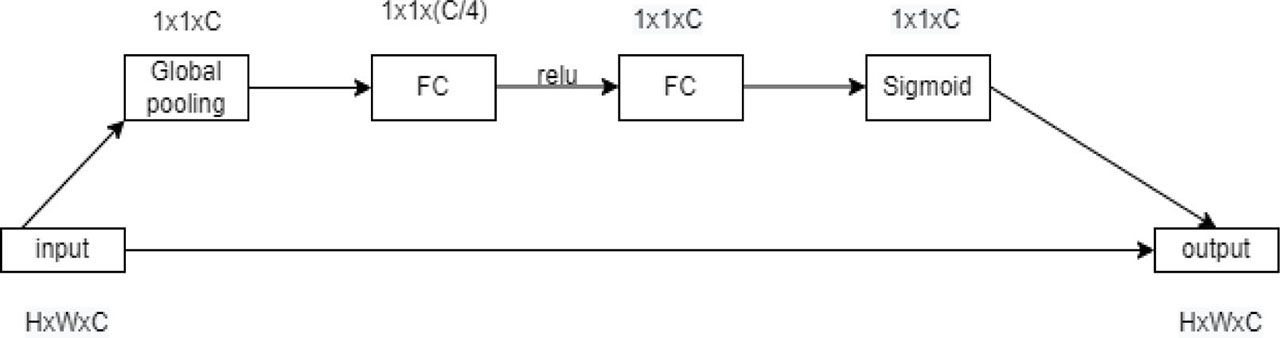
Figure 4.
Schematic diagram of SE module
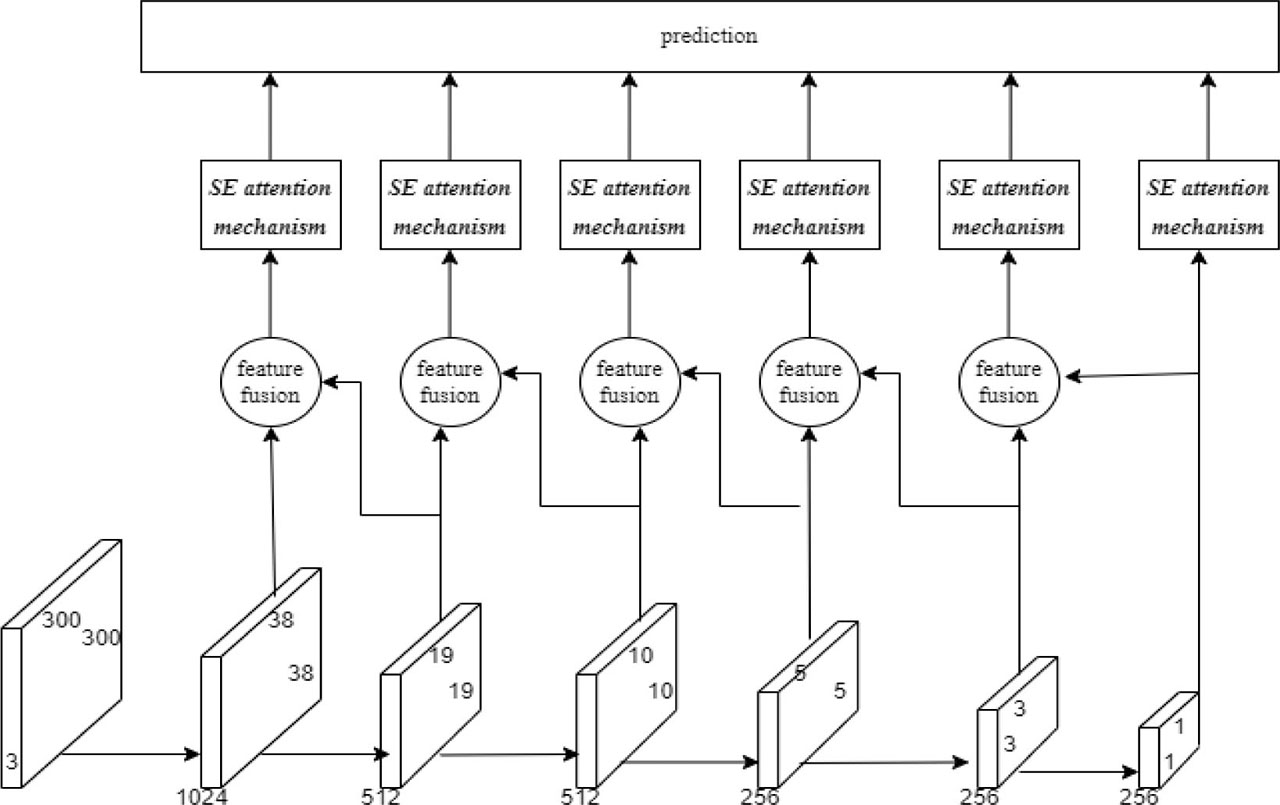
Figure 5.
Schematic diagram of the network model with improved SSD
TABLE II.
Environment configuration table
| Hardware | Processor Video Cards | Intel(R)Core(TM) i7-6500U GeForce_RTX_2080_Ti |
|---|---|---|
| Software | Operating System | windows10 |
| Deep Learning Framework | pytorch-gpu | |
| Compiler Language | python | |
| Compilers | pycharm |
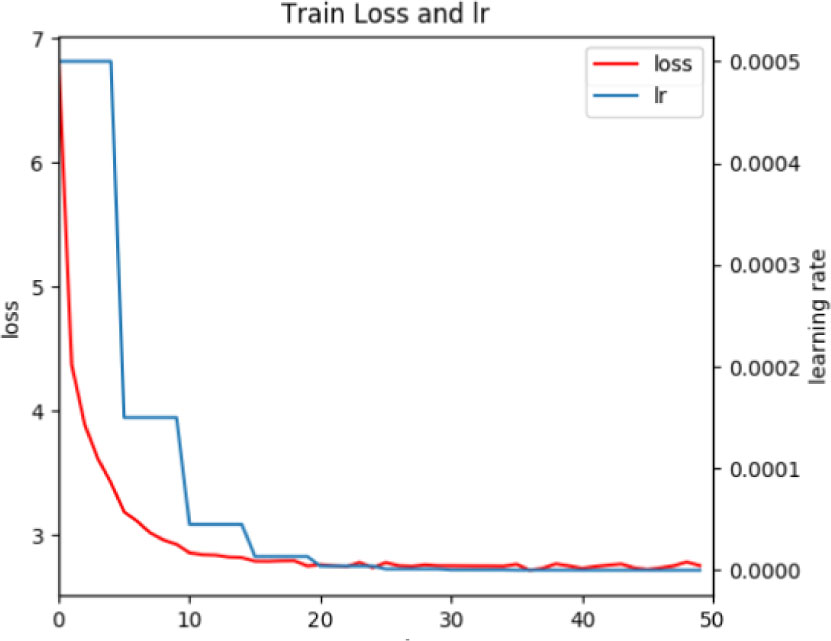
Figure 6.
Loss curve of improved SSD algorithm
TABLE III.
Training parameters setting table
| Parameter | Value |
|---|---|
| learning rate | 0.0005 |
| momentum | 0.9 |
| weight_decay | 0.0005 |
| batch size | 16 |
| epoch | 50 |
| step_size | 5 |
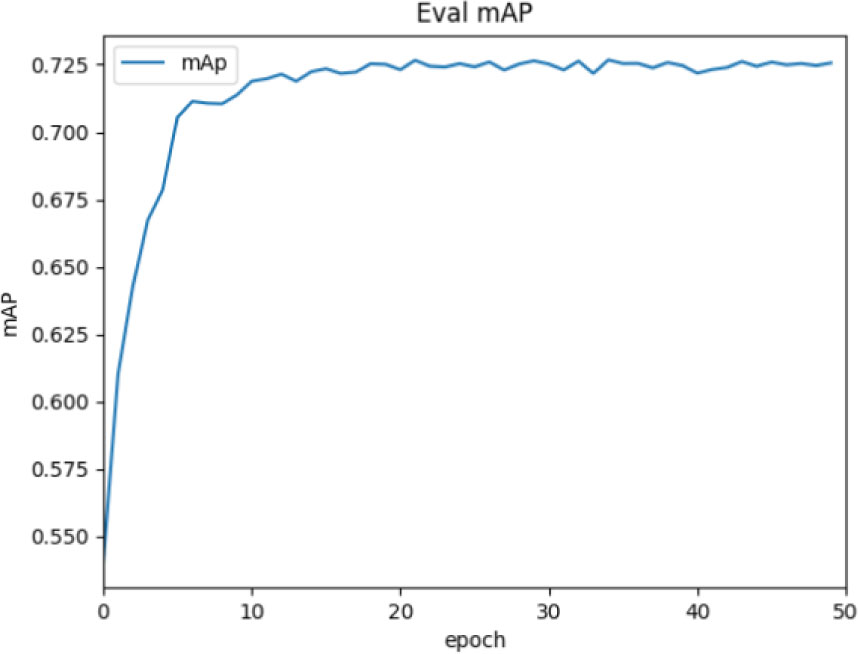
Figure 7.
mAP graph of improved SSD algorithm