
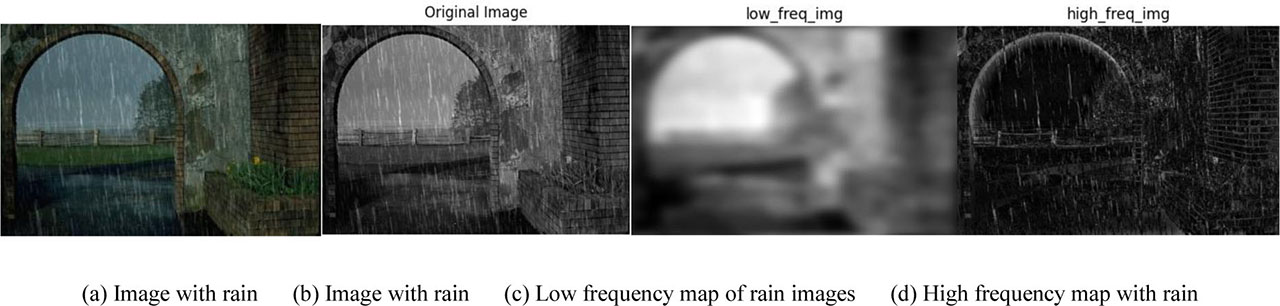
Figure 1.
Example of Frequency Decomposition
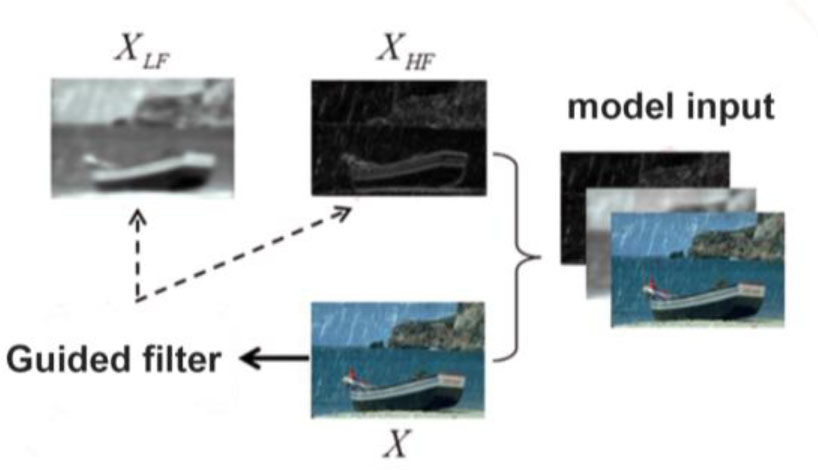
Figure 2.
Frequency Decomposition Module
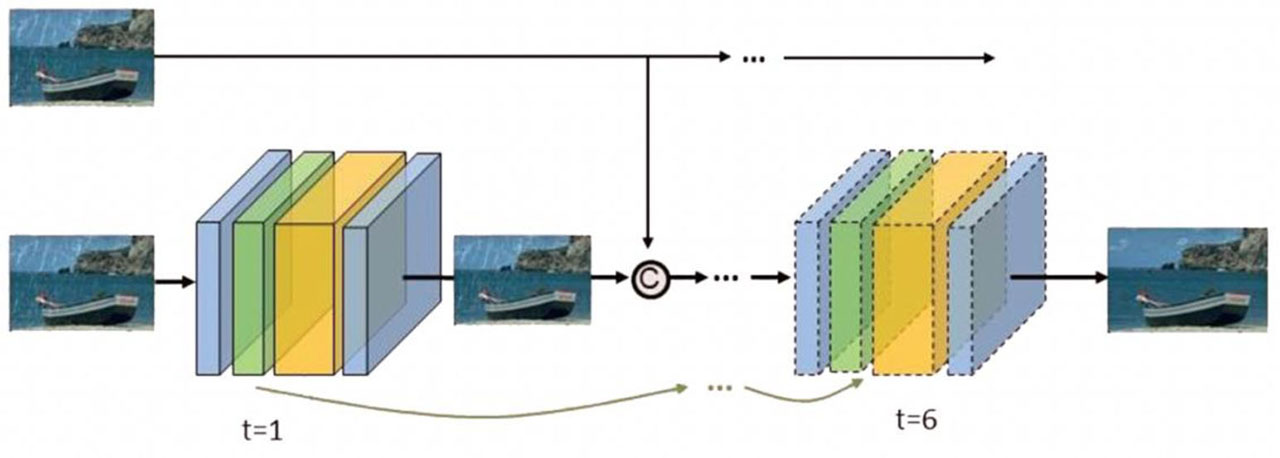
Figure 3.
The network structure of the generator
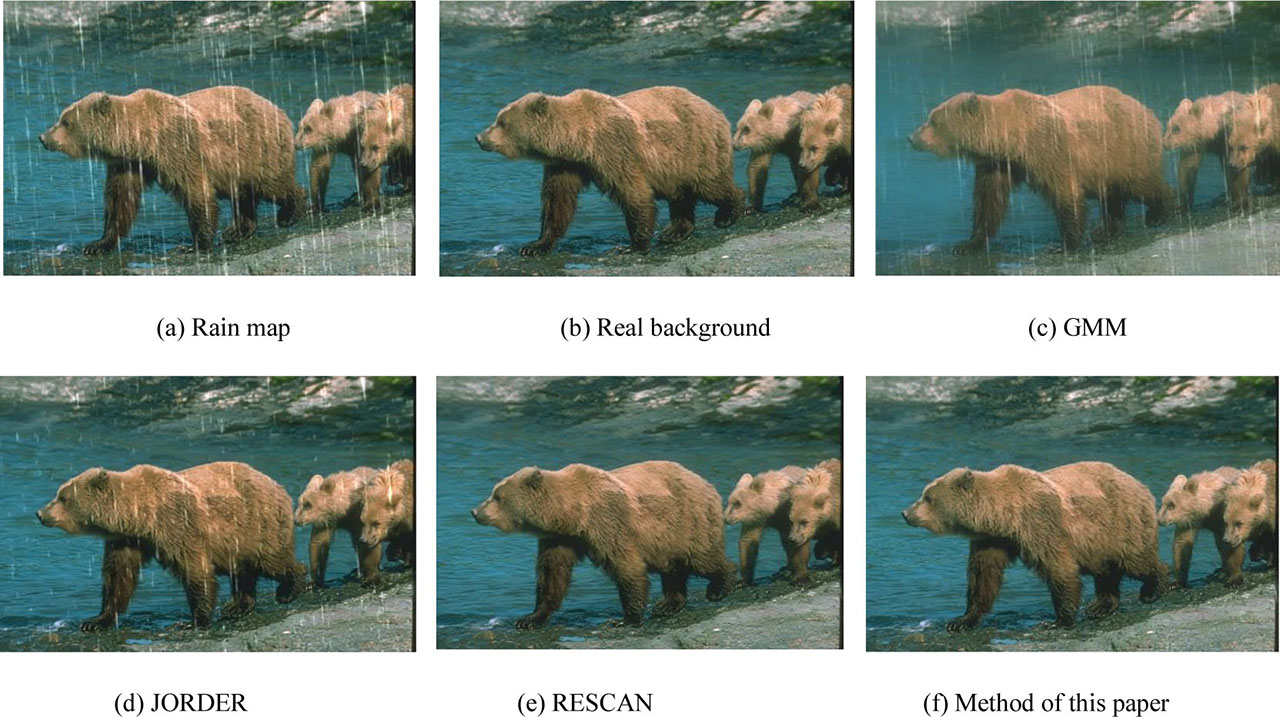
Figure 4.
Visual comparison of the rain effect on the synthetic dataset Rain100H
TABLE I.
Comparison of experimental results on synthetic datasets
| Datasets | GMM | JORDER | RESCAN | Ours |
|---|---|---|---|---|
| PSNR | 25.9725 | 26.4012 | 28.7863 | 29.1035 |
| SSIM | 0.9181 | 0.9246 | 0.9355 | 0.9661 |
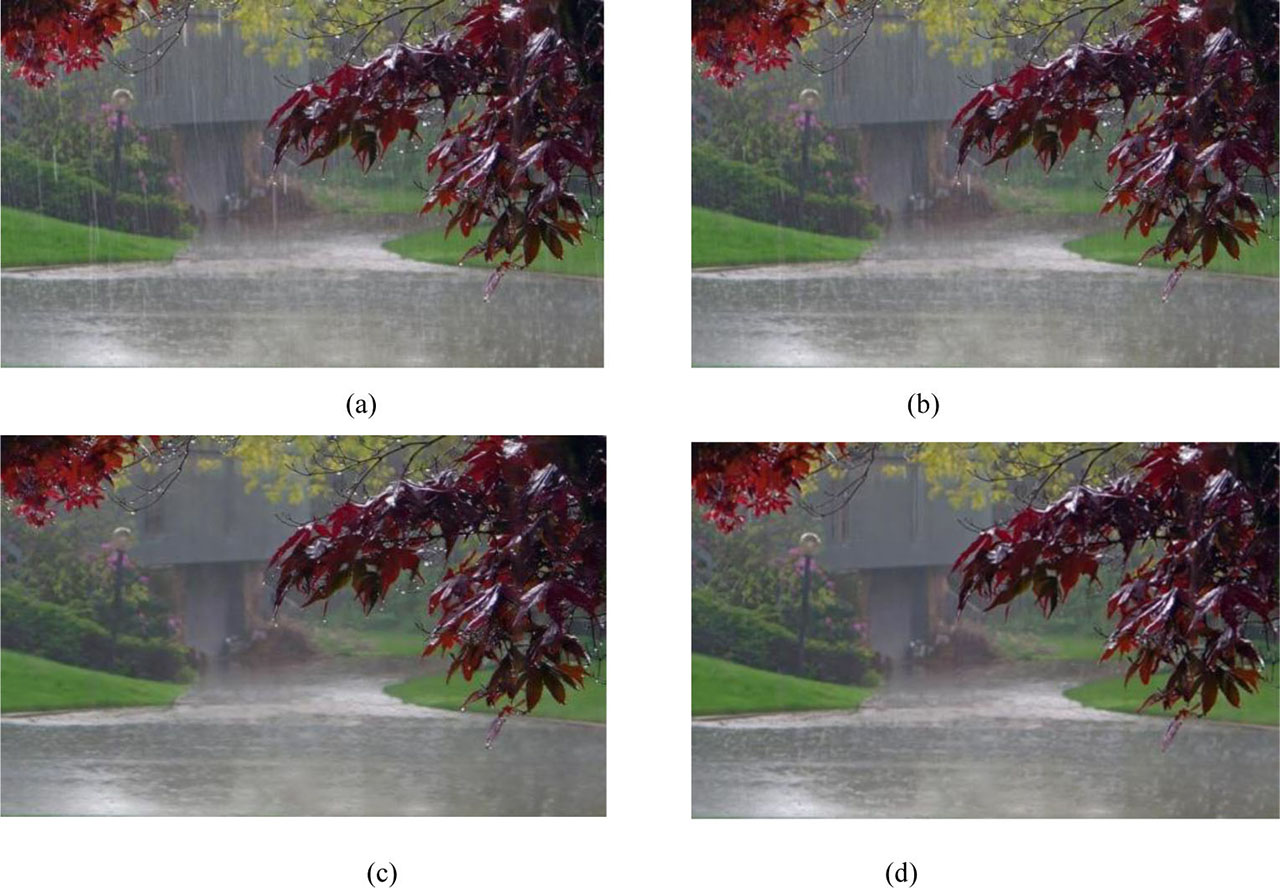
Figure 5.
(a) Real rain map (b) JORDER (c) RESCAN (d) This paper method