
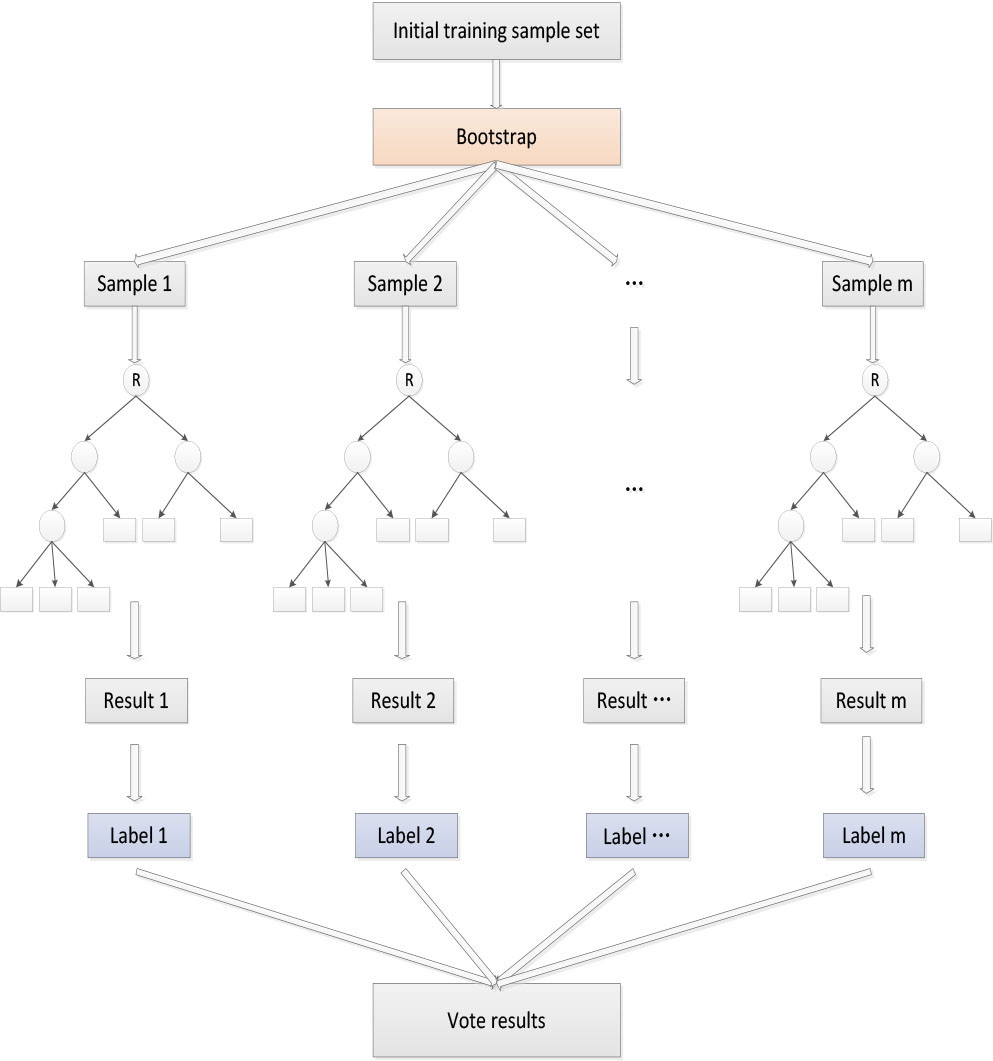
Figure 1.
Random forest model
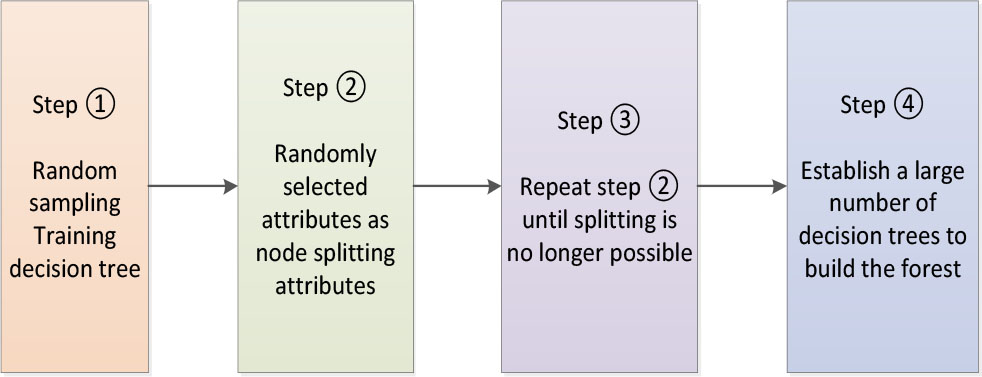
Figure 2.
Random forest model construction process
| Improved random forest algorithm based on fault ratio |
|
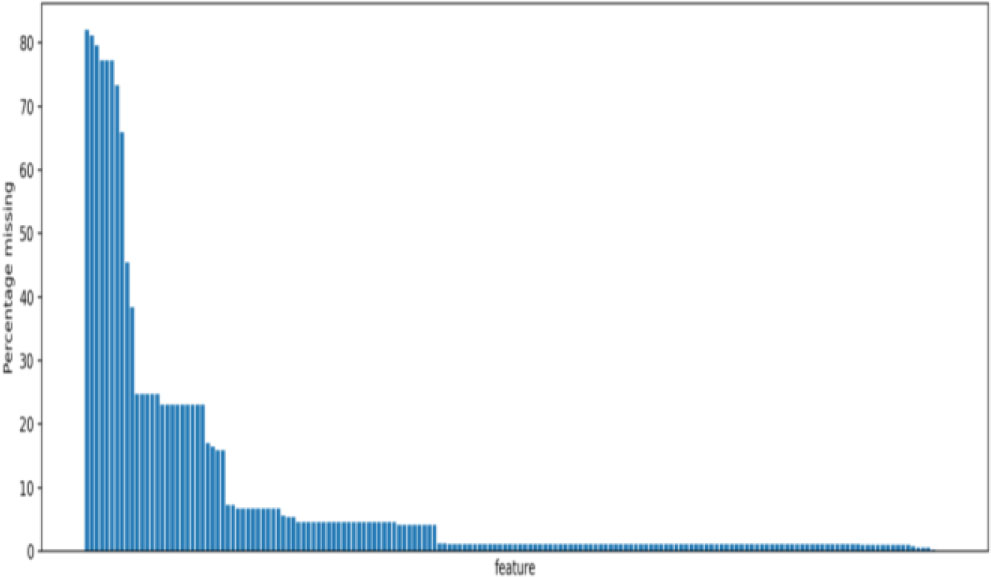
Figure 3.
Characteristic exact ratio
TABLE I.
Data variance comparison
| Attribute name | Standard deviation after median supplement | The standard deviation of the mean |
|---|---|---|
| aa_000 | 1.454301e+05 | 1.454301e+05 |
| ac_000 | 7.767625e+08 | 7.724678e+08 |
| ad_000 | 3.504525e+07 | 3.504515e+07 |
| ae_000 | 1.581479e+02 | 1.581420e+02 |
| af_000 | 2.053871e+02 | 2.053753e+02 |
| ... | ... | |
| ee_007 | 1.718666e+06 | 1.718366e+06 |
| ee_008 | 4.472145e+05 | 4.469894e+05 |
| ee_009 | 4.721249e+04 | 4.720424e+04 |
| ef_000 | 4.268570e+00 | 4.268529e+00 |
| eg_000 | 8.628043e+00 | 8.627929e+00 |
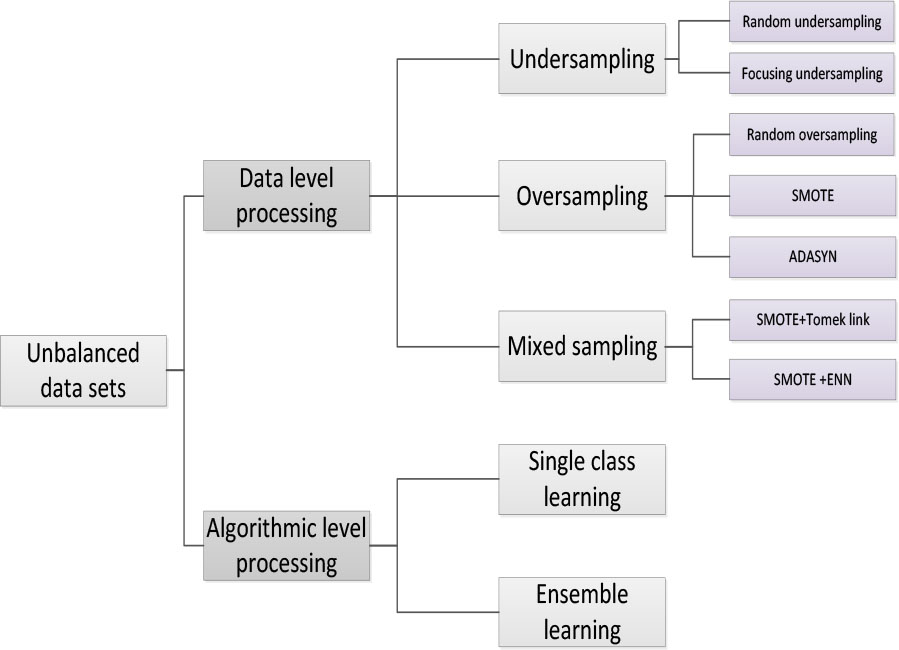
Figure 4.
Unbalanced data processing method
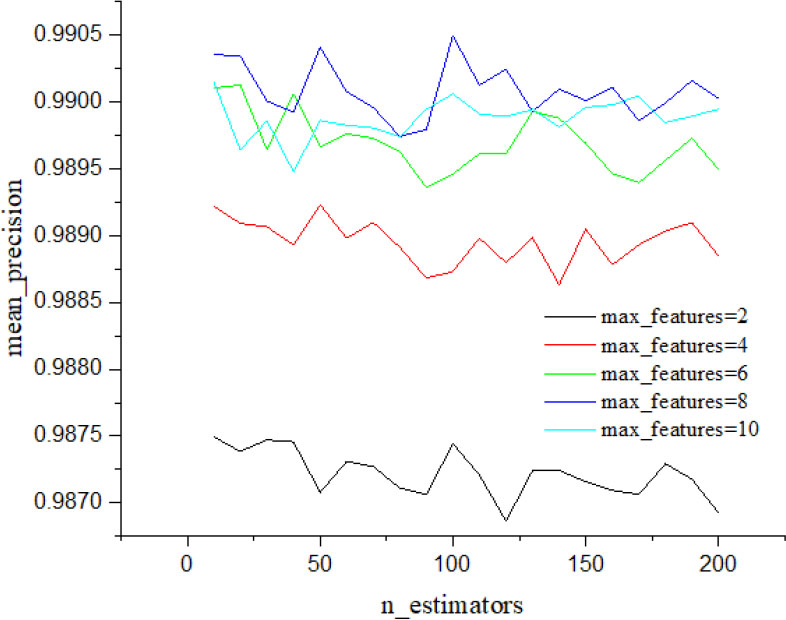
Figure 5.
Unbalanced data processing method
TABLE III.
Model metrics
| Evaluation criteria | Result |
|---|---|
| ACC | 96.94% |
| Precision | 96.27% |
| Recall | 96.27% |
| F1 score | 0.9627 |
| AUC | 0.9701 |
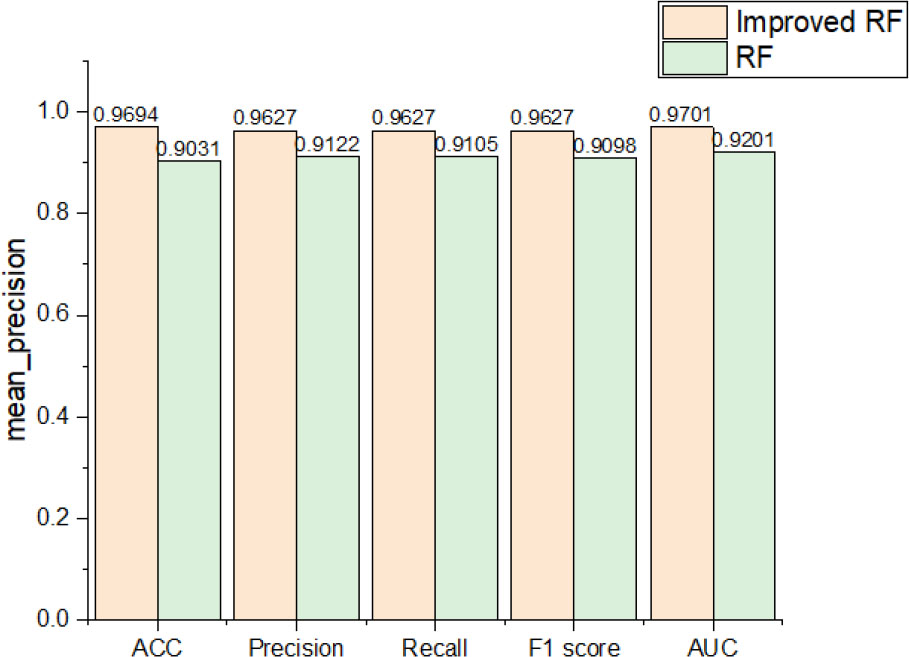
Figure 6.
Comparison of experimental results