
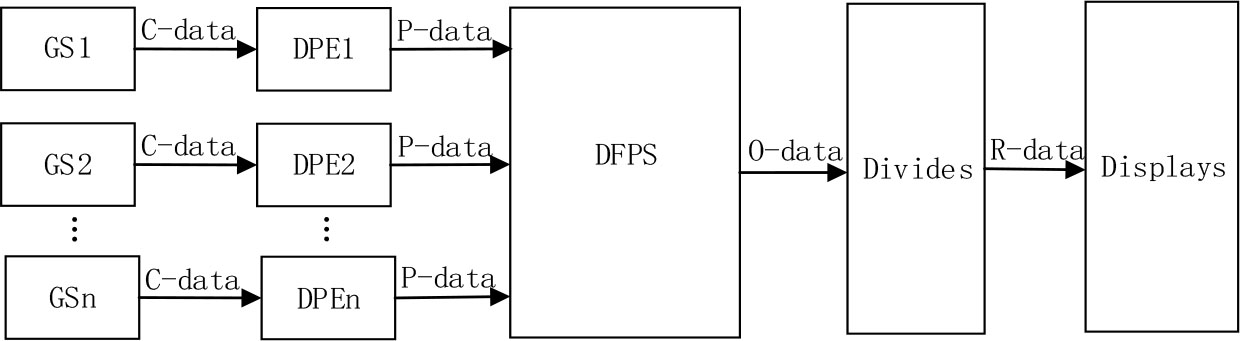
Figure 1.
Data processing flowchart
TABLE I.
Accumulative error alignment process
| Frame number | GS1 | GS2 | Fusion result | Correct |
|---|---|---|---|---|
| 1 | 28586 | 65530 | 28586 | 65530 |
| 2 | 65531 | 65467 | 65467 | 65531 |
| 3 | 65532 | 65356 | 65356 | 65532 |
| 4 | 65523 | 65533 | 65523 | 65533 |
TABLE III.
Literature correspondence alignment algorithm analysis
| Approach | Problem | Literature number |
|---|---|---|
| P-FA | The problem of matching the frame data and the frame count when the frame is lost is not solved | [13] |
| Large amount of calculation, not easy to promote | [19] | |
| P-TCMA | The number of data positions is wrong when the frame is dropped | [18] |
| Data transmission delay is not considered | [12] | |
| P-ECA | Depends on device index value | [16] |
| Frame count error has not been resolved | [10] | |
| No consideration of transmission delay | [4] | |
| Large amount of calculation, not easy to promote | [3] |
TABLE V.
Literature correspondence algorithm analysis table
| Approach | Problem | Literature number |
|---|---|---|
| PSF-QEA | Data error does not affect the frame length, causing quality misjudgment. | [18] |
| To solve the judgment error caused by dropped frames | [6] | |
| PFF-QEA | Unsolved the problem of different comparison results caused by dropped frames and errors | [20] |
| The assessment basis is relatively simple | [10] | |
| Not given due to frame loss | [3] | |
| Data preprocessing requirements are high, and the incomplete F-frame data is discarded, which is not conducive to the full use of data. | [5] | |
| PSF-QEA | The calculation is cumbersome and not easy to promote | [11] |
| Cluster center radius is not easy to choose | [6] |
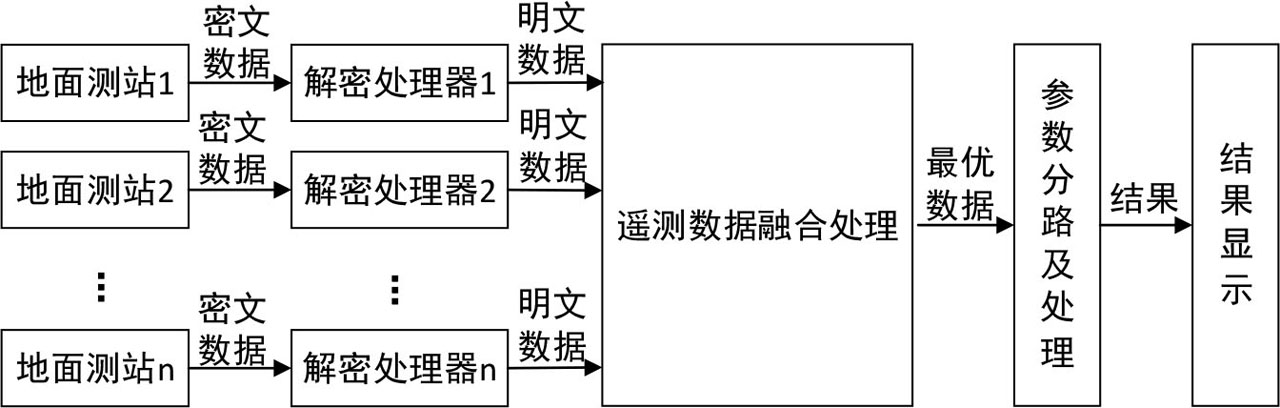
图 1
数据处理流程图
表 1
累积错误对齐过程表
| 帧序号 | 测站 A | 测站 B | 融合结果 | 正确 |
|---|---|---|---|---|
| 1 | 28586 | 65530 | 28586 | 65530 |
| 2 | 65531 | 65467 | 65467 | 65531 |
| 3 | 65532 | 65356 | 65356 | 65532 |
| 4 | 65523 | 65533 | 65523 | 65533 |