
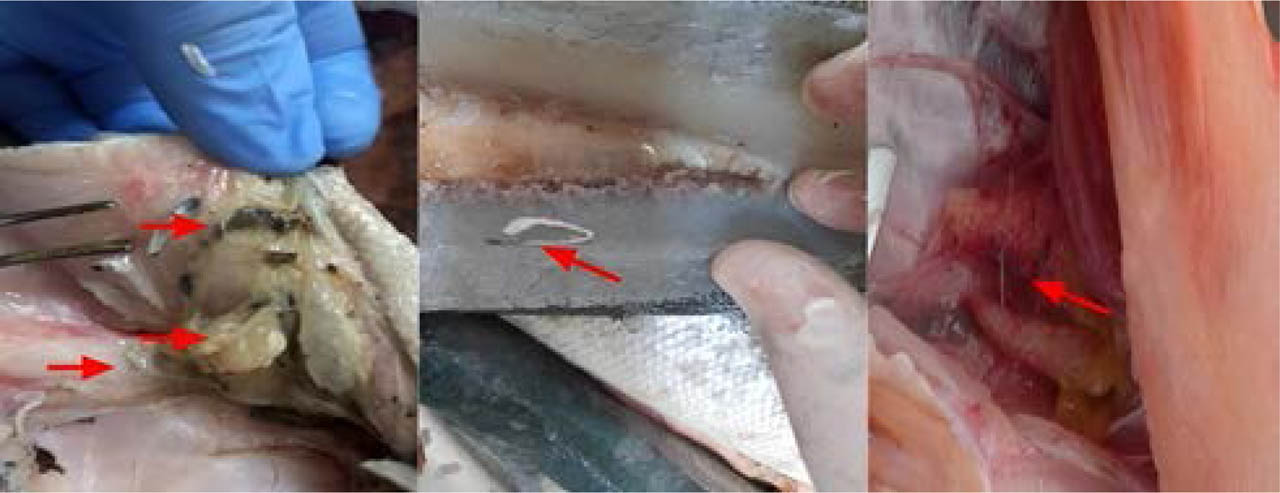
Fig. 1.
Trypanorhynch plerocerci and associated gross pathology in commercial teleosts: (A) Extensive tissue necrosis and localized focal inflammation (arrowhead) in the visceral cavity of Thunnus spp. from the Mediterranean Sea; (B) Encapsulated merocercoids (arrowhead) embedded within the somatic musculature of Solea aegyptiaca; (C) Elongated plerocerci of Callitetrarhynchus gracilis (arrowhead) free within the coelomic cavity and attached to the visceral mesenteries.
Table 1.
Molecular parameters of the 20 newly generated internal transcribed spacer (ITS) rDNA sequences from trypanorhynch larvae infesting commercial fish hosts. Putative novel species isolates (PV917196–PV917198) are positioned at the top of the matrix. Host common names are provided in parentheses.
| GenBank Accession | Top BLAST Hit (best-matching reference) | % Identity | Query Cover | E-value | Host species (with authority) | Common name | Origin (Sea) | Identification |
|---|---|---|---|---|---|---|---|---|
| *PV917196 | — (no significant match; see text) | 81.52 | 67 % | 1e-89 | Solea aegyptiaca Chabanaud, 1927 | Egyptian sole (Mousa) | Mediterranean Sea | Putative new species |
| *PV917197 | — (no significant match; see text) | 81.54 | 66 % | 4e-89 | Solea aegyptiaca Chabanaud, 1927 | Egyptian sole (Mousa) | Mediterranean Sea | Putative new species |
| *PV917198 | — (no significant match; see text) | 81.42 | 65 % | 2e-87 | Solea aegyptiaca Chabanaud, 1927 | Egyptian sole (Mousa) | Mediterranean Sea | Putative new species |
| PV918672 | Callitetrarhynchus gracilis (Rudolphi, 1819) | 100.00 | 100 % | 0.0 | Plectropomus areolatus (Rüppell, 1830) | Squaretail coral grouper (Najel) | Red Sea | Confirmed at species level |
| PV918673 | Callitetrarhynchus gracilis (Rudolphi, 1819) | 99.28 | 98 % | 0.0 | Plectropomus areolatus (Rüppell, 1830) | Squaretail coral grouper (Najel) | Red Sea | Confirmed at species level |
| PV918674 | Callitetrarhynchus gracilis (Rudolphi, 1819) | 100.00 | 98 % | 0.0 | Epinephelus tauvina (Forsskål, 1775) | Greasy grouper (Hammor) | Red Sea | Confirmed at species level |
| PV920009 | Callitetrarhynchus gracilis (Rudolphi, 1819) | 96.99 | 92 % | 0.0 | Thunnus spp. South, 1845 | Tuna | Mediterranean Sea | Genus-level match |
| PV920010 | Callitetrarhynchus gracilis (Rudolphi, 1819) | 97.20 | 94 % | 0.0 | Thunnus spp. South, 1845 | Tuna | Mediterranean Sea | Genus-level match |
| PV920011 | Callitetrarhynchus gracilis (Rudolphi, 1819) | 97.49 | 46 % | 1e-149 | Plectropomus areolatus (Rüppell, 1830) | Squaretail coral grouper (Najel) | Red Sea | Genus-level match |
| PV920012 | Callitetrarhynchus gracilis (Rudolphi, 1819) | 99.06 | 93 % | 0.0 | Plectropomus areolatus (Rüppell, 1830) | Squaretail coral grouper (Najel) | Red Sea | Confirmed at species level |
| PV920013 | Callitetrarhynchus gracilis (Rudolphi, 1819) | 97.83 | 94 % | 0.0 | Xiphias gladius Linnaeus, 1758 | Swordfish (Abusaif) | Mediterranean Sea | Confirmed at species level |
| PV920014 | Callitetrarhynchus gracilis (Rudolphi, 1819) | 97.67 | 94 % | 0.0 | Xiphias gladius Linnaeus, 1758 | Swordfish (Abusaif) | Mediterranean Sea | Confirmed at species level |
| PV920015 | Callitetrarhynchus gracilis (Rudolphi, 1819) | 99.06 | 93 % | 0.0 | Xiphias gladius Linnaeus, 1758 | Swordfish (Abusaif) | Mediterranean Sea | Confirmed at species level |
| PV920016 | Callitetrarhynchus gracilis (Rudolphi, 1819) | 99.07 | 94 % | 0.0 | Xiphias gladius Linnaeus, 1758 | Swordfish (Abusaif) | Mediterranean Sea | Confirmed at species level |
| PV920017 | Callitetrarhynchus gracilis (Rudolphi, 1819) | 97.96 | 93 % | 0.0 | Xiphias gladius Linnaeus, 1758 | Swordfish (Abusaif) | Mediterranean Sea | Confirmed at species level |
| PV920018 | Callitetrarhynchus gracilis (Rudolphi, 1819) | 99.06 | 93 % | 0.0 | Xiphias gladius Linnaeus, 1758 | Swordfish (Abusaif) | Mediterranean Sea | Confirmed at species level |
| PV920019 | Callitetrarhynchus gracilis (Rudolphi, 1819) | 100.00 | 100 % | 0.0 | Xiphias gladius Linnaeus, 1758 | Swordfish (Abusaif) | Mediterranean Sea | Confirmed at species level |
| PV920020 | Callitetrarhynchus gracilis (Rudolphi, 1819) | 96.31 | 90 % | 0.0 | Epinephelus tauvina (Forsskål, 1775) | Greasy grouper (Hammor) | Mediterranean Sea | Genus-level match |
| PV920021 | Callitetrarhynchus gracilis (Rudolphi, 1819) | 97.99 | 94 % | 0.0 | Epinephelus tauvina (Forsskål, 1775) | Greasy grouper (Hammor) | Red Sea | Confirmed at species level |
| PV920022 | Callitetrarhynchus gracilis (Rudolphi, 1819) | 97.99 | 94 % | 0.0 | Epinephelus tauvina (Forsskål, 1775) | Greasy grouper (Hammor) | Red Sea | Confirmed at species level |
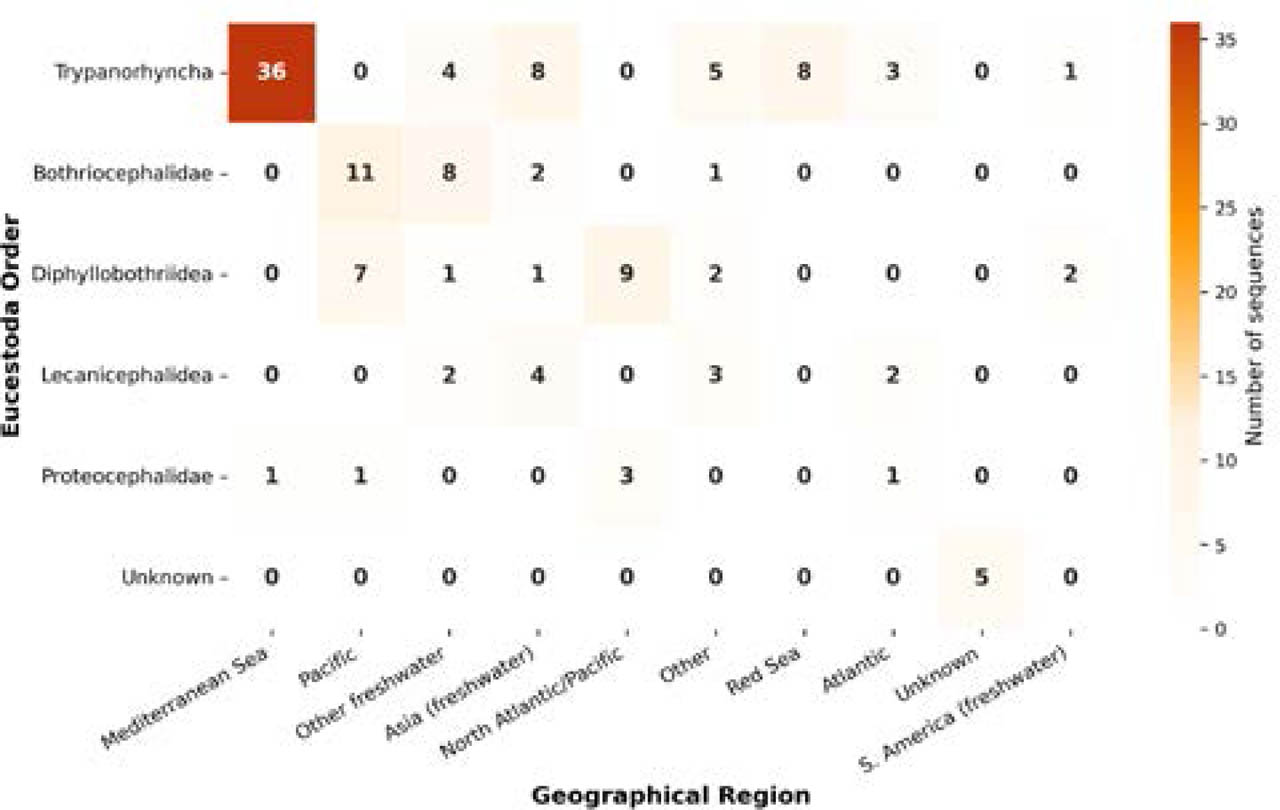
Fig. 2.
Taxonomic distribution of the 128 analyzed ITS sequences across Eucestoda orders (rows) and biogeographical regions (columns). Cell values indicate the number of sequences in each order × region combination. Color intensity scales with sequence count. Trypanorhyncha from the Mediterranean Sea are the best-represented group (n = 36), reflecting sampling focus of the current study.
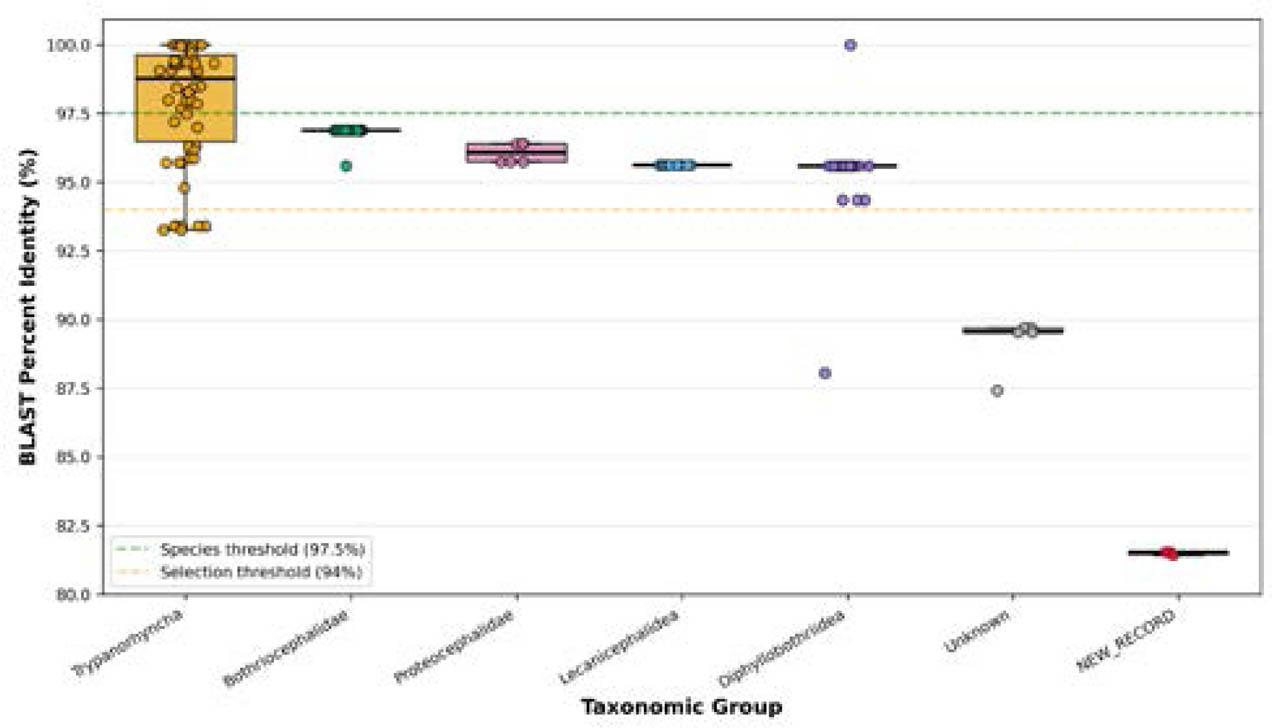
Fig. 3.
Distribution profiles of top BLASTN percent identities against the NCBI nucleotide (nt) database for each operational and reference sequence, stratified by taxonomic category. Boxplots define the interquartile range (IQR), whiskers extend to (1.5X IQR), and individual data points overlay the distribution. Horizontal dashed reference lines denote the conventional species-delineation threshold for helminth ITS barcoding (97.5%) alongside the minimum sequence-selection baseline threshold (94%). The discrete clustering of the three novel isolates (labeled as NEW_RECORD; PV917196–PV917198) beneath the species boundary at similarity of (81.5%) supports their designation as a putative novel species.
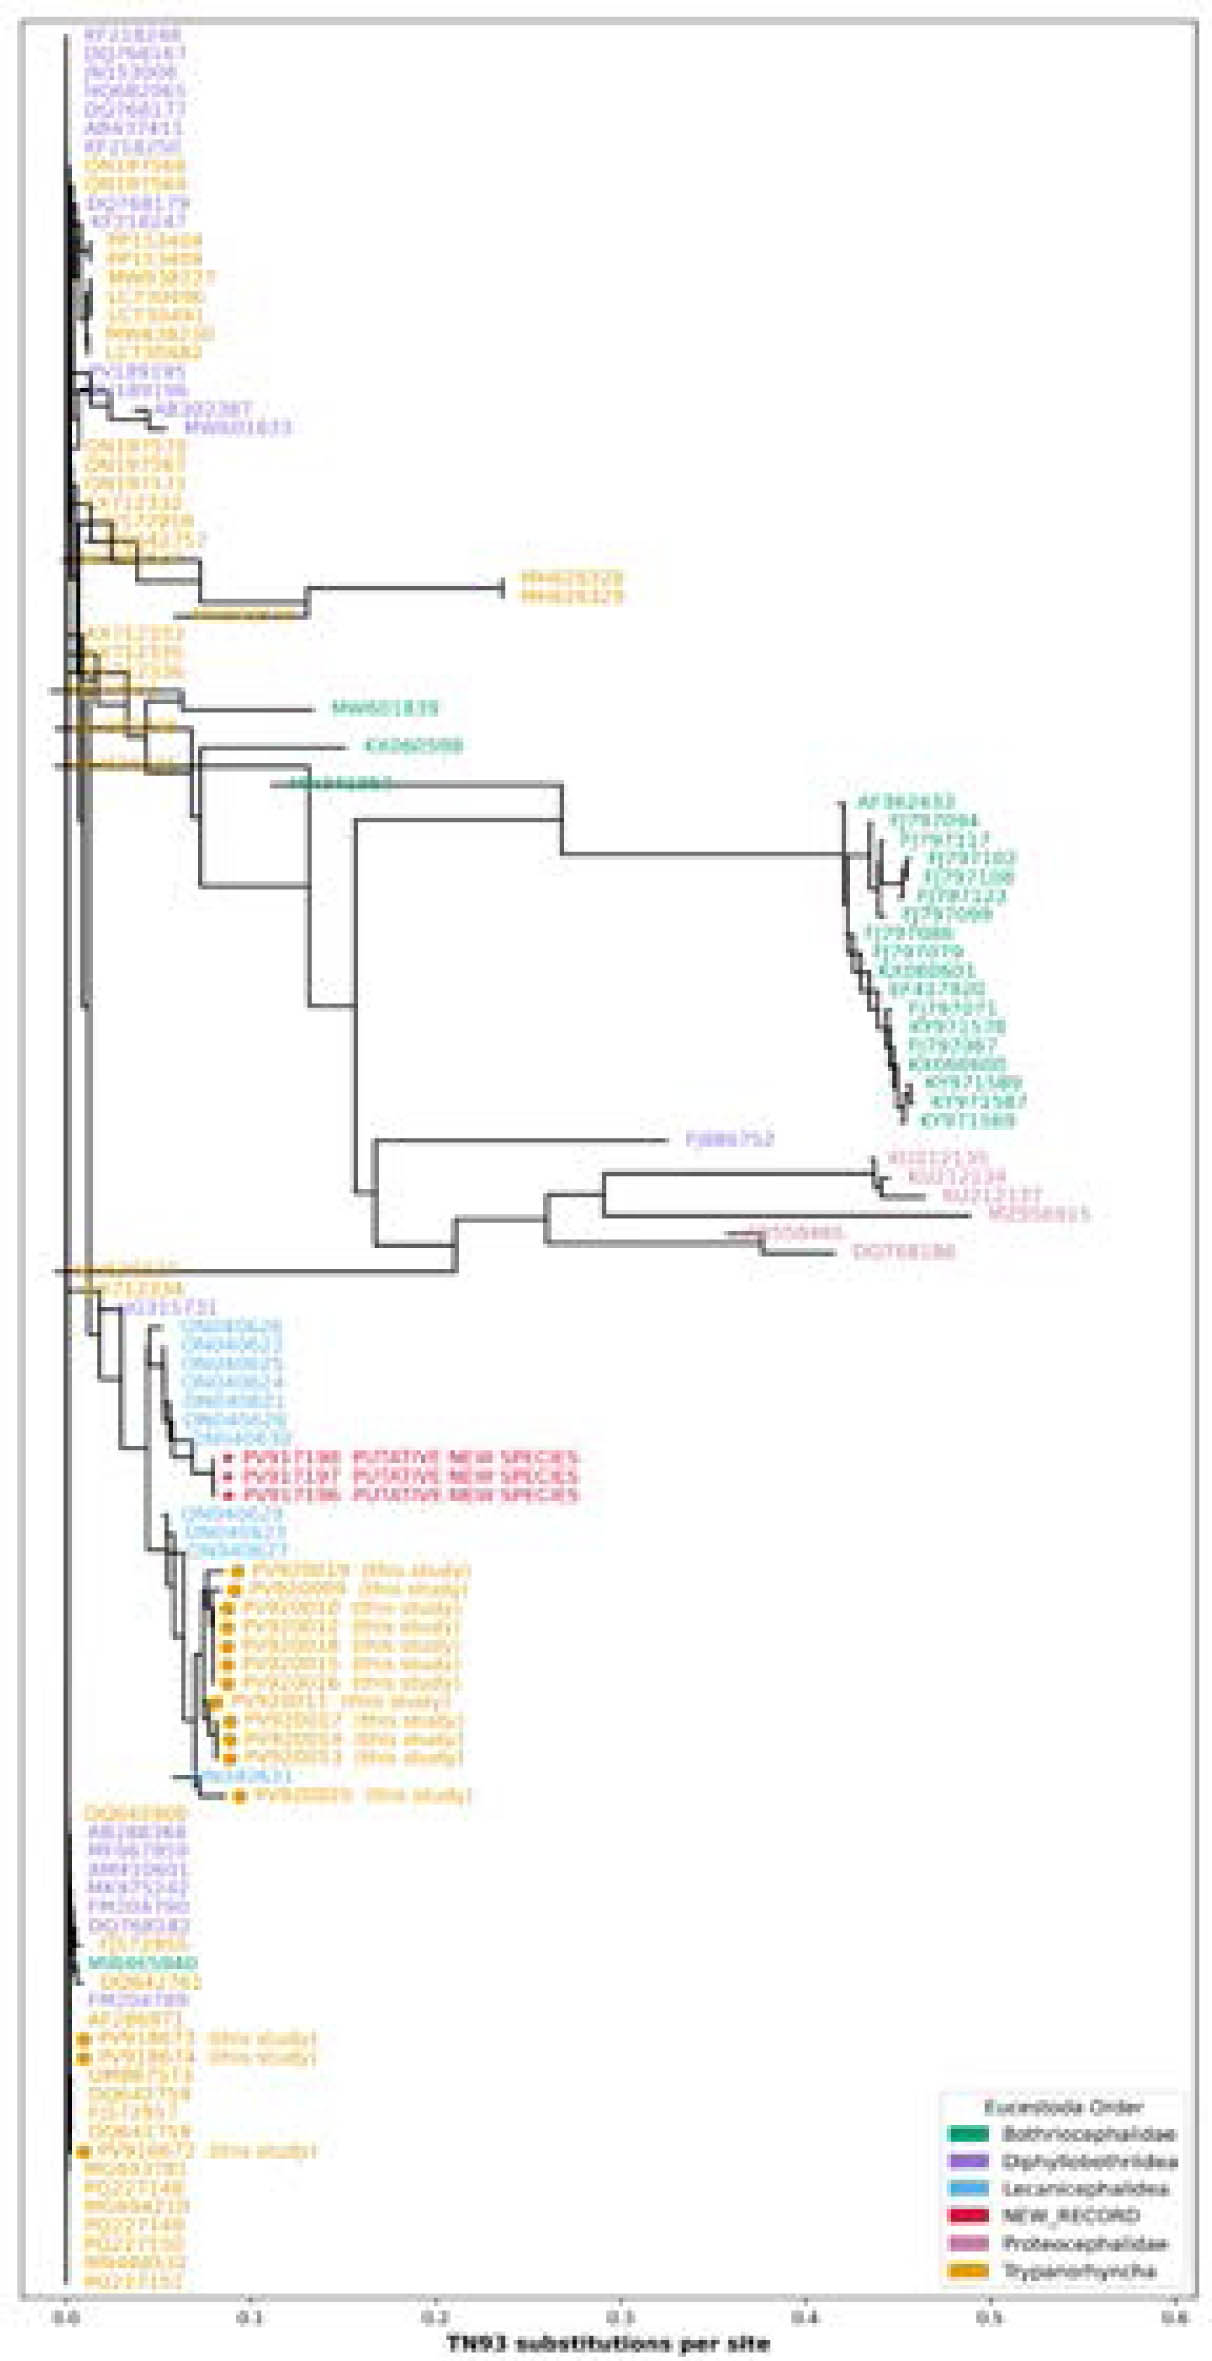
Fig. 4.
Neighbor-Joining phylogenetic tree of 121 eucestode ITS sequences. The topology was inferred from Tamura-Nei (TN93) distances utilizing a core 728 bp matrix derived from an initial 12,999 bp MAFFT alignment. Tip labels are color-coded by eucestode order according to the legend. Isolates sequenced in this study are designated with an orange circle (•), and the putative novel species isolates (PV917196–PV917198) are highlighted with a red star (★), forming a distinct monophyletic lineage. Scale bar indicates nucleotide substitutions per site. Bootstrap support values based on 100 pseudoreplicates are accessible in Supplementary Material S2.
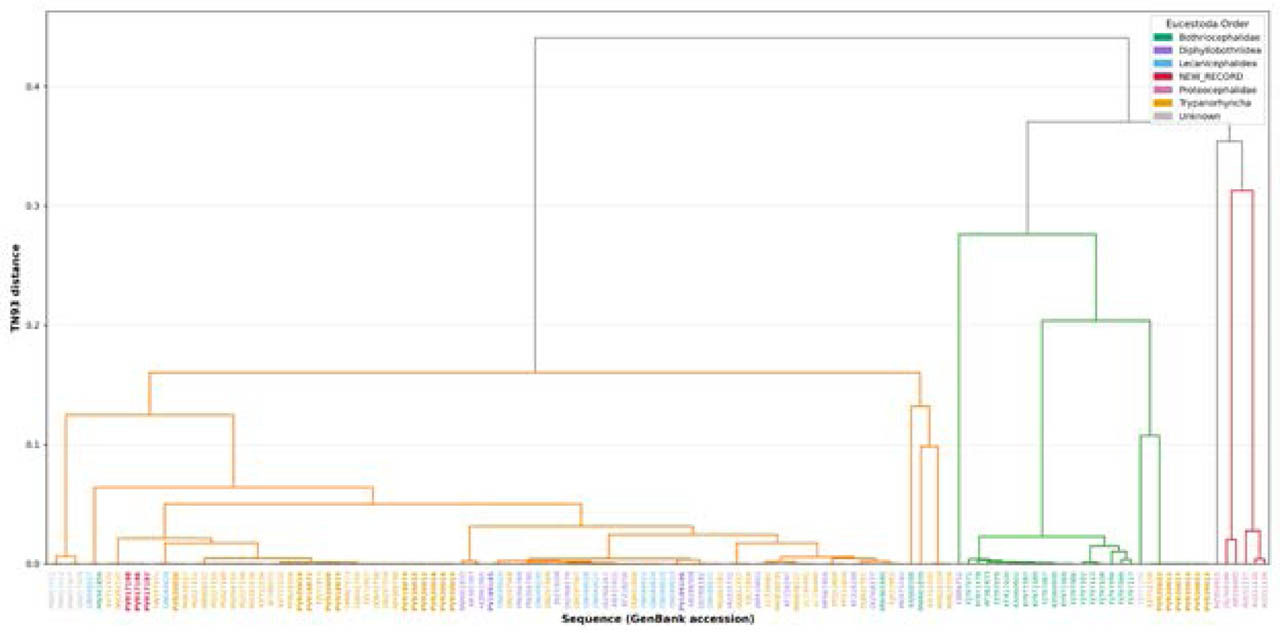
Fig. 5.
Hierarchical clustering dendrogram of eucestode ITS sequences. The profile was calculated via Ward's linkage criteria based on pairwise Tamura-Nei (TN93) distances. Major cluster partitions (demarcated by orange, green, and red terminal branches) are isolated to evaluate structural boundaries against classical order-level classification systems. Tip labels are color-coded by operational taxonomic category, and isolates generated in this study are highlighted in bold typeface. Outgroup reference templates Gyrocotyle urna (Gyrocotylidea excluded from true Eucestoda; accessions MN657012.1, MN657013.1, MN657007.1, MN657009.1) and Brachycladium atlanticum (Trematoda included; accession FJ211250) are retained within the matrix to anchor the basal topology of the true Eucestoda lineages.
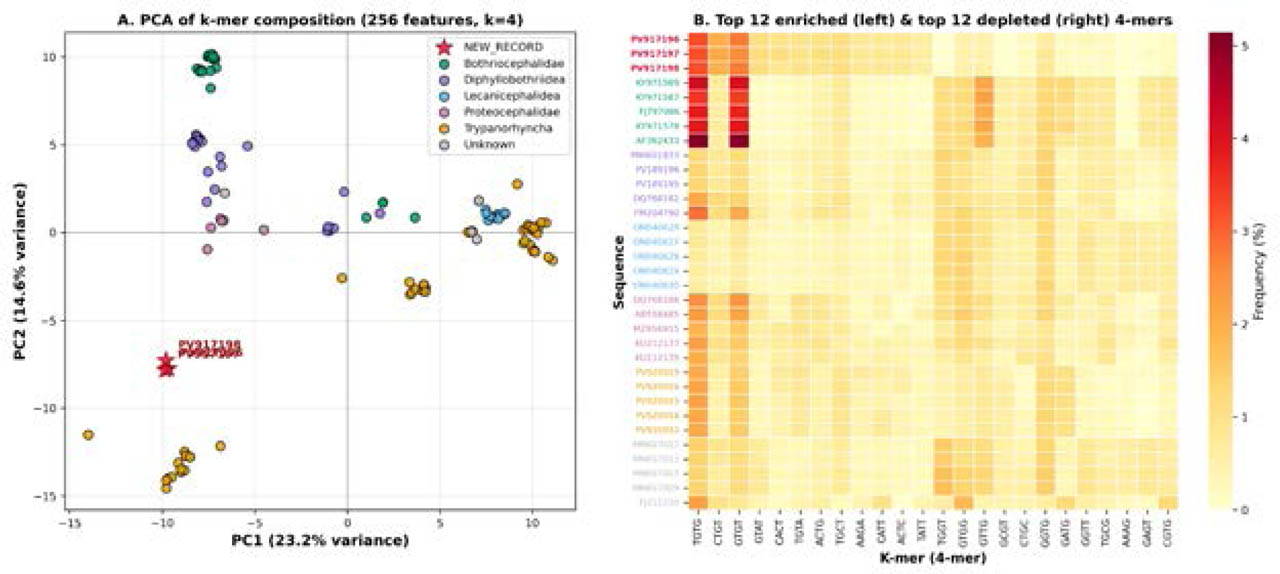
Fig. 6.
Taxon validation and spatial positioning of the putative novel species isolates PV917196–PV917198 using alignment-free 4-mer frequency vectors (256 parameters): (A) Two-dimensional PCA mapping, where axes PC1 (23.2 %) and PC2 (14.6 %) combine to describe (37.8 %) of total structural variance. The novel isolates (designated by red stars) resolve into an isolated spatial sector free from overlapping reference clusters; (B) High-density heatmap illustrating the relative behaviour of the top 12 highly enriched and top 12 highly depleted 4-mer markers within the novel isolates relative to reference eucestode orders.
Table 2.
Classification performance metrics of three machine-learning algorithms evaluated on alignment-free 4-mer frequency matrices across binary and multiclass taxonomic scales using 10-fold stratified cross-validation.
| Task | Classifier | n positive | n negative | CV folds | Accuracy | Precision | Recall | F1-score | AUC-ROC | Notes |
|---|---|---|---|---|---|---|---|---|---|---|
| Binary (PNS vs. all others) | Random Forest | 3 | 125 | 10 | 1.000 | 1.000 | 1.000 | 1.000 | 1.000 | a |
| Binary (PNS vs. all others) | XGBoost | 3 | 125 | 10 | 1.000 | 1.000 | 1.000 | 1.000 | 1.000 | a |
| Binary (PNS vs. all others) | Logistic Regression (L2) | 3 | 125 | 10 | 1.000 | 1.000 | 1.000 | 1.000 | 1.000 | a |
| Multiclass (7 orders) | Random Forest | 128 | — | 10 | 0.829 ± 0.093 | 0.83 (macro) | 0.83 (macro) | 0.78 (macro) | — | b |
Table 3.
Top 15 discriminative 4-mer features driving binary classification of the putative novel species isolates (PV917196–PV917198) relative to reference Eucestoda sequences, ranked by mean absolute SHAP (Shapley Additive exPlanations) values.
| Rank | 4-mer | Direction | Mean freq. in PNS (%) | Mean freq. in others (%) | Fold change | SHAP importance | Interpretation |
|---|---|---|---|---|---|---|---|
| 1 | TGTG | ↑ | 3.23 | 1.72 | 1.87× | High | Enriched |
| 2 | CTGT | ↑ | 1.99 | 0.73 | 2.72× | High | Enriched |
| 3 | GTGT | ↑ | 2.69 | 1.49 | 1.80× | High | Enriched |
| 4 | TGGT | ↓ | 0 | 1.05 | absent | High | Absent in PNS |
| 5 | GTAT | ↑ | 1.13 | 0.36 | 3.10× | High | Enriched |
| 6 | CACT | ↑ | 0.97 | 0.33 | 2.97× | Mod | Enriched |
| 7 | GTGG | ↓ | 0.48 | 1.11 | 0.44× | Mod | Depleted |
| 8 | GTTG | ↓ | 0.48 | 1.07 | 0.45× | Mod | Depleted |
| 9 | TGTA | ↑ | 0.97 | 0.43 | 2.25× | Mod | Enriched |
| 10 | ACTG | ↑ | 1.02 | 0.49 | 2.10× | Mod | Enriched |
| 11 | GCGT | ↓ | 0 | 0.52 | absent | Mod | Absent in PNS |
| 12 | TGCT | ↑ | 1.13 | 0.63 | 1.80× | Mod | Enriched |
| 13 | CTGC | ↓ | 0.16 | 0.64 | 0.25× | Mod | Depleted |
| 14 | AAGA | ↑ | 0.81 | 0.33 | 2.44× | Mod | Enriched |
| 15 | CATT | ↑ | 0.81 | 0.33 | 2.42× | Mod | Enriched |
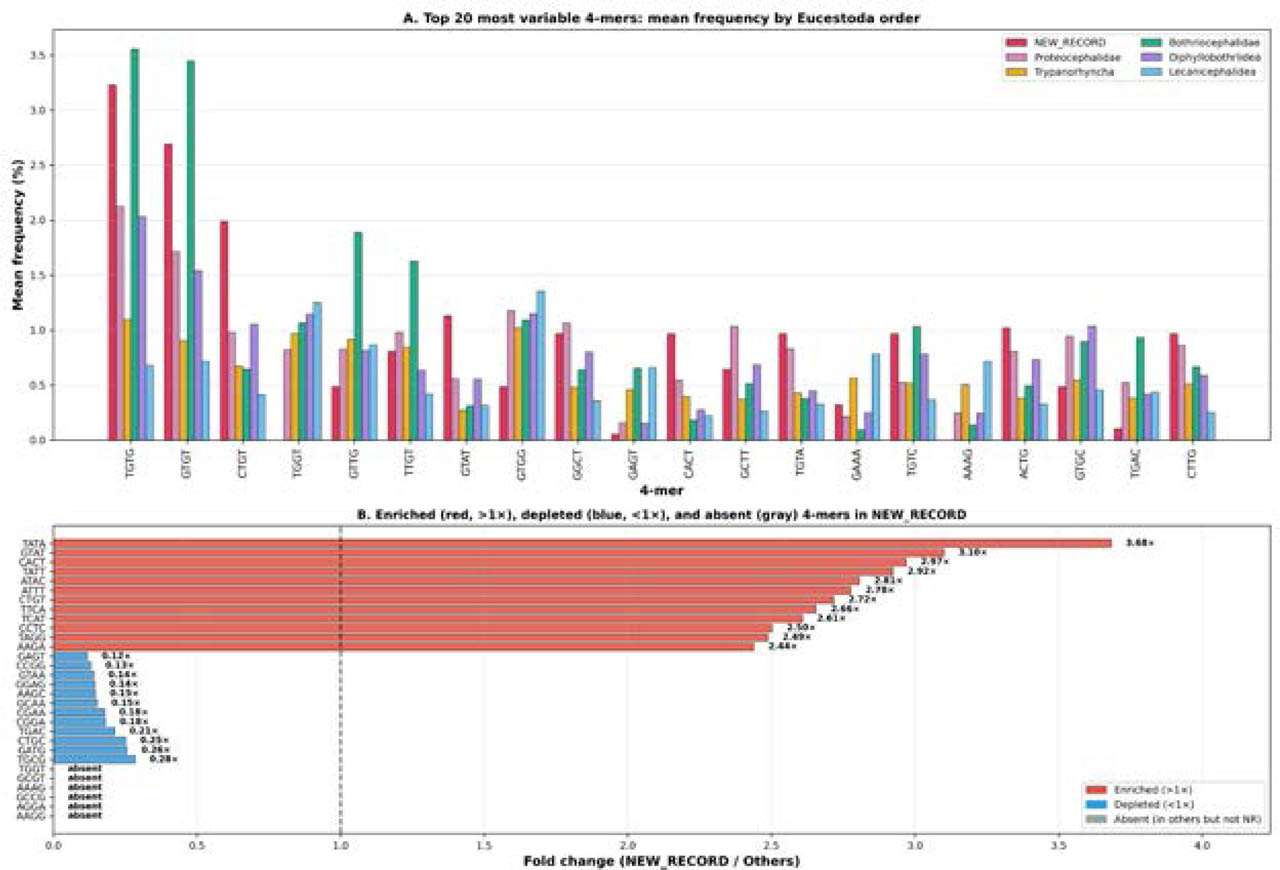
Fig. 7.
Fine-scale oligonucleotide composition profiles of the putative novel species isolates PV917196–PV917198: (A) Distribution of the 20 highly variable 4-mer frequencies ( %) across valid eucestode orders, illustrating the specific clustering and elevation of TGTG, GTGT, and CTGT motifs within the novel isolates; (B) Fold-change distributions highlighting highly enriched motifs (red, (>1X), depleted motifs blue, (<1X), and absolute deletion events (grey) relative to global references. The horizontal reference line at (1X) signifies compositional parity.