
Table 1.
Primer details and cycling conditions.
| Gene | Primer name | Sequence | No of base pairs (bp) | Product size (bp) | Cycling conditions | References |
|---|---|---|---|---|---|---|
| ITS2 | Forward primer GA1 | 5′-AGA ACA TCG ACA TCT TGA AC-3′ | 20 | ~400 bp | Anderson and Barker, 1998; Luton et al., 1992 | |
| Reverse primer BD2 | 5′-TAT GCT TAA ATT CAG CGG GT-3′ | 20 |
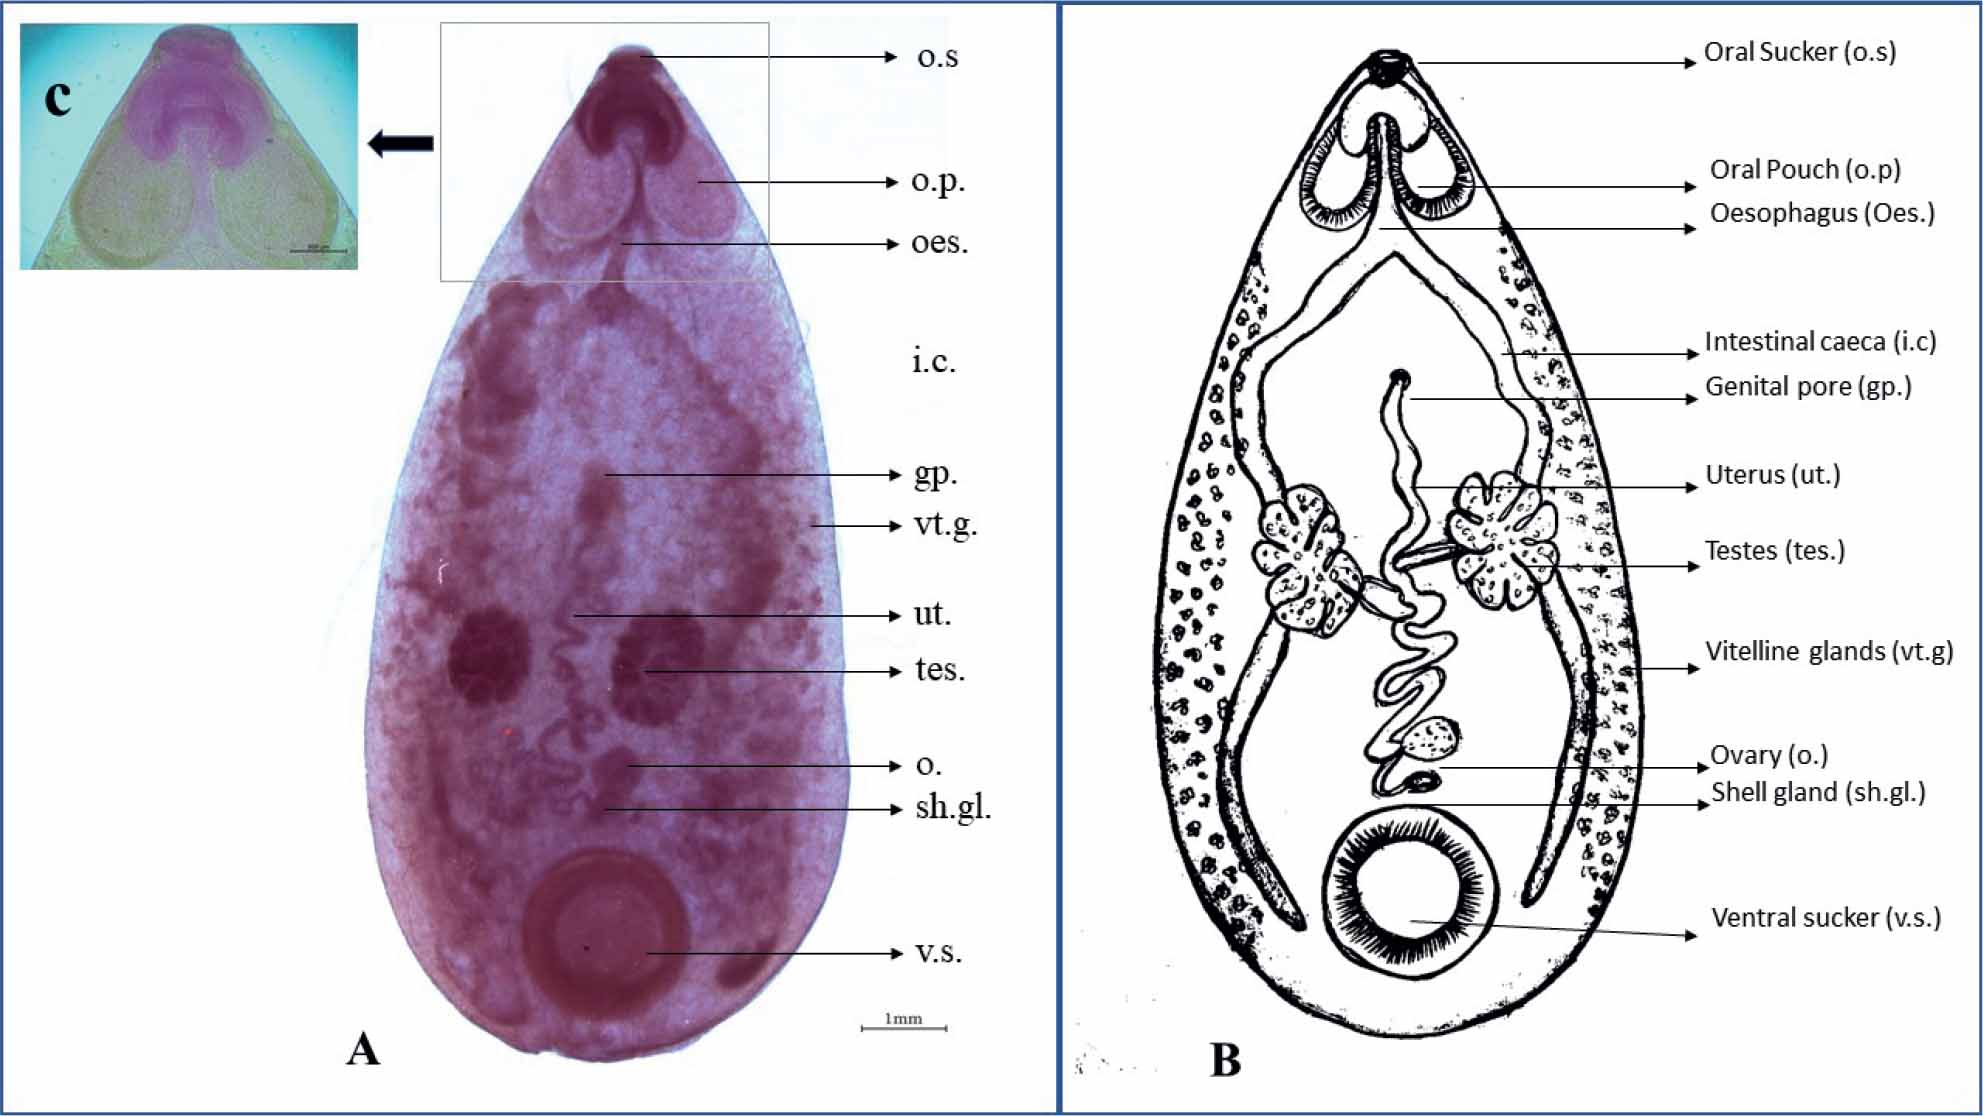
Fig. 1.
Pseudodiscus collinsi: A. Acetyl alum carmine stained adult intestinal fluke (o.s.: Oral sucker; o.p.: Oral pouch; oes.: Oesophagus; i.c.: Intestinal caeca; gp.: Genital pore; vt.g.: Vitelline glands; ut.: Uterus; tes.: Testes; o.: Ovary; sh.gl.: Shell gland; v.s.: Ventral sucker) B. Line diagram of adult Pseudodiscus collinsi C. Oral pouches of adult Pseudodiscus collinsi.
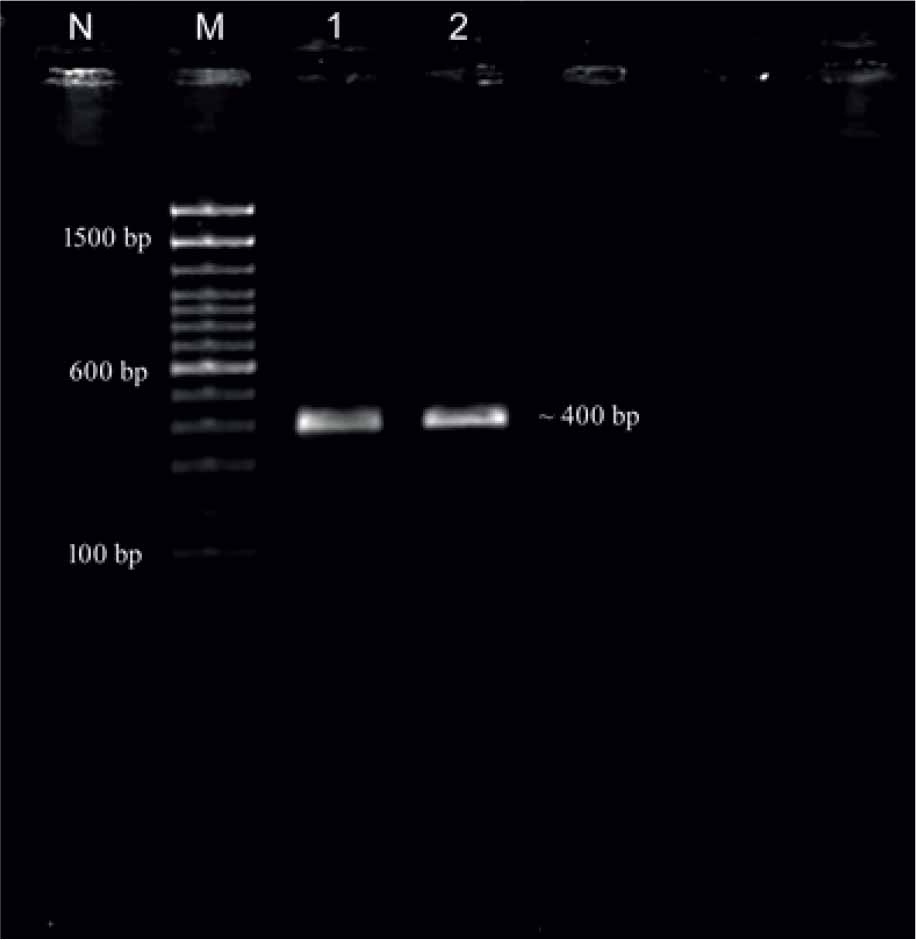
Fig. 2.
PCR amplification ITS-2 (~400 bp) of P. collinsi (Lane M: 100 bp plus ladder, Lane 1,2: P. collinsi samples, Lane N: Negative control).
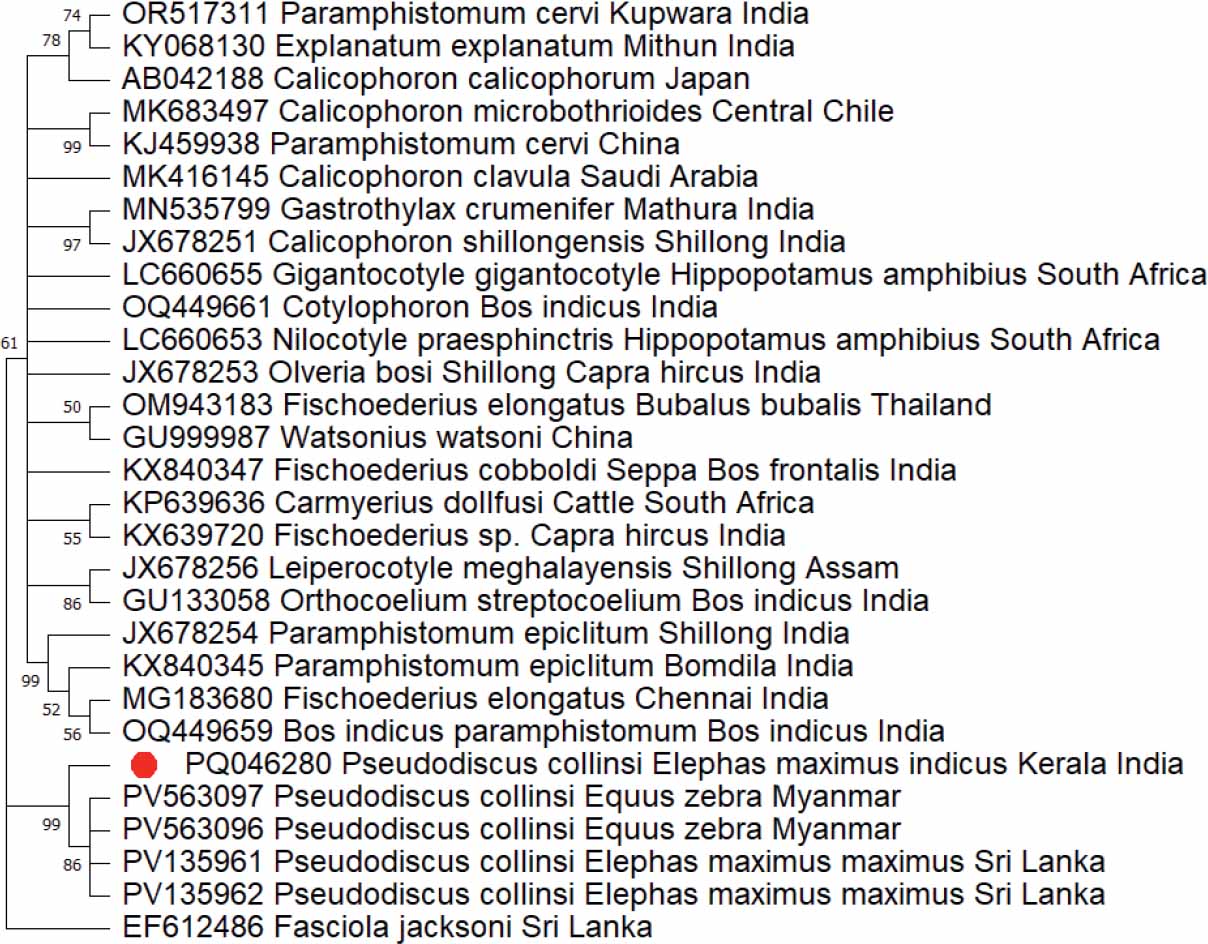
Fig. 3.
Phylogenetic analysis based on ITS-2 of P. collinsi.
The evolutionary history was inferred using the Maximum Likelihood (ML) method. The optimal tree is shown. The percentage of replicate trees in which the associated taxa clustered together in the bootstrap test (1000 replicates) are shown next to the branches. The evolutionary distances were computed using the Kimura 2-parameter method and are in the units of the number of base substitutions per site. The rate variation among sites was modelled with a gamma distribution (shape parameter = 1). This analysis involved 25 nucleotide sequences. All ambiguous positions were removed for each sequence pair (pairwise deletion option). There was a total of 335 positions in the final dataset. Evolutionary analyses were conducted in MEGA 11 (Tamura et al., 2021).