
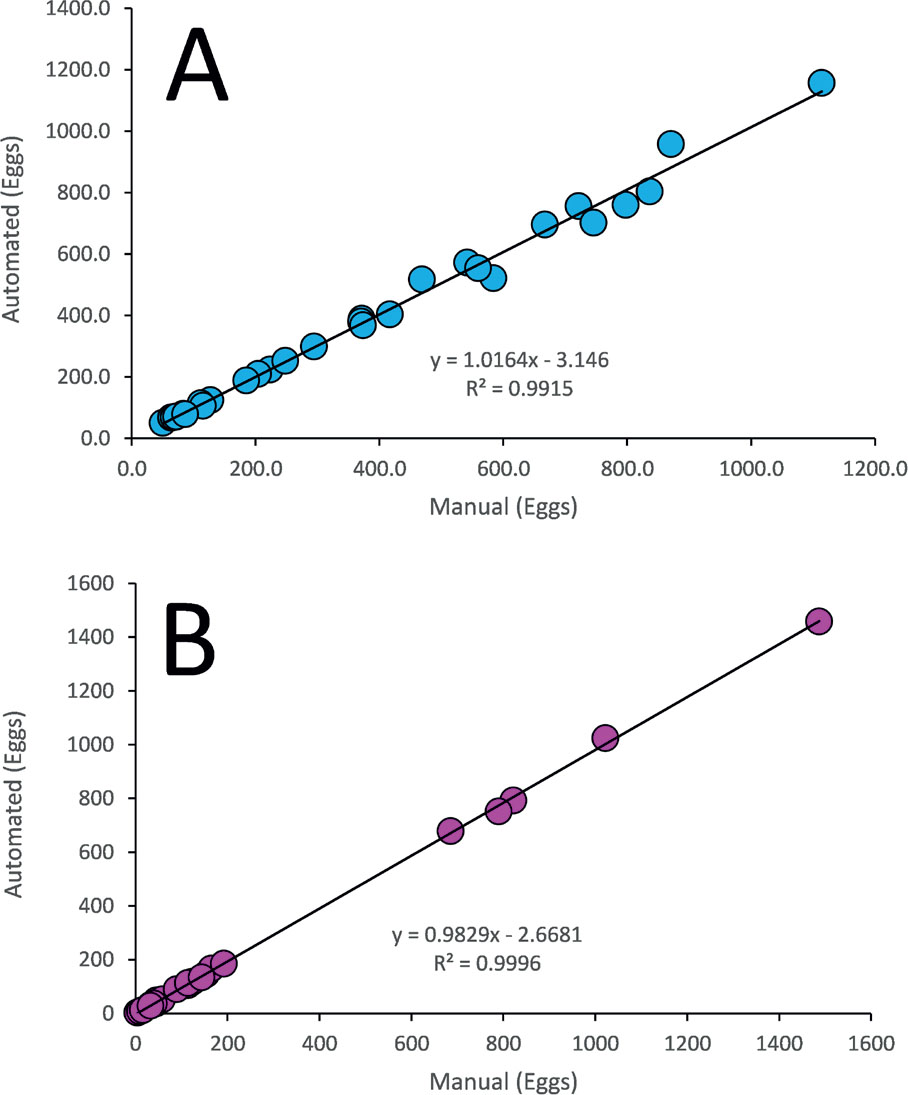
Fig. 1.
Comparison of Parasight AIO counting algorithm to human analyst enumeration for both strongylid (A) and ascarid (B) ova. Triplicate images for each sample were analyzed both computationally and manually and the averages of each result plotted against each other.
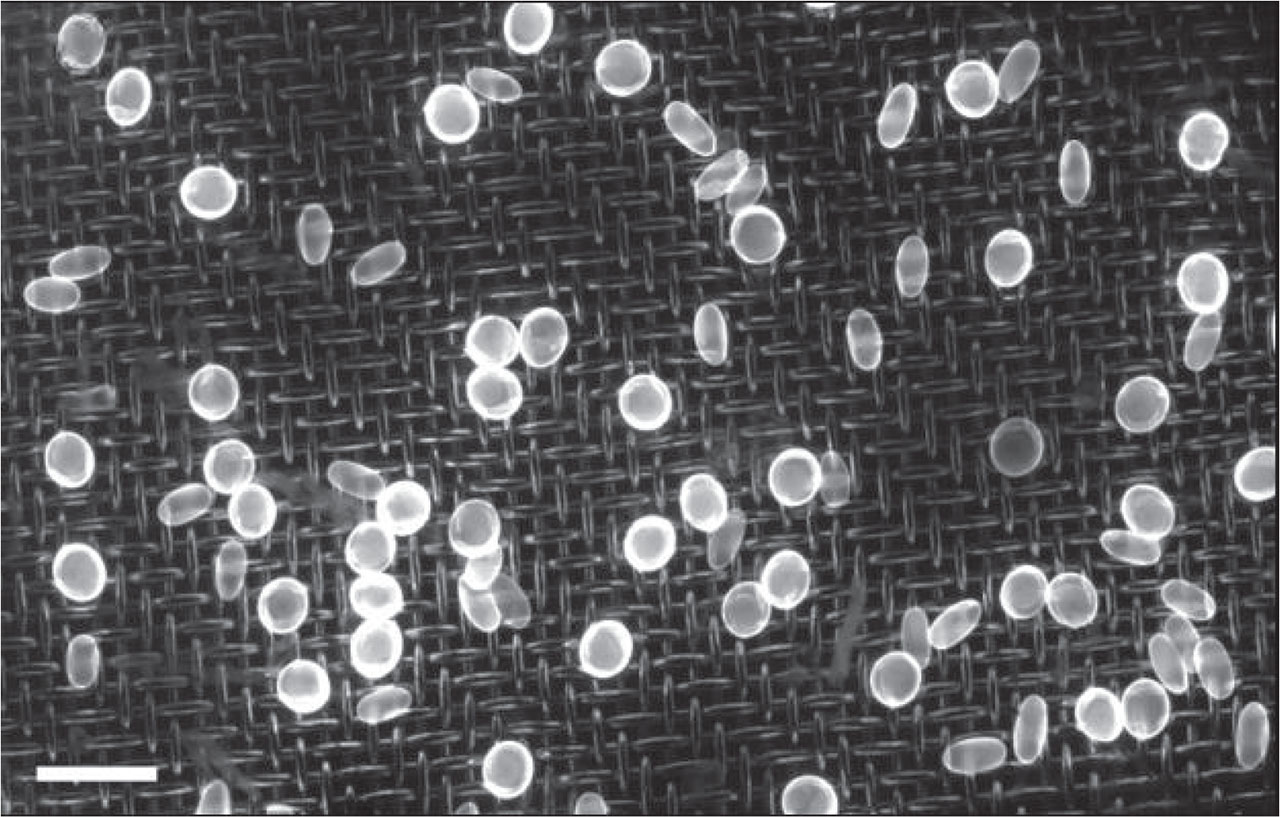
Fig. 2.
Fluorescence imaging of parasite ova. A portion from a representative image taken with the Parasight AIO unit showing both strongylid and ascarid ova. The mesh of the egg chamber is visible in the background. Bar = 200 μm.
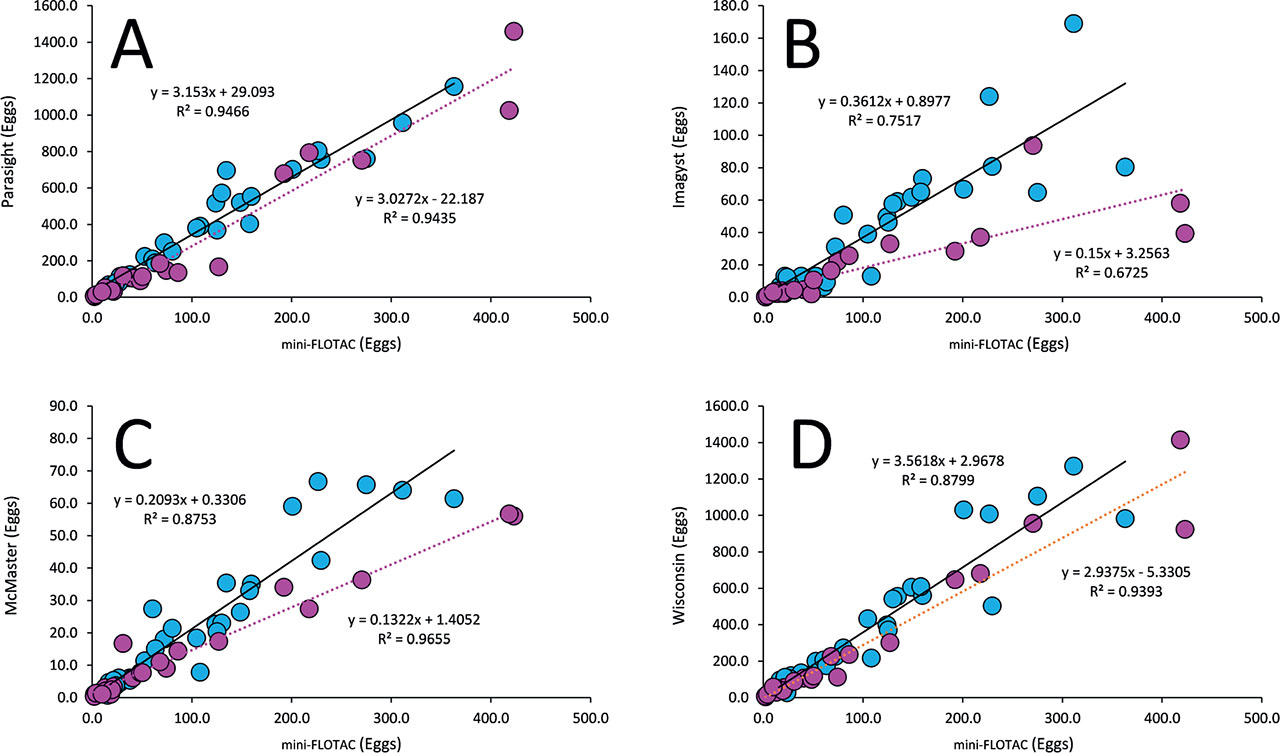
Fig. 3.
Comparison of mini-FLOTAC counts against counts of the same samples by Parasight AIO (A), Imagyst (B), McMaster (C) and Wisconsin (D). Each point is the average of three counts of the same sample by each method. Strongyle counts (blue) and ascarid counts (magenta) were plotted separately and fitted by linear regression to provide two lines whose equations and coefficients of determinations are displayed next to them.
Table 1.
Mean numbers of strongylid and ascarid ova counted by each method in each count group and for all groups combined. n = number of positive samples in the indicated group.
| Parasite | Group | n | McMaster | mini-FLOTAC | Wisconsin | Imagyst | Parasight |
|---|---|---|---|---|---|---|---|
| Strongylids | H | 10 | 48.9 | 220.8 | 822.4 | 84.4 | 730.8 |
| M | 10 | 18.5 | 92.2 | 303.4 | 31.6 | 339.7 | |
| L | 10 | 4.4 | 25.1 | 87.0 | 8.7 | 82.5 | |
| All | 30 | 23.9 | 112.7 | 404.3 | 41.6 | 381.2 | |
| Ascarids | H | 5 | 42.1 | 304.4 | 923.7 | 51.3 | 941.4 |
| M | 7 | 10.4 | 70.7 | 171.0 | 16.3 | 134.6 | |
| L | 10 | 3.2 | 13.5 | 38.8 | 2.4 | 37.6 | |
| All | 22 | 14.3 | 97.8 | 282.0 | 17.9 | 273.9 |
[i] H = High EPG (>650), M = Medium EPG (201–650), L = Low EPG (5–200).
Table 2.
Summary of the average number of eggs counted (EC) across all samples in the dataset for both strongyles and ascarids. Eggs counted were converted to eggs/gram (EPG) values by multiplication of EC by the appropriate multiplication factor (MF) for the method. The magnitude of the difference of EC and EPG relative to the mini-FLOTAC (mFT) method are also shown (EC vs. mFT and EPG vs. MFT).
| EC | EPG | EC vs mFT | EPG vs mFT | EC | EPG | EC vs mFT | EPG vs mFT | ||
|---|---|---|---|---|---|---|---|---|---|
| Wisconsin | 1 | 404.3 | 404.3 | 3.59 | 0.72 | 282.0 | 282.0 | 2.88 | 0.58 |
| Parasight | 1 | 381.2 | 381.2 | 3.38 | 0.68 | 273.9 | 273.9 | 2.80 | 0.56 |
| mini-FLOTAC | 5 | 112.7 | 563.3 | 1.00 | 1.00 | 97.8 | 489.0 | 1.00 | 1.00 |
| McMaster | 25 | 23.9 | 597.8 | 0.21 | 1.06 | 14.3 | 358.3 | 0.15 | 0.73 |
| Imagyst | N/A | 41.6 | N/A | 0.37 | N/A | 17.9 | N/A | 0.18 | N/A |