
Table 1.
Acute toxicity studies of mice treated with extracts of G. latifolium and P. nitida.
| No.Dead/No.Alive | Clinicalsigns | |||
|---|---|---|---|---|
| Dose(mg/kg) | G.latifolium | P.nitida | G.latifolium | P.nitida |
| 10 | 0/3 | 0/3 | Noobservablesign | Noobservablesign |
| 100 | 0/3 | 0/3 | ,, | ,, |
| 1000 | 0/3 | 0/3 | ,, | ,, |
| 1600 | 0/3 | 0/3 | ,, | ,, |
| 2900 | 0/3 | 0/3 | ,, | ,, |
| 5000 | 0/3 | 0/3 | ,, | ,, |
Table 2.
Phytochemicals, proximate composition and mineral contents of G. latifolium (roots) and P. nitida (seeds).
| G. latifolium | P. nitida | p-value | |
|---|---|---|---|
| Phytochemicals (mg/100g) | |||
| Saponin | 579.67 ± 0.88 | 115.00 ± 0.58 | 0.00 |
| Alkaloid | 396.67 ± 0.88 | 290.33 ± 0.89 | 0.00 |
| Tannin | 2.00 ± 0.12 | 2.90 ± 0.12 | 0.01 |
| Flavonoid | 3.27 ± 0.08 | 5.33 ± 0.07 | 0.00 |
| Total Polyphenol | 138.67 ± 0.89 | 217.00 ± 0.57 | 0.00 |
| Proximate composition (%) | |||
| Crude protein | 10.50 ± 0.00 | 14.43 ± 0.22 | 0.00 |
| Ash | 11.70 ± 0.35 | 3.37 ± 0.33 | 0.00 |
| Crude fat | 2.22 ± 0.52 | 3.36 ± 0.33 | 0.14 |
| Carbohydrate | 41.90 ± 0.02 | 29.70 ± 0.01 | 0.00 |
| Moisture | 7.05 ± 0.03 | 8.61 ± 0.00 | 0.00 |
| Mineral content (mg/kg) | |||
| Calcium | 48843.33 ± 83.33 | 473.33 ± 23.33 | 0.00 |
| Magnesium | 11846.67 ± 43.33 | 1543.33 ± 28.40 | 0.01 |
| Zinc | 127.13 ± 0.00 | 82.56 ± 0.00 | 0.00 |
| Copper | 35.19 ± 0.00 | 25.91 ± 0.01 | 0.00 |
| Iron | 2173.91 ± 0.01 | 445.44 ± 0.22 | 0.00 |
| Manganese | 423.0 ± 0.58 | 72.25 ± 0.32 | 0.00 |
| Potassium | 19891.0 ± 0.58 | 22217.59 ± 3.13 | 0.00 |
| Phosphorus | 217.02 ± 0.58 | 598.19 ± 0.95 | 0.00 |
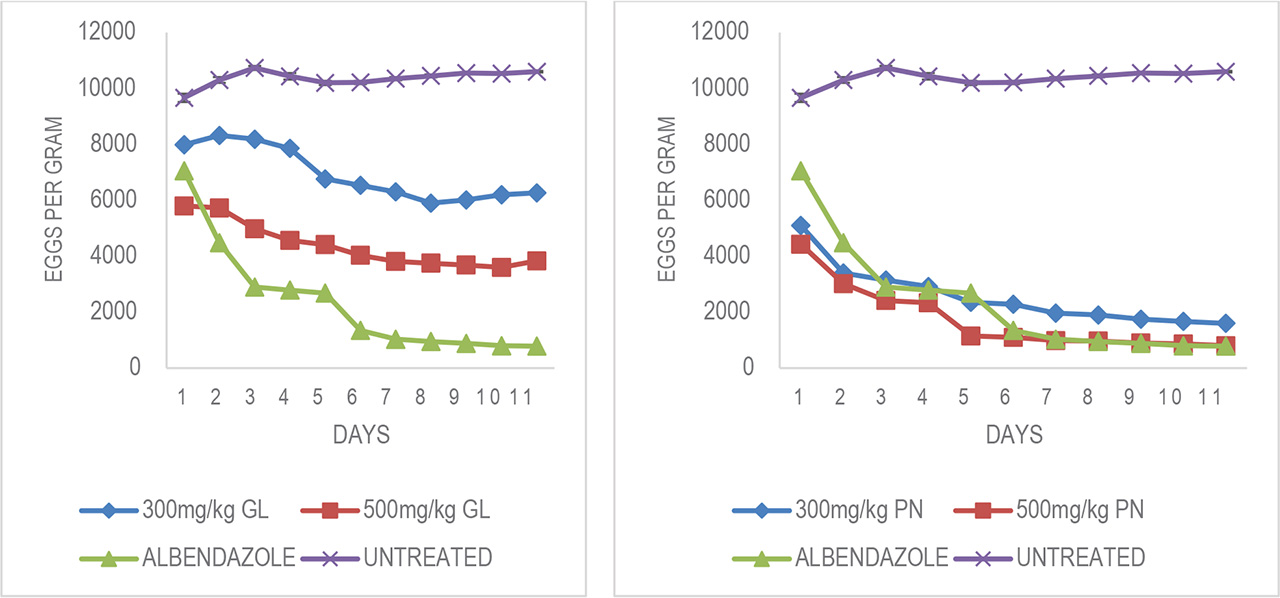
Fig. 1.
Egg per gram of faeces of H. bakeri in infected mice treated with (A) extract of G. latifolium at 300 and 500 mg/kg body weight (B) P. nitida at 300 and 500 mg/kg body weight.
Table 3.
Daily chemosuppression (%) of H. bakeri infection in mice administered single extract of G. latifolium, P. nitida and albendazole.
Values presented are mean from three mice in a group.
| Days | |||||||||||
|---|---|---|---|---|---|---|---|---|---|---|---|
| During treatment | Post treatment | ||||||||||
| Treatments | 1 | 2 | 3 | 4 | 5 | 6 | 7 | 8 | 9 | 10 | 11 |
| 300mg/kg GL | 17.38 | 19.22 | 23.76 | 24.70 | 33.66 | 36.05 | 39.13 | 43.54 | 42.87 | 41.14 | 40.88 |
| 500mg/kg GL | 40.00 | 44.39 | 53.57 | 56.23 | 56.73 | 60.52 | 63.12 | 64.11 | 65.03 | 65.82 | 63.84 |
| 300mg/kg PN | 47.24 | 67.00 | 70.65 | 72.01 | 76.96 | 77.65 | 81.00 | 81.81 | 83.41 | 84.17 | 84.91 |
| 500mg/kg PN | 54.17 | 70.71 | 77.48 | 77.64 | 88.73 | 89.23 | 90.50 | 90.75 | 91.46 | 91.77 | 92.45 |
| Albendazole | 27.07 | 56.47 | 72.98 | 73.29 | 73.69 | 86.79 | 90.01 | 90.91 | 91.62 | 92.41 | 92.61 |
Table 4.
Worm burden of infected mice treated with extract of G. latifolium, P. nitida and albendazole
Values were expressed as mean ± standard error of means. Columns with values bearing the same superscript are not significantly different (p<0.05).
Mean values presented were from three mice in a group.
| Treatment | Worm burden | Deparasitization (%) |
|---|---|---|
| 300mg/kg GL | 57.50 ± 0.50c | 21.23 |
| 500mg/kg GL | 40.75 ± 1.11b | 44.17 |
| 300mg/kg PN | 20.00 ± 2.08a | 72.60 |
| 500mg/kg PN | 16.67 ± 0.33a | 77.16 |
| Albendazole | 19.33 ± 0.67a | 73.52 |
| Untreated | 73.00 ± 1.15d |
Table 5.
Biochemical parameters of H. bakeri infected mice treated with extracts of G. latifolium and P. nitida
Rows with values bearing the same superscript are not significantly different (p>0.05).
Values were expressed as mean ± standard error of means. Mean values presented were from three mice in a group.
| Parameter | 300mg/kg GL | 500mg/kg GL | 300mg/kg PN | 500mg/kg PN | Albendazole | Untreated | Uninfected untreated |
|---|---|---|---|---|---|---|---|
| Glucose (mg/dl) | 117.61 ± 4.71d | 123.21 ± 4.46d | 75.45 ± 2.94a | 88.63 ± 3.86b | 81.50 ± 1.21ab | 100.28 ± 2.61c | 122.00 ± 1.53d |
| Cholesterol (mg/dl) | 80.17 ± 1.80bc | 81.53 ± 4.50bc | 68.90 ± 4.04b | 89.29 ± 5.31c | 78.30 ± 5.29bc | 82.37 ± 8.76bc | 40.67 ± 0.67a |
| T. Protein (g/dl) | 3.77 ± 0.27ab | 6.53 ± 1.42bc | 2.11 ± 0.38a | 3.62 ± 0.38ab | 4.61 ± 1.07ab | 6.49 ± 1.38bc | 8.27 ± 0.27c |
| Albumin (g/dl) | 2.21 ± 0.09ab | 2.55 ± 0.45ab | 1.37 ± 0.51a | 1.96 ± 0.15ab | 2.78 ± 0.44ab | 2.49 ± 0.31ab | 3.27 ± 0.07b |
| Triglyceride (mg/dl) | 83.68 ± 5.67b | 122.32 ± 6.58e | 116.30 ± 5.67de | 119.62 ± 3.92de | 103.21 ± 7.12cd | 98.35 ± 4.72bc | 24.67 ± 0.67a |
| HDL (mg/dl) | 52.39 ± 0.06c | 41.51 ± 1.88b | 33.94 ± 1.33b | 50.43 ± 4.82c | 32.68 ± 4.37b | 38.22 ± 3.40b | 10.33 ± 0.33a |
| LDL (mg/dl) | 11.05 ± 0.71a | 15.55 ± 1.30a | 11.70 ± 1.58a | 14.94 ± 1.27a | 24.87 ± 0.48b | 24.48 ± 6.30b | 25.40 ± 0.20b |
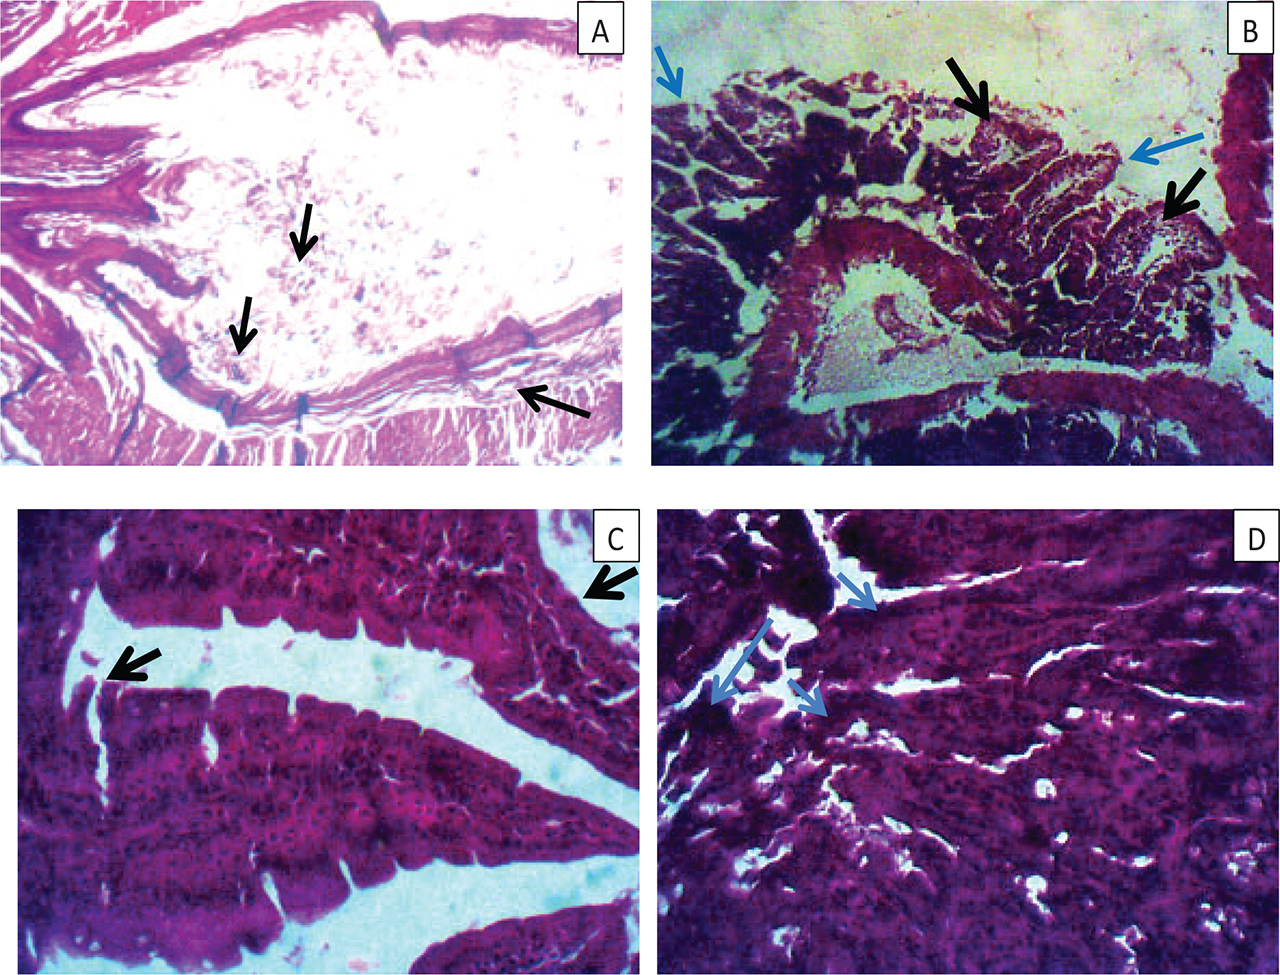
Fig. 2.
Micrographs of Intestinal segments of (A) untreated mice with severe villi atrophy and intra-luminal parasite (black arrow). (B) mice treated with 500mg/kg G. latifolium showing moderate villi atrophy (black arrow) and cryptal hyperplasia (blue arrow). (C) mice treated with 500mg/kg P. nitida showing moderate villi (black arrows) atrophy (D) positive control showing cryptal hyperplasia (blue arrow) HE x400.