
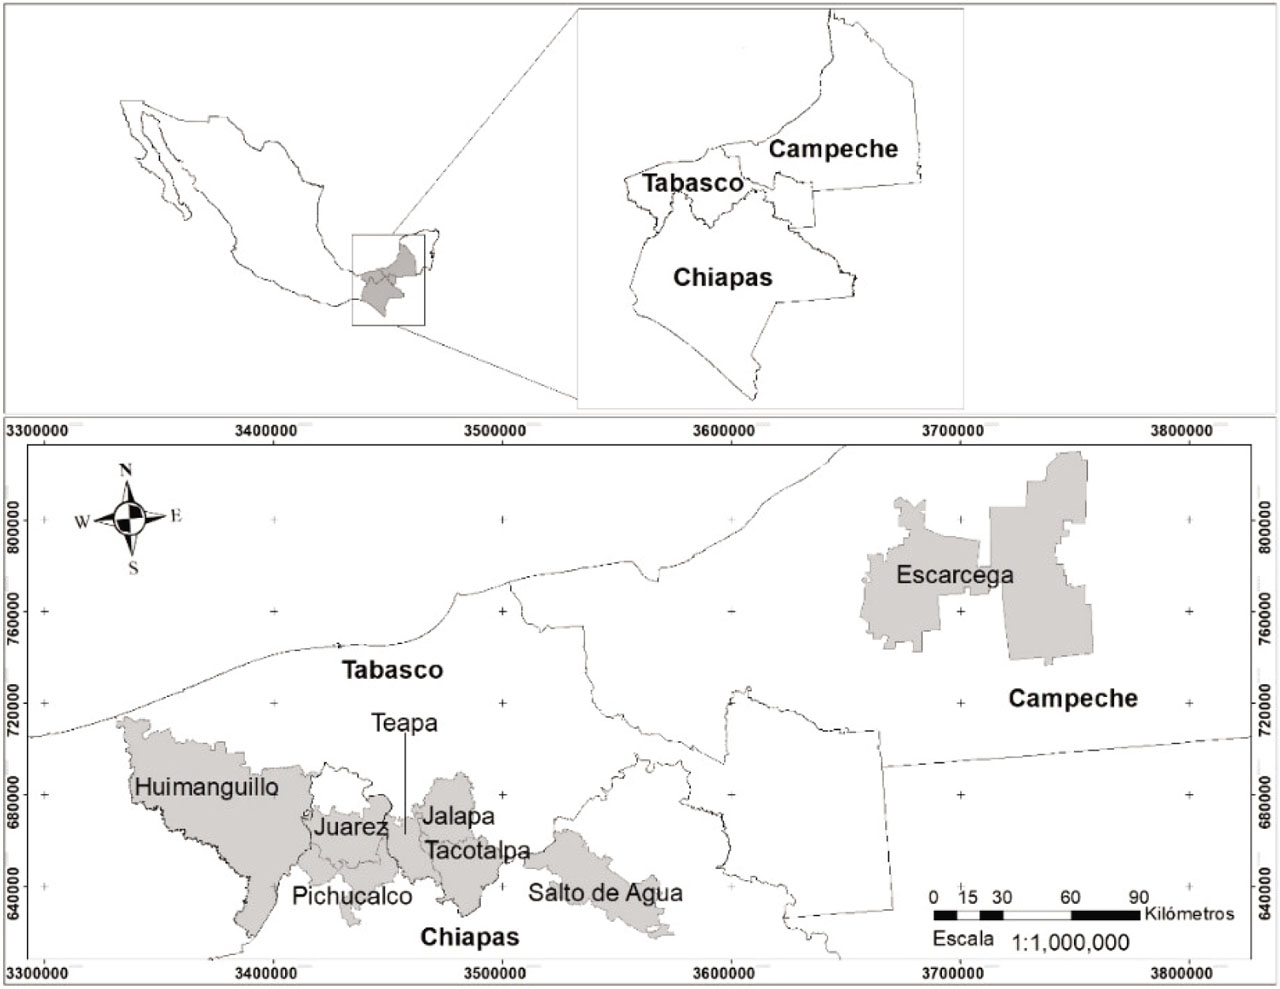
Fig. 1.
Map of the study area to determine the prevalence of trematodes in southeastern Mexico.
Table 1.
Number of bovines sampled per year, type of sampling and state of origin of the animals.
| Year | Type of sample | State | Number of samples |
|---|---|---|---|
| 2018 | Faeces for determination of trematode eggs | Tabasco | 193 |
| Chiapas | 98 | ||
| 2019 | Faeces for determination of liver and rumen fluke eggs | Tabasco | 227 |
| Chiapas | 34 | ||
| Campeche | 50 | ||
| Presence of liver and rumen flukes in slaughtered cattle | Tabasco | 83 | |
| Chiapas | 325 | ||
| Total | 1010 |
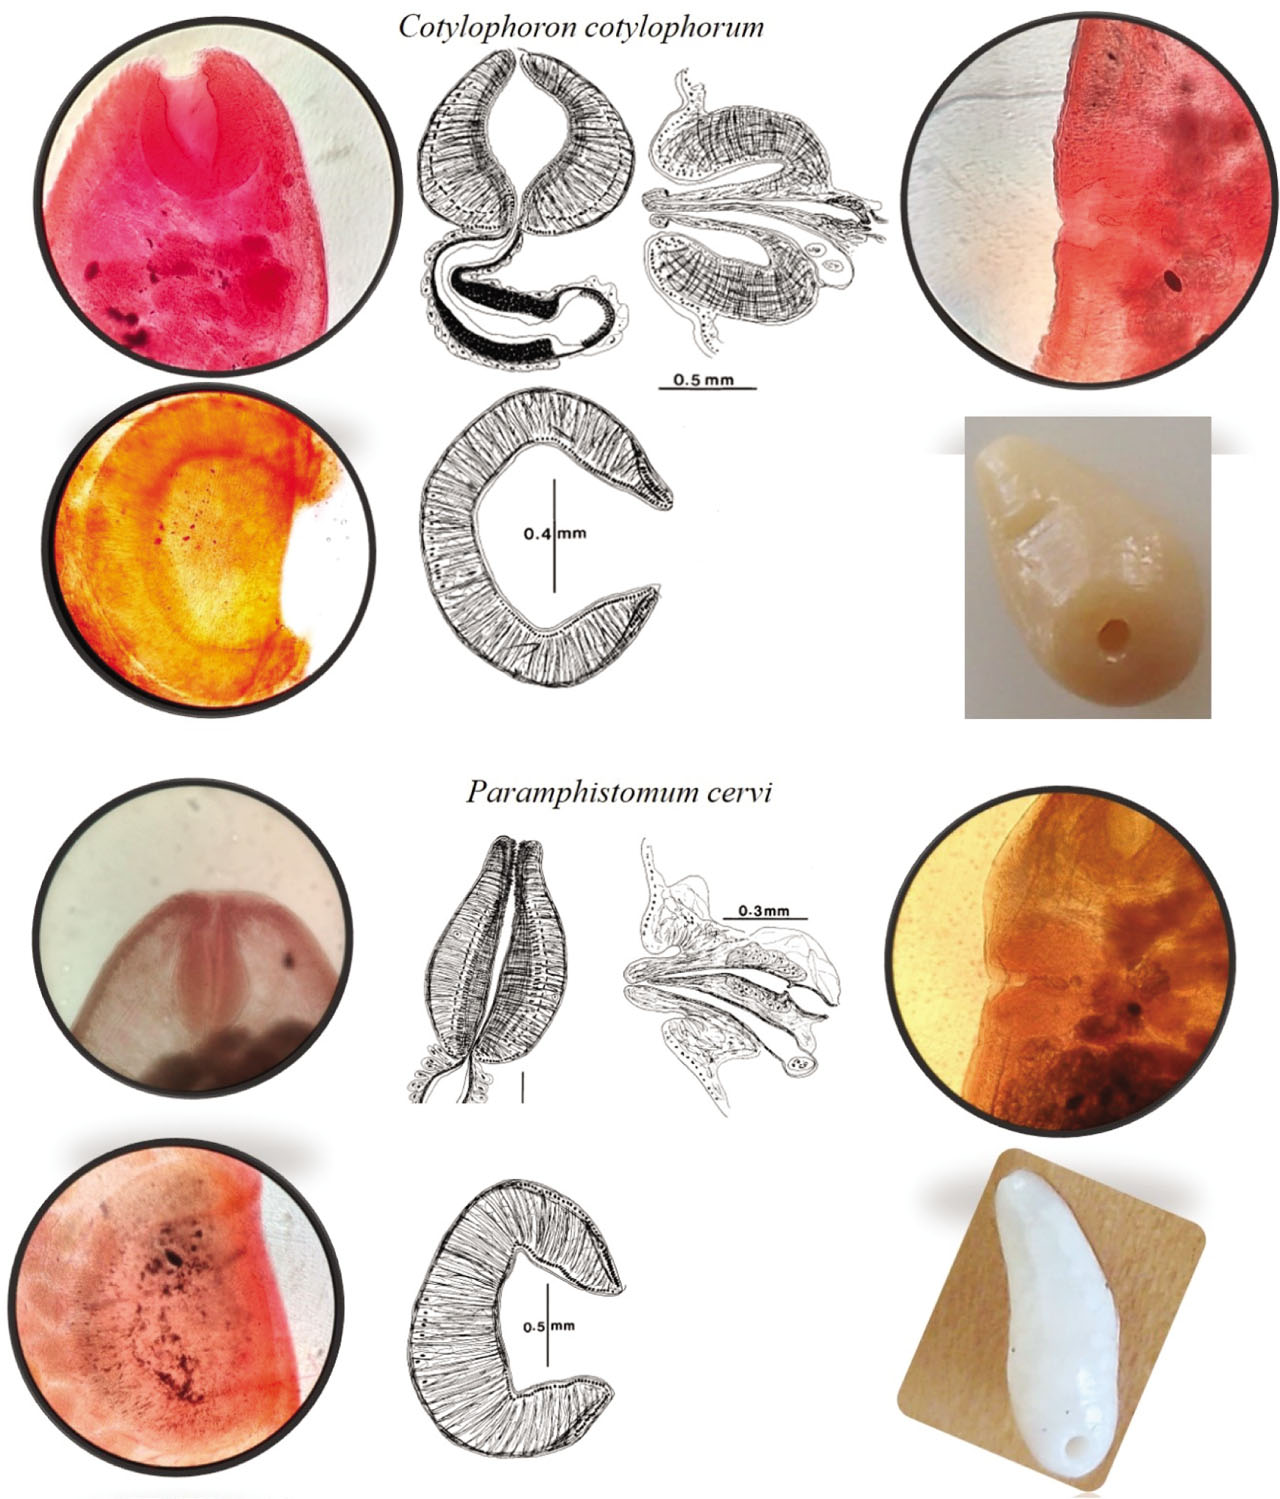
Fig. 2.
Morphological identification of Cotylophoron cotylophorum and Paramphistomum cervi.
Table 2.
Average faecal fluke egg (liver and rumen flukes) counts in cattle in southeastern Mexico according to sex, age and origin.
| Variable | N | Mean | SE | Q1 | Median | Q3 |
|---|---|---|---|---|---|---|
| Fasciola hepatica egg per gram of faeces (epg) | ||||||
| Male | 11 | 0.2 | 0.2 | 0.0 | 0.0 | 0.7 |
| Female | 129 | 8.7 | 1.0 | 2.0 | 4.0 | 12.0 |
| Steers (< 3 years) | 11 | 0.2 | 0.1 | 0.0 | 0.0 | 0.7 |
| Cows (> 3 years) | 129 | 9.2 | 1.1 | 2.0 | 4.0 | 14.0 |
| Tabasco | 107 | 10.3 | 1.2 | 2.0 | 4.0 | 16.0 |
| Chiapas | 33 | 2.7 | 0.9 | 0.0 | 0.7 | 4.0 |
| Rumen fluke egg per gram of faeces (epg) | ||||||
| Male | 11 | 0.7 | 0.4 | 0.0 | 0.7 | 1.3 |
| Female | 130 | 3.1 | 0.4 | 0.0 | 2.0 | 4.0 |
| Steers (< 3 years) | 11 | 0.3 | 0.1 | 0.0 | 0.0 | 0.7 |
| Cows (> 3 years) | 130 | 3.3 | 0.4 | 0.0 | 2.0 | 4.0 |
| Tabasco | 107 | 3.4 | 0.5 | 0.0 | 2.0 | 4.0 |
| Chiapas | 34 | 1.9 | 0.4 | 0.0 | 0.7 | 2.0 |
| Trematode egg per gram of faeces (epg) | ||||||
| Male | 11 | 0.9 | 0.4 | 0.0 | 1.3 | 1.3 |
| Female | 136 | 11.4 | 1.2 | 2.0 | 4.0 | 15.0 |
| Steers (< 3 years) | 11 | 0.5 | 0.2 | 0.0 | 0.7 | 1.3 |
| Cows (> 3 years) | 136 | 12.0 | 1.3 | 2.0 | 6.0 | 16.0 |
| Tabasco | 107 | 13.7 | 1.5 | 2.0 | 8.0 | 18.0 |
| Chiapas | 40 | 4.5 | 0.9 | 1.3 | 2.0 | 6.5 |
[i] N number of samples. SE Standard error. Q1 First quartile. Q3 Third quartile.
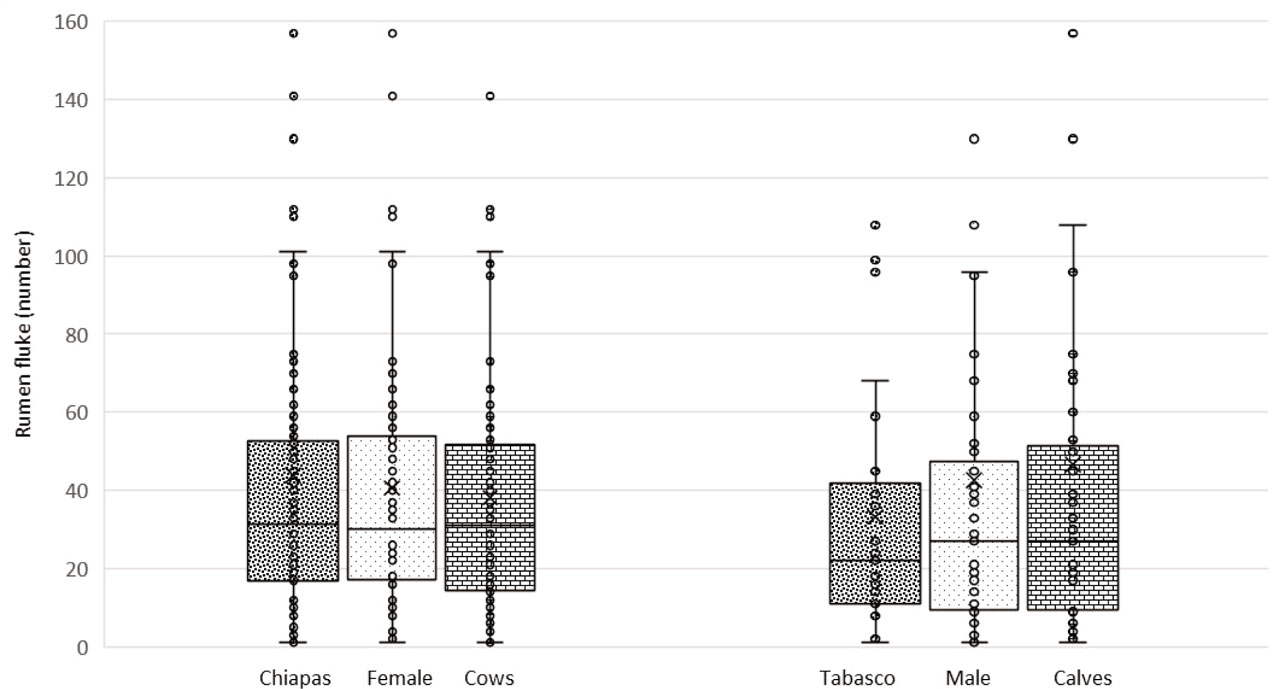
Fig 3.
Fluke counts after cattle slaughter in southeastern Mexico by origin, sex and age.
Table 3.
Prevalence of flukes in cattle in a humid warm climate of Mexico by study variable.
| Risk factor | Fasciola hepatica | Rumen fluke | Trematodes | ||
|---|---|---|---|---|---|
| N | Positives (%) | Positives (%) | N | Positives (%) | |
| Year | |||||
| 2018* | 291 | - | - | 291 | 94 (32.3) |
| 2019 | 719 | 134 (18.6) | 240 (33.4) | 719 | 300 (41.7) |
| Type of sample | |||||
| Eggs in faeces | 311 | 130 (41.8) | 131 (42.1) | 602 | 281 (46.7) |
| Flukes | 408 | 4 (1.0) | 109 (26.7) | 408 | 113 (27.7) |
| Physiographic zone | |||||
| Flood-prone areas | 278 | 117 (42.1) | 138 (49.6) | 321 | 216 (67.3) |
| Hillocks | 441 | 17 (3.9) | 102 (23.1) | 689 | 178 (25.8) |
| Sex | |||||
| Male | 204 | 1 (0.5) | 52 (25.5) | 212 | 52 (24.5) |
| Female | 515 | 133 (25.8) | 188 (36.5) | 798 | 342 (42.9) |
| Age | |||||
| Steers >1<3 years | 187 | 1 (0.5) | 45 (24.1) | 254 | 57 (22.4) |
| Young cows (<7) | 424 | 131 (30.9) | 160 (37.7) | 623 | 289 (46.4) |
| Old cows (> 7y) | 108 | 2 (1.8) | 35 (32.4) | 133 | 48 (36.1) |
| State | |||||
| Tabasco | 310 | 109 (35.2) | 119 (38.4) | 503 | 207 (41.2) |
| Chiapas | 359 | 25 (7.0) | 102 (28.4) | 457 | 168 (36.8) |
| Campeche | 50 | 0 (0.0) | 19 (38.0) | 50 | 19 (38.0) |
Table 4.
Odds ratio of the study variables that affect the presence of trematodes (Fasciola hepatica and rumen fluke) in cattle in a hot humid climate.
| Risk factor | B | Standard error | Wald | Odds ratio | 95% CI |
|---|---|---|---|---|---|
| Constant | −3.9 | 0.8 | 22.45 | ||
| Type of sample | |||||
| Fluke | Baseline | 1.00 | |||
| Eggs in faeces | 1.19 | 0.49 | 6.0 | 3.3* | 1.27–8.53 |
| Physiographic zone | |||||
| Hillocks | Baseline | 1.00 | |||
| Flood-prone areas | 2.48 | 0.37 | 44.7 | 11.98** | 5.78–24.82 |
| Sex | |||||
| Female | Baseline | 1.00 | |||
| Male | −0.35 | 0.49 | 0.52 | 0.71ns | 0.27–1.83 |
| Age | |||||
| Old cows (> 7y) | Baseline | 1.00 | |||
| Steers >1<3 years | −0.81 | 0.53 | 2.33 | 0.44ns | 0.16–1.26 |
| Young cows (<7) | −0.24 | 0.42 | 0.32 | 0.78ns | 0.35–1.79 |
| State | |||||
| Campeche | Baseline | 1.00 | |||
| Tabasco | 1.98 | 0.61 | 10.46 | 7.27** | 2.19–24.21 |
| Chiapas | 3.29 | 0.75 | 18.90 | 26.88** | 6.09–118.51 |
Table 5.
Odds ratio of the study variables that affect the presence of liver and rumen fluke in cattle in a hot humid climate.
| Fasciola hepatica | Rumen fluke | |||||||||
|---|---|---|---|---|---|---|---|---|---|---|
| Risk factor | B | SE | Wald | Odds ratio | 95% CI | B | SE | Wald | Odds ratio | 95% CI |
| Constant | −21.31 | 261.6 | 0.006 | −2.05 | 0.71 | 8.23 | ||||
| Type of sample | ||||||||||
| Fluke | Baseline | 1.0 | 1.0 | |||||||
| Eggs in faeces | 2.8 | 0.67 | 17.4 | 16.35** | 4.4–60.8 | 0.43 | 0.45 | 0.88 | 1.53ns | 0.63–3.73 |
| Physiographic zone | ||||||||||
| Hillocks | Baseline | 1.0 | 1.00 | |||||||
| Flood-prone areas | 2.8 | 0.38 | 50.35 | 15.76** | 7.36–33.76 | 1.6 | 0.36 | 19.15 | 4.94** | 2.41–10.1 |
| Sex | ||||||||||
| Female | Baseline | 1.0 | 1.0 | |||||||
| Male | −2.8 | 1.28 | 4.92 | 0.058* | 0.005–0.72 | −0.09 | 0.44 | 0.05 | 0.91ns | 0.38–2.17 |
| Age | ||||||||||
| Old cows (> 7y) | Baseline | 1.0 | 1.0 | |||||||
| Steers | 0.12 | 1.61 | 0.05 | 1.13ns | 0.05–26.67 | −0.59 | 0.52 | 1.28 | 0.55ns | 0.19–1.54 |
| Young cows (<7) | 0.96 | 0.98 | 0.96 | 2.6* | 1.38–17.7 | −0.45 | 0.43 | 1.07 | 0.64ns | 0.27–1.49 |
| State | ||||||||||
| CampecheΩ | - | - | - | - | - | Baseline | 1.00 | |||
| Chiapas | Baseline | 1.0 | 1.33 | 0.65 | 4.2 | 3.78* | 1.06–13.5 | |||
| Tabasco | −0.31 | 0.6 | 0.29 | 0.73ns | 0.24–2.25 | 0.68 | 0.51 | 1.8 | 1.98ns | 0.72–5.4 |