
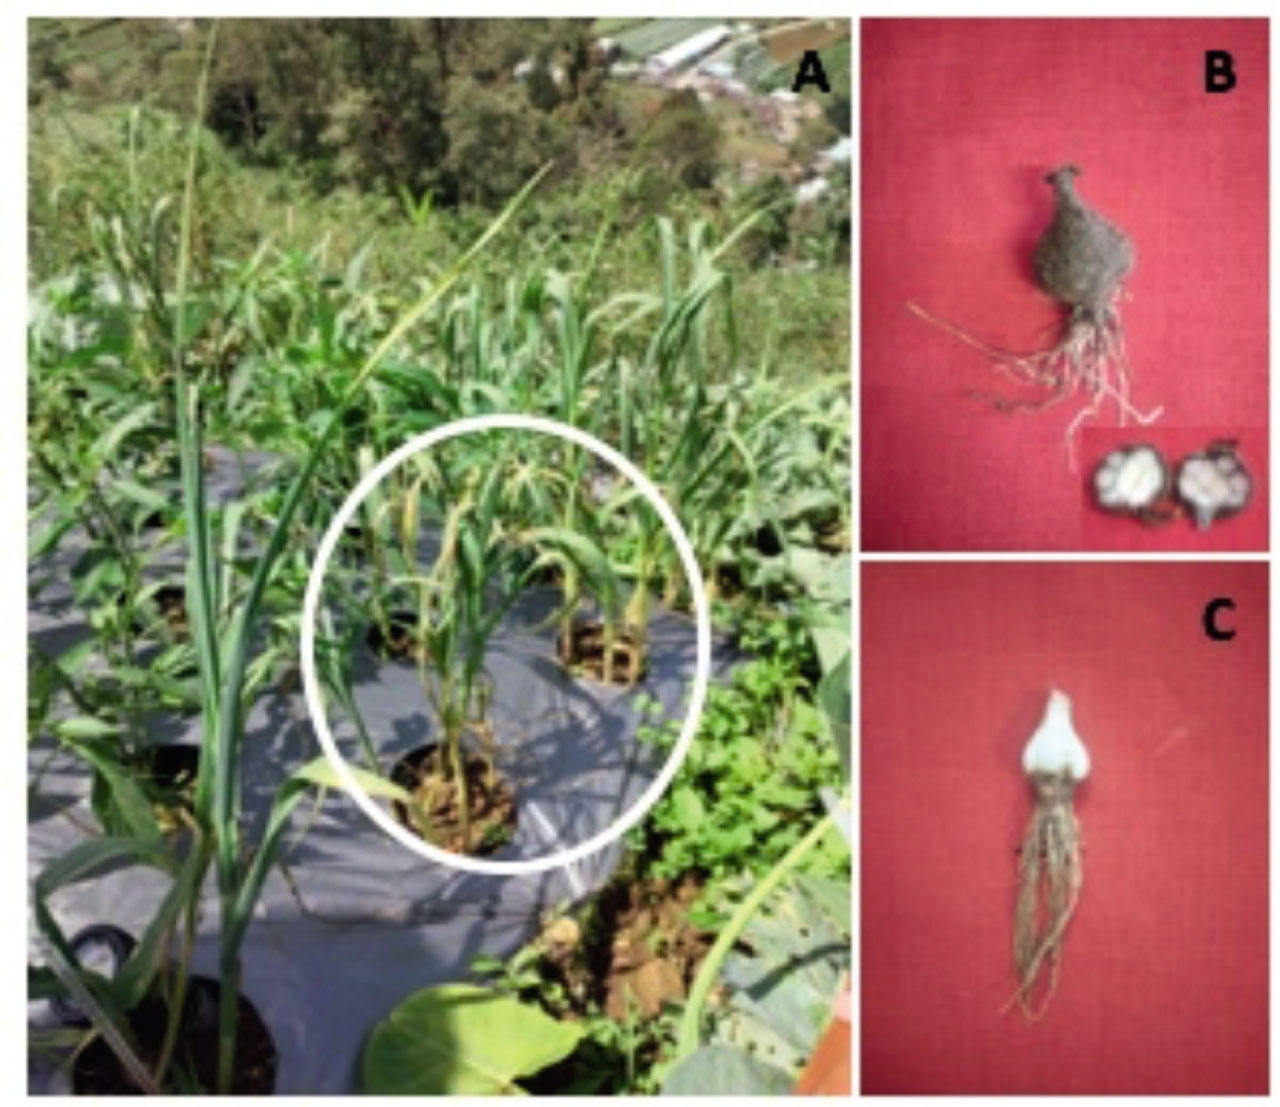
Fig. 1.
Plant damaged symptoms. (A) plant symptoms on the ground (B) rot bulb associated with fungi (C) root rot damaged.
Table 1.
The nematode population found extracted from root, soil and bulb of garlic plants.
| Nematodes Genera | Site 1 (Lumbu Kuning Variety) | Site 2 (Tawangmangu Baru Variety) | ||||
|---|---|---|---|---|---|---|
| Roots (0.5 g) | Bulbs (3 g) | Soil (100 g) | Roots (0.5 g) | Bulbs (3 g) | Soil (100 g) | |
| Aphelenchoides | 50.8 | 38 | 2.5 | 8 | 0.8 | 0 |
| Helicotylenchus | 0.6 | 0 | 7.5 | 0.2 | 0 | 19.7 |
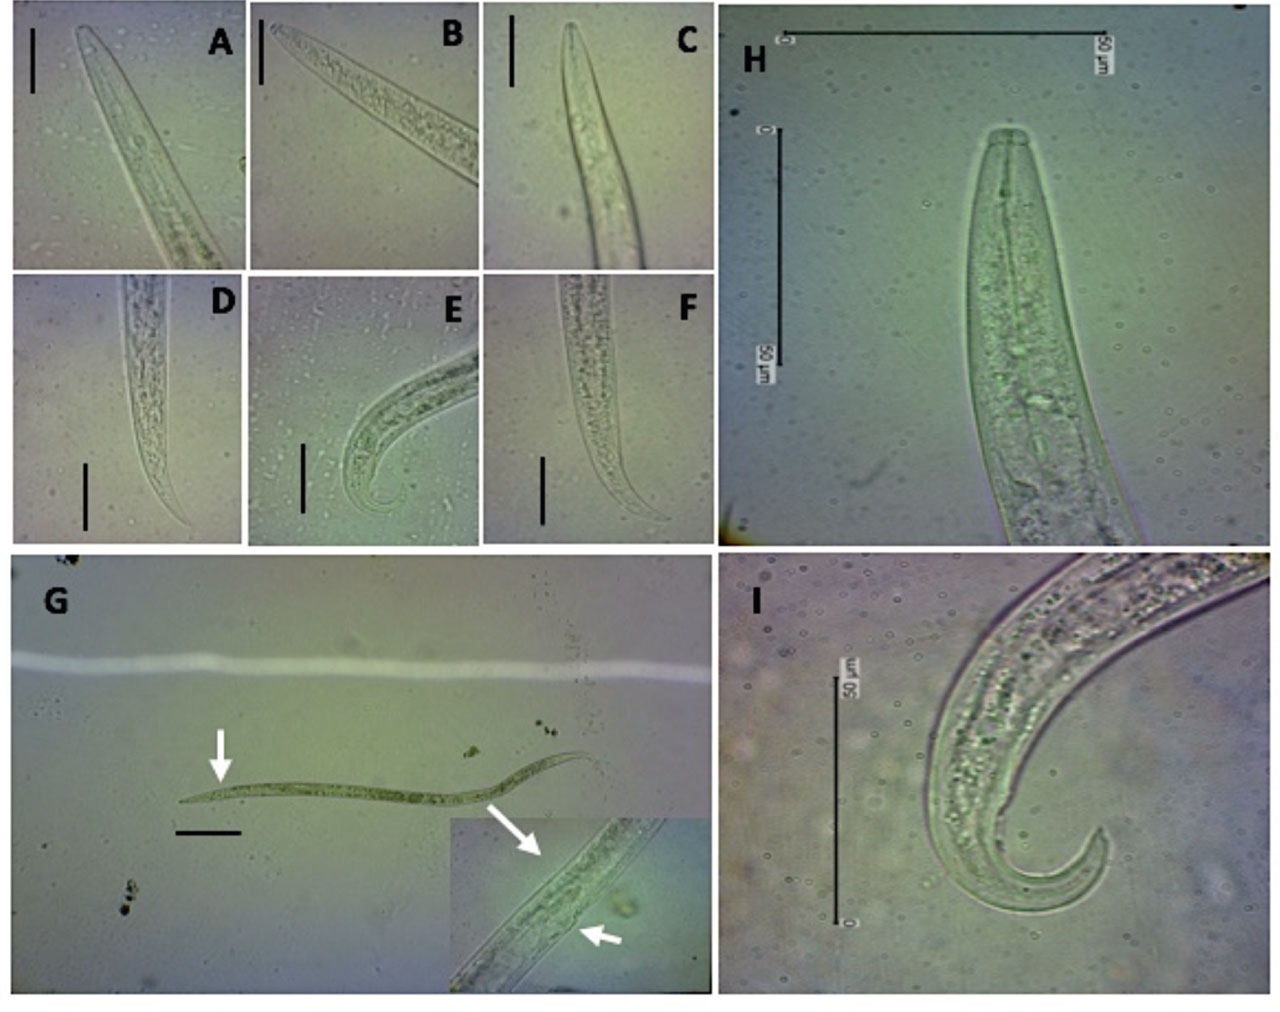
Fig. 2.
A. varicaudatus (A–C) anterior region (D–F) tail shape variation (G) entire body with large metacorpus and vulva at ~60% of body length (H) lips, stylet, and large metacorpus (I) dorsally convex-conoid tail with little mucro (Scale bars: A–F, G–I: 50 μm; G: 100 μm)
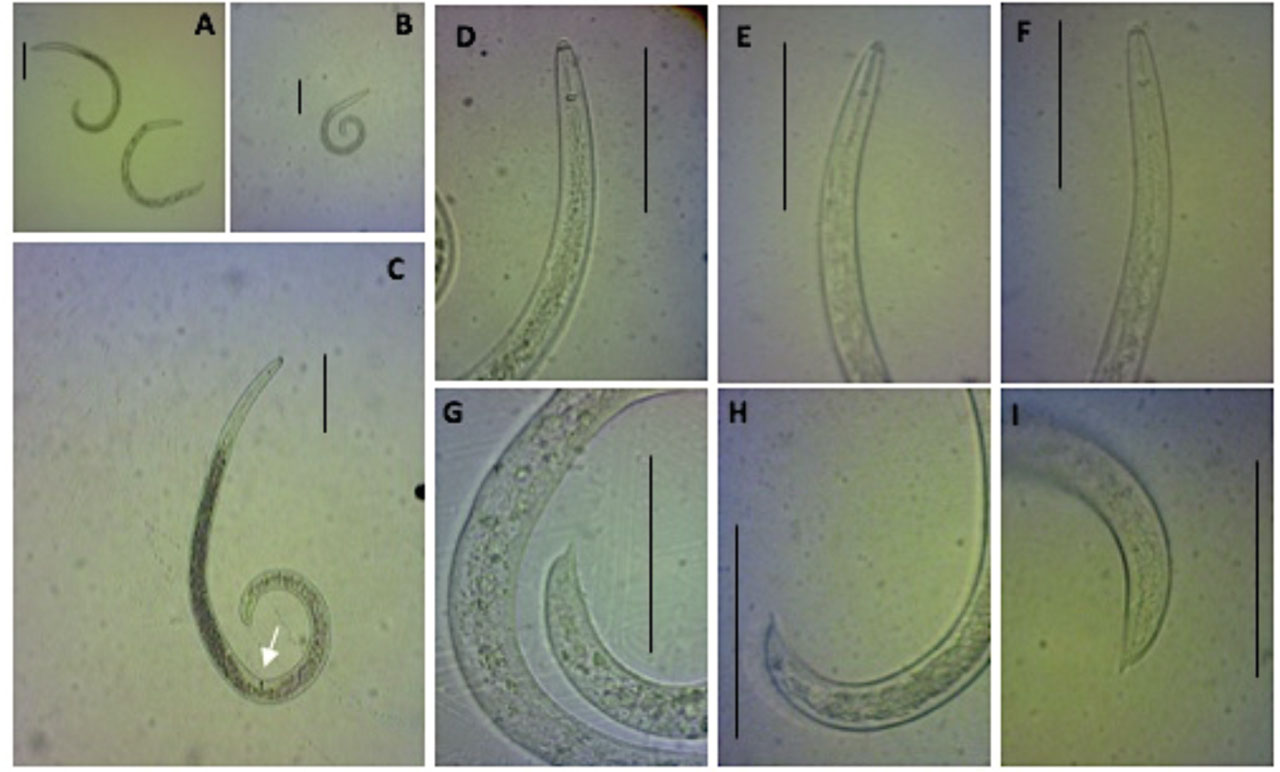
Fig. 3.
H. erythrinae (A–C) spiral shape variation (C) entire body, vulva at ±60% of body length (D–F) anterior region, lips and stylet with knob flat or slightly anterior projection (G–I) conoid tail with variation of mucro (Scale bars: 100 μm)
Table 2.
Measurements of female A. varicaudatus. All measurements are in μm except for V in % and in the form mean±s.d (range).
| Location Publication | Magelang. Indonesia (This Study) | Tegal. Indonesia (Kusuma et al.. 2020) | Yunnan. China (Huang et al.. 2012) |
|---|---|---|---|
| Number of Specimen | 5 | 7 | 20 |
| Body Length | 645.20 ± 54.44 (565.39 – 710.57) | 567.35 ± 74.74 (494.51 – 704.59) | 780 ± 56.70 (634 – 900) |
| Stylet Length | 17.14 ± 0.53 (16.67 – 18.05) | 12.39 ± 1.01 (11.17 – 14.01) | 14.20 ± 0.50 (13.50 – 15.00) |
| Tail Length | 55.66 ± 3.13 (52.02 – 59.85) | 36.63 ± 2.96 (32.61 – 42.34) | 49.00 ± 2.90 (43.00 – 53.00) |
| V (%) | 61.74 ± 1.25 (60.30 – 63.18) | 69.72 ± 1.15 (68.32 – 71.2) | 69.20 ± 0.75 (68.20 – 71.20) |
| a | 22.30 ± 2.08 (20.02 – 25.03) | 28.71 ± 3.98 (24.29 – 35.8) | 30.40 ± 1.68 (26.50 – 33.20) |
| c | 11.59 ± 0.68 (10.87 – 12.65) | 15.47 ± 1.26 (13.81 – 16.90) | 16.11 ± 0.58 (15.00 – 17.10) |
Table 3.
Measurements of female H. erythrinae. All measurements are in μm except for V in % and in the form mean±s.d (range).
| Location | Magelang. Indonesia | Palmerston. New Zealand | Haast. New Zealand | Calarcá. Quindío. Colombia | La Celia. Risaralda. Colombia | |
|---|---|---|---|---|---|---|
| Publication | (This Study) | (Wouts & Yeates. 1994) | (Riascoz-Ortiz et al.. 2020) | (Uzma. et al.. 2015) | ||
| Number of Specimen | 7 | 10 | 10 | 15 | 25 | |
| Body Length | 605.35 ± 68.33 (500.30 – 690.54) | 873 ± 63.90 (761 – 938) | 690 ± 49.80 (631 – 758) | 530 ± 100 (400 – 700) | 600 ± 100 (460 – 680) | 480 – 610 |
| Stylet Length | 28.19 ± 2.57 (22.64 – 29.87) | 28.30 ± 1.23 (26.00 – 30.00) | 27.90 ± 0.97 (25.50 – 29.00) | 22.70 ± 1.00 (21.00 – 25.00) | 22.80 ± 0.83 (21.00 – 24.00) | (23 – 26) |
| Tail Length | 23.69 ± 6.22 (19.39 – 30.57) | 20.60 ± 2.80 (16.00 – 24.00) | 14.70 ± 2.71 (9 – 18) | 20.53 ± 2.20 (17.00 – 25.00) | 20.65 ± 2.39 (17.00 – 26.00) | |
| V (%) | 66.55 ± 4.08 (62.95 – 72.87) | 62 ± 2.85 (58 – 68) | 63 ± 2.22 (59 – 65) | 63.80 ± 1.80 (60.10 – 67.60) | 63.70 ± 2.16 (60.82 – 68.54) | (60 – 65) |
| a | 21.79 ± 1.64 (18.86 – 23.64) | 29.70 ± 1.64 (27.00 – 32.00) | 28.20 ± 1.87 (24.00 – 30.00) | 25.03 ± 2.00 (22.70 – 29.70) | 25.90 ± 2.20 (22.86 – 30.91) | 23 – 26 |
| c | 23.73 ± 2.92 (18.79 – 27.13) | 43 ± 5.99 (31 – 51) | 48 ± 10.55 (35 – 74) | 25.93 ± 4.10 (19.20 – 31.50) | 28.09 ± 3.00 (21.82 – 32.94) | 27 – 34 |
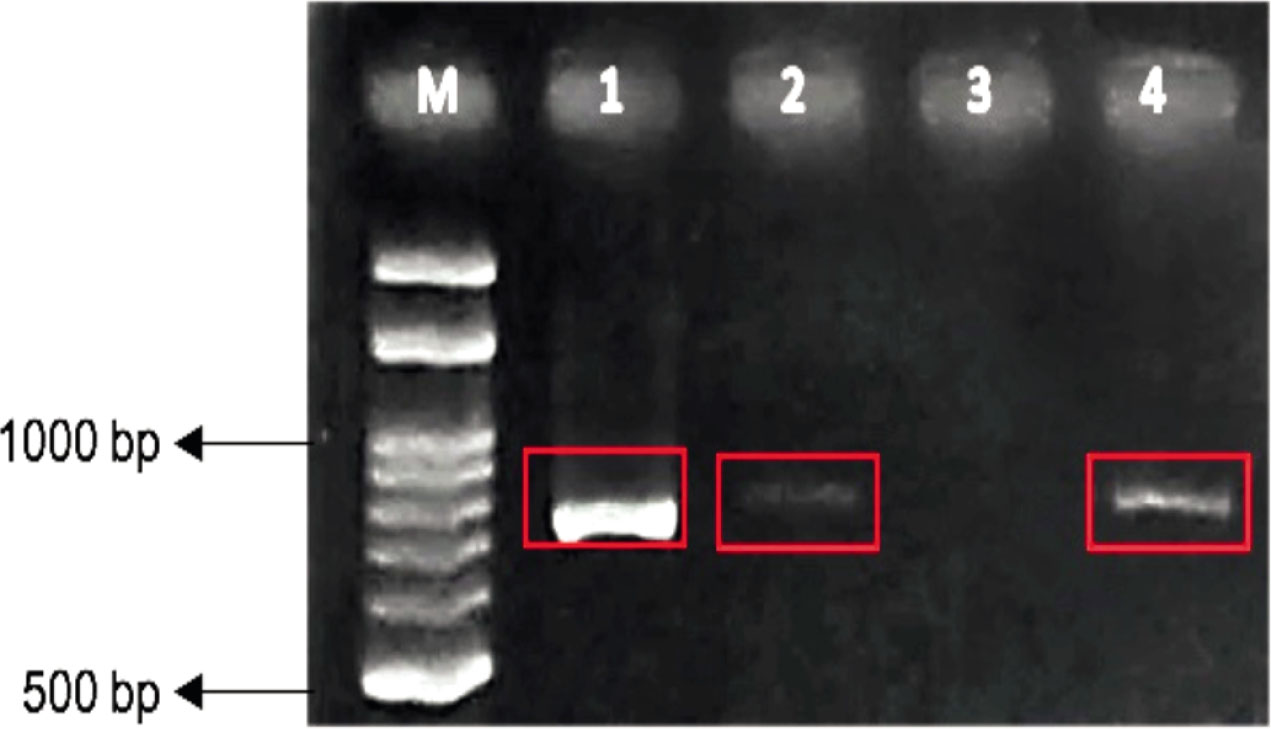
Fig. 4.
Visualization PCR electrophoresis (M) Marker (DNA ladder 100 bp; (1) H. erythrinae; (2) A. varicaudatus; (3) negative control; (4) positive control (Meloidogyne graminicola)
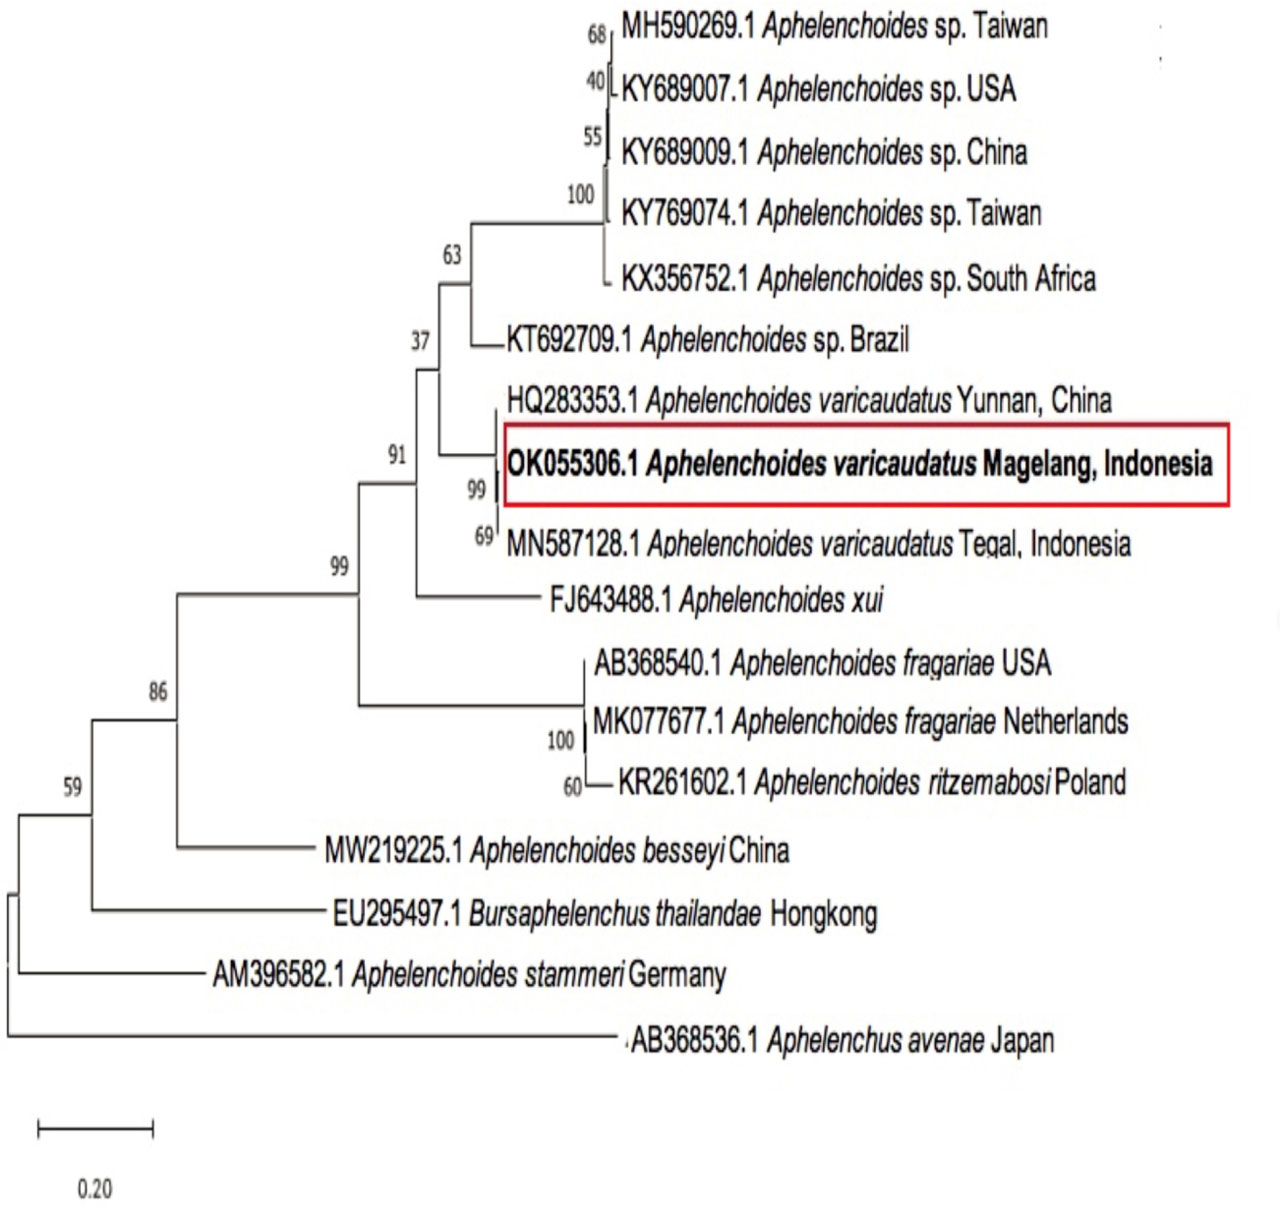
Fig. 5.
Maximum-likelihood phylogenetic tree with Hasegawa-Kishino-Yano model of Aphelenchoides spp. and other represented species based on 28S rDNA gene sequences. Substitution models with the lowest Bayesian Information Criterion (BIC) scores. Bootstrap values are shown at the nodes.
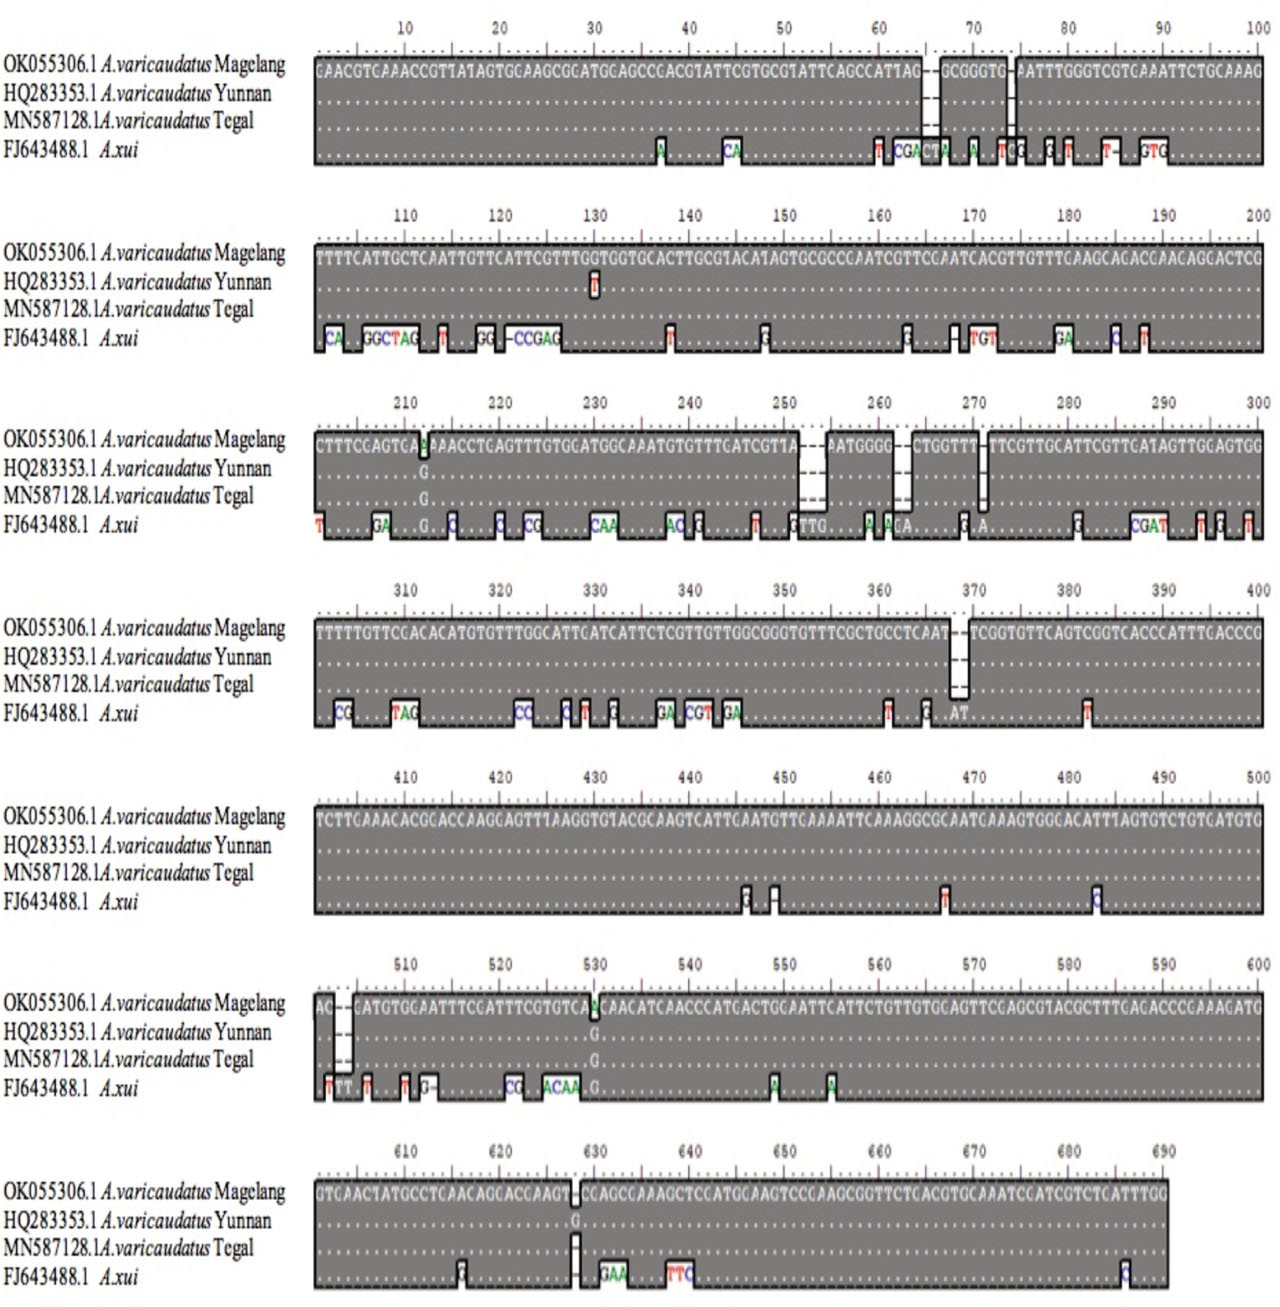
Fig. 6.
Multiple sequences alignment of Aphelenchoides varicaudatus species and Aphelenchoides xui from D2–D3 expansion region.
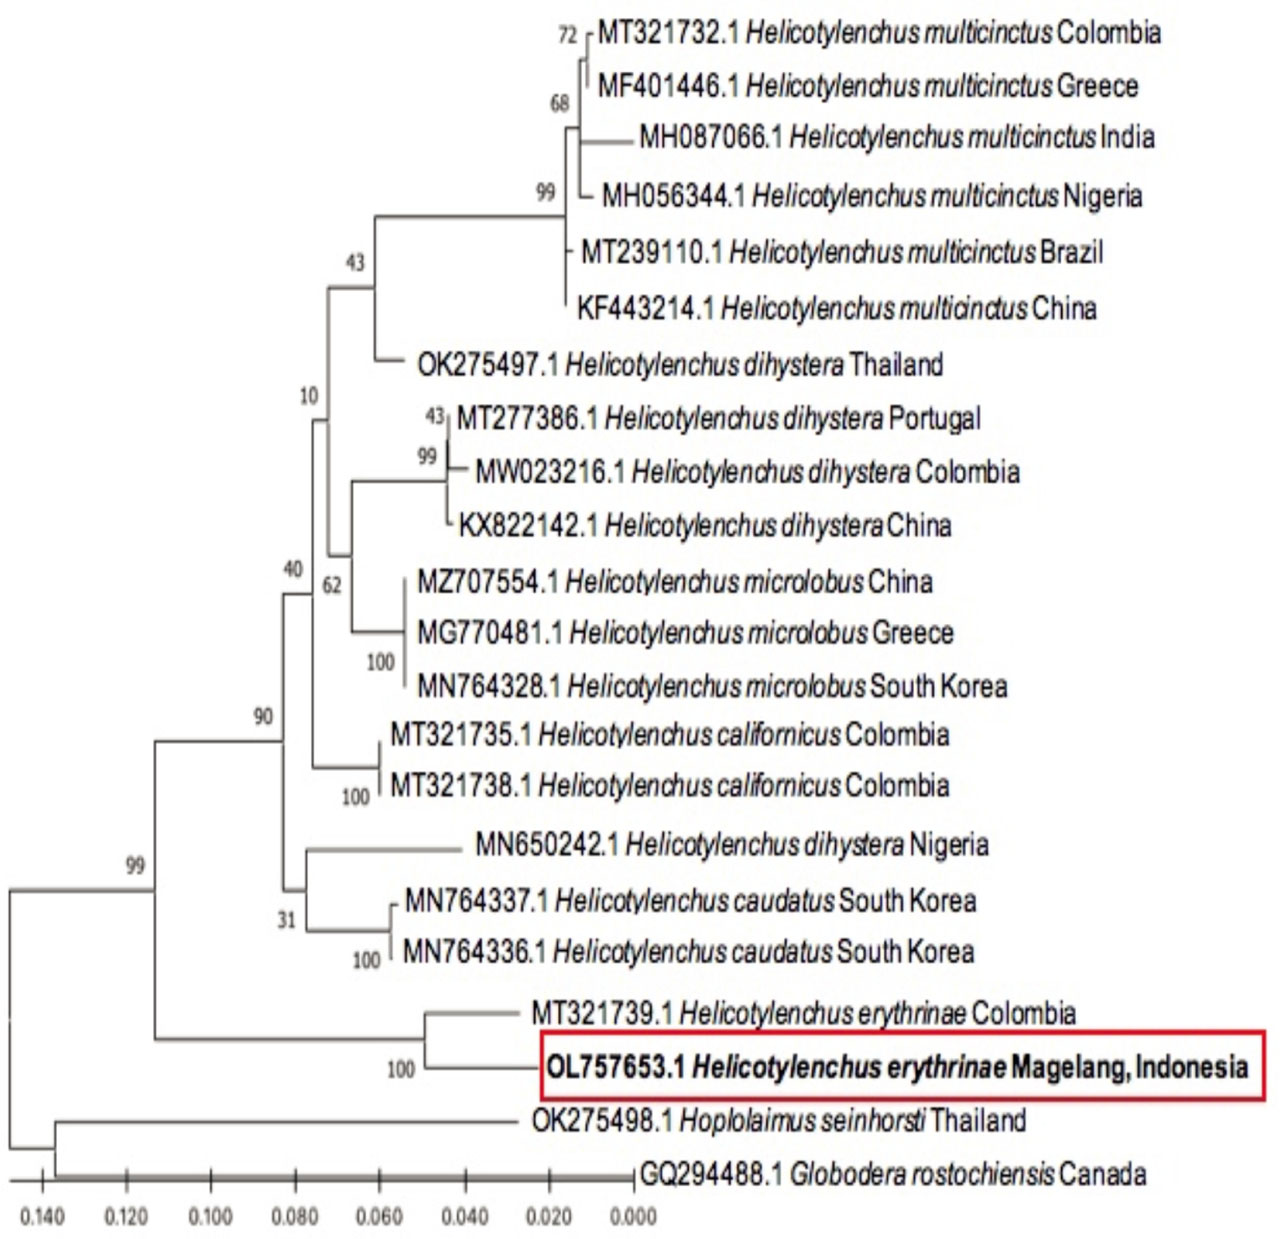
Fig. 7.
Maximum-likelihood phylogenetic tree general time-reversible model and gamma-shaped distribution (GTR+G) of Helicotylenchus spp. and other represented species based on 28S rRNA gene sequences. Substitution models with the lowest Bayesian Information Criterion (BIC) scores. Bootstrap values are shown at the nodes.
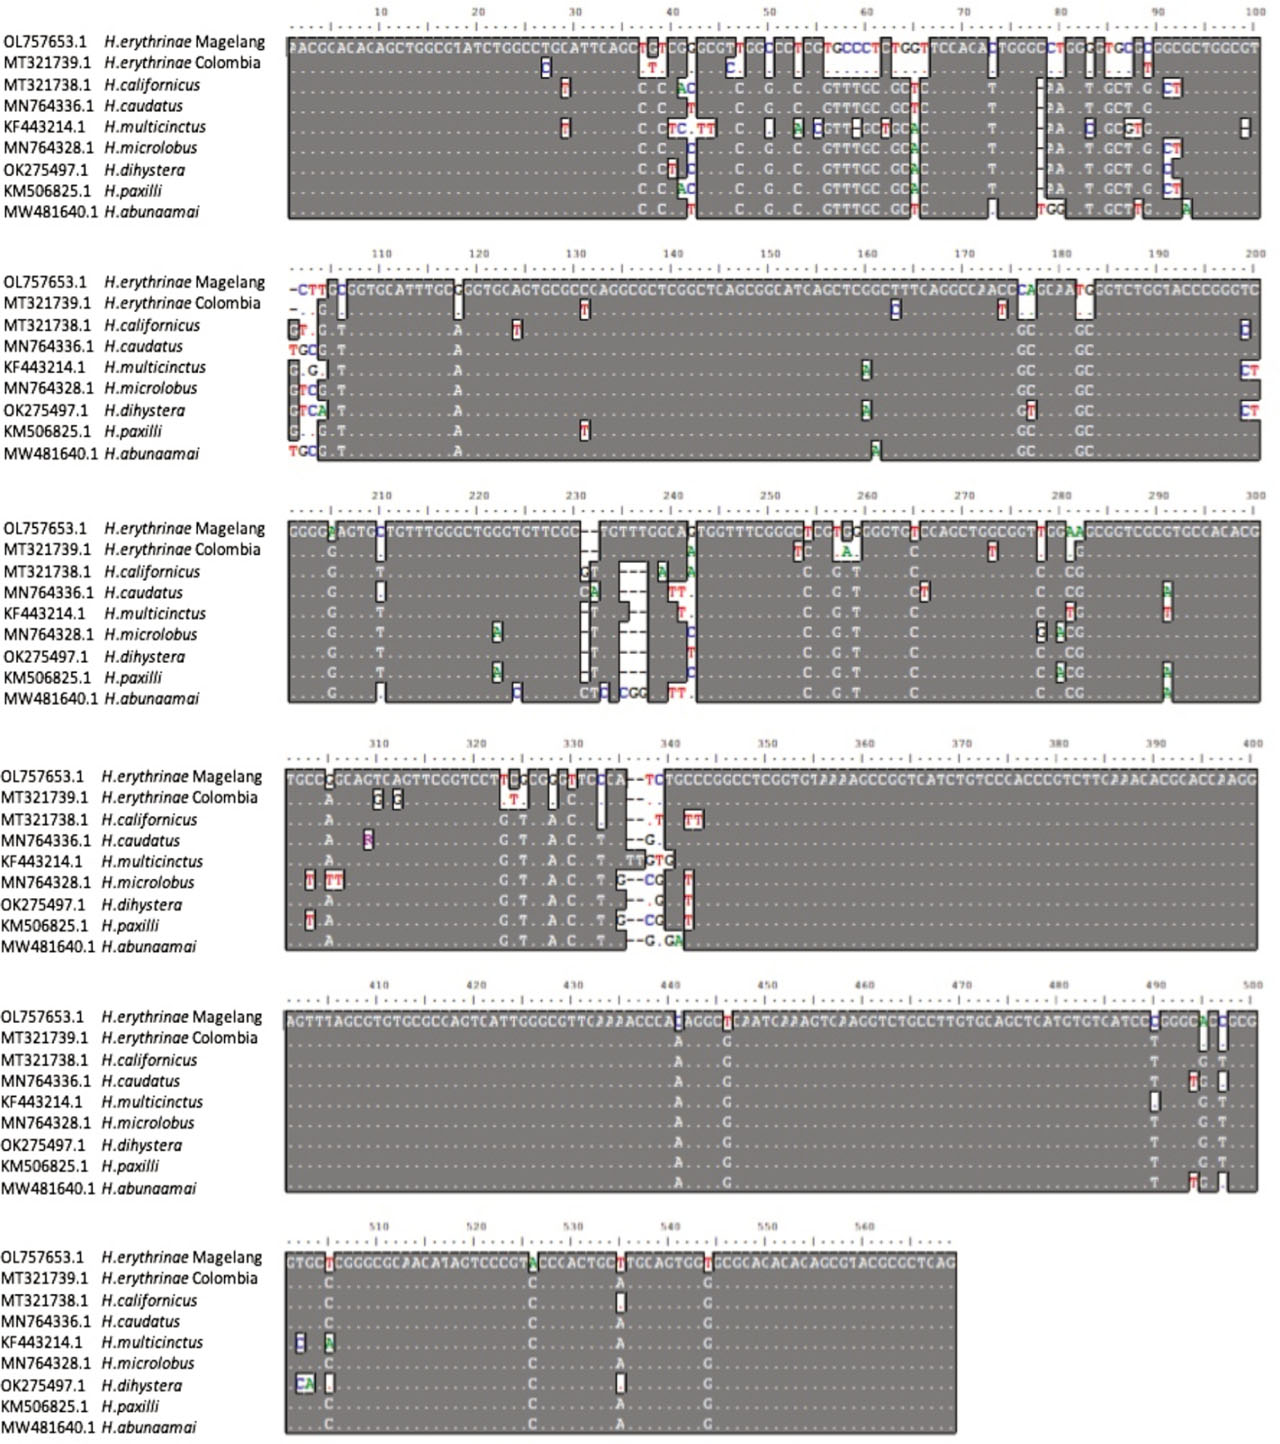
Fig. 8.
Multiple sequences alignment of Helicotylenchus species within genus from D2–D3 expansion region.