
Fig. 1
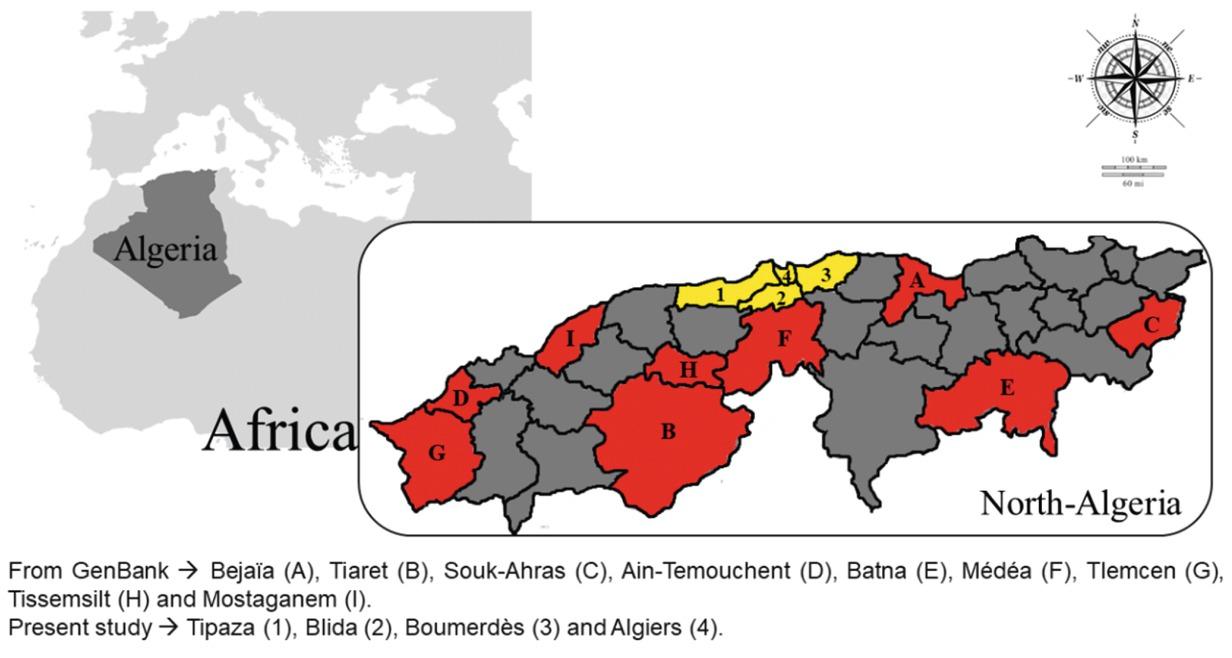
Fig. 2
Fig. 3
Fig. 4
Fig. 5
Indices of genetic variation_ The table reports the estimates of genetic variation for the mitochondrial COI gene dataset_ N: sample sizes; bp: fragment size; S: number of polymorphic sites; H: number of haplotypes; hd: haplotype diversity; π: nucleotide diversity_
| N | bp | S | H | hd | π | |
|---|---|---|---|---|---|---|
| Samples from Algeria – present study | 24 | 441 | 1 | 2 | 0.159 | 0.00036 |
| Samples from Algeria – whole dataset | 32 | 441 | 7 | 7 | 0.393 | 0.00271 |
| Total COI dataset | 187 | 441 | 42 | 32 | 0.753 | 0.00664 |
Sampling plan_ The table reports data on the sampling collection, the GenBank accession numbers of the sequences obtained in the present study, and the haplotypes (Hap_ type) found among individuals_ The unique allelic variant isolated for the ITS fragment in all the samples analysed in the present study was deposited in GenBank under the accession number MZ292402_ The presence of an identical host code for different samples indicates that flukes were isolated from the same host_
| Sample code | Host code | Area | Site | Host | Sampling date | GenBank COI # | Hap. type |
|---|---|---|---|---|---|---|---|
| C1_142 | 142 | Algeria | Tipaza | Cattle | 03-29-2016 | MT920965 | 2 |
| C2_142 | 142 | Algeria | Tipaza | Cattle | 03-29-2016 | MT920966 | 1 |
| C1_170 | 170 | Algeria | Tipaza | Cattle | 04-06-2016 | MT920980 | 1 |
| C1_858 | 858 | Algeria | Blida | Cattle | 10-03-2016 | MT920969 | 1 |
| C2_858 | 858 | Algeria | Blida | Cattle | 10-03-2016 | MT920970 | 1 |
| C1_903 | 903 | Algeria | Boumerdes | Cattle | 10-10-2016 | MT920978 | 1 |
| C1_995 | 995 | Algeria | Algiers | Cattle | 11-02-2016 | MT920967 | 1 |
| C2_995 | 995 | Algeria | Algiers | Cattle | 11-02-2016 | MT920968 | 2 |
| C1_1000 | 1000 | Algeria | Algiers | Cattle | 11-02-2016 | MT920974 | 1 |
| C2_1000 | 1000 | Algeria | Algiers | Cattle | 11-02-2016 | MT920975 | 1 |
| C1_1110 | 1110 | Algeria | Boumerdes | Cattle | 11-26-2016 | MT920982 | 1 |
| C1_1211 | 1211 | Algeria | Algiers | Cattle | 12-31-2016 | MT920976 | 1 |
| C2_1211 | 1211 | Algeria | Algiers | Cattle | 12-31-2016 | MT920977 | 1 |
| C1_1215 | 1215 | Algeria | Algiers | Cattle | 12-31-2016 | MT920981 | 1 |
| C1_1230 | 1230 | Algeria | Algiers | Cattle | 12-31-2016 | MT920983 | 1 |
| C2_1230 | 1230 | Algeria | Algiers | Cattle | 12-31-2016 | MT920984 | 1 |
| C3_1230 | 1230 | Algeria | Algiers | Cattle | 12-31-2016 | MT920985 | 1 |
| C4_1230 | 1230 | Algeria | Algiers | Cattle | 12-31-2016 | MT920986 | 1 |
| C5_1230 | 1230 | Algeria | Algiers | Cattle | 12-31-2016 | MT920987 | 1 |
| C6_1230 | 1230 | Algeria | Algiers | Cattle | 12-31-2016 | MT920988 | 1 |
| C1_1279 | 1279 | Algeria | Algiers | Cattle | 01-18-2017 | MT920979 | 1 |
| C1_1342 | 1342 | Algeria | Algiers | Cattle | 02-04-2017 | MT920971 | 1 |
| C2_1342 | 1342 | Algeria | Algiers | Cattle | 02-04-2017 | MT920972 | 1 |
| C4_1342 | 1342 | Algeria | Algiers | Cattle | 02-04-2017 | MT920973 | 1 |
| FHLAC1 | LAC | Italy | Laconi | Cattle | 12-09-2013 | MT920989 | 1 |
| FHLAC2 | LAC | Italy | Laconi | Cattle | 12-09-2013 | MT920990 | 1 |
| FHLAC3 | LAC | Italy | Laconi | Cattle | 12-09-2013 | MT920991 | 1 |
| FHLAC4 | LAC | Italy | Laconi | Cattle | 12-09-2013 | MT920992 | 1 |
| FHLAC5 | LAC | Italy | Laconi | Cattle | 12-09-2013 | MT920993 | 1 |
| FHLAC6 | LAC | Italy | Laconi | Cattle | 12-09-2013 | MT920994 | 1 |
| FHLAC7 | LAC | Italy | Laconi | Cattle | 12-09-2013 | MT920995 | 1 |
| FHLAC8 | LAC | Italy | Laconi | Cattle | 12-09-2013 | MT920996 | 1 |
| FHGIA1 | GIA | Italy | Giara di Genoni | Goat | 11-28-2013 | MT920997 | 1 |
| FHGIA2 | GIA | Italy | Giara di Genoni | Goat | 11-28-2013 | MT920998 | 1 |
| FHGIA3 | GIA | Italy | Giara di Genoni | Goat | 11-28-2013 | MT920999 | 1 |
| FHGIA4 | GIA | Italy | Giara di Genoni | Goat | 11-28-2013 | MT921000 | 1 |
| FHGIA5 | GIA | Italy | Giara di Genoni | Goat | 11-28-2013 | MT921001 | 1 |
| FHGIA6 | GIA | Italy | Giara di Genoni | Goat | 11-28-2013 | MT921002 | 1 |
| FHGIA7 | GIA | Italy | Giara di Genoni | Goat | 11-28-2013 | MT921003 | 1 |
| FHGIA8 | GIA | Italy | Giara di Genoni | Goat | 11-28-2013 | MT921004 | 1 |