
Fig. 1
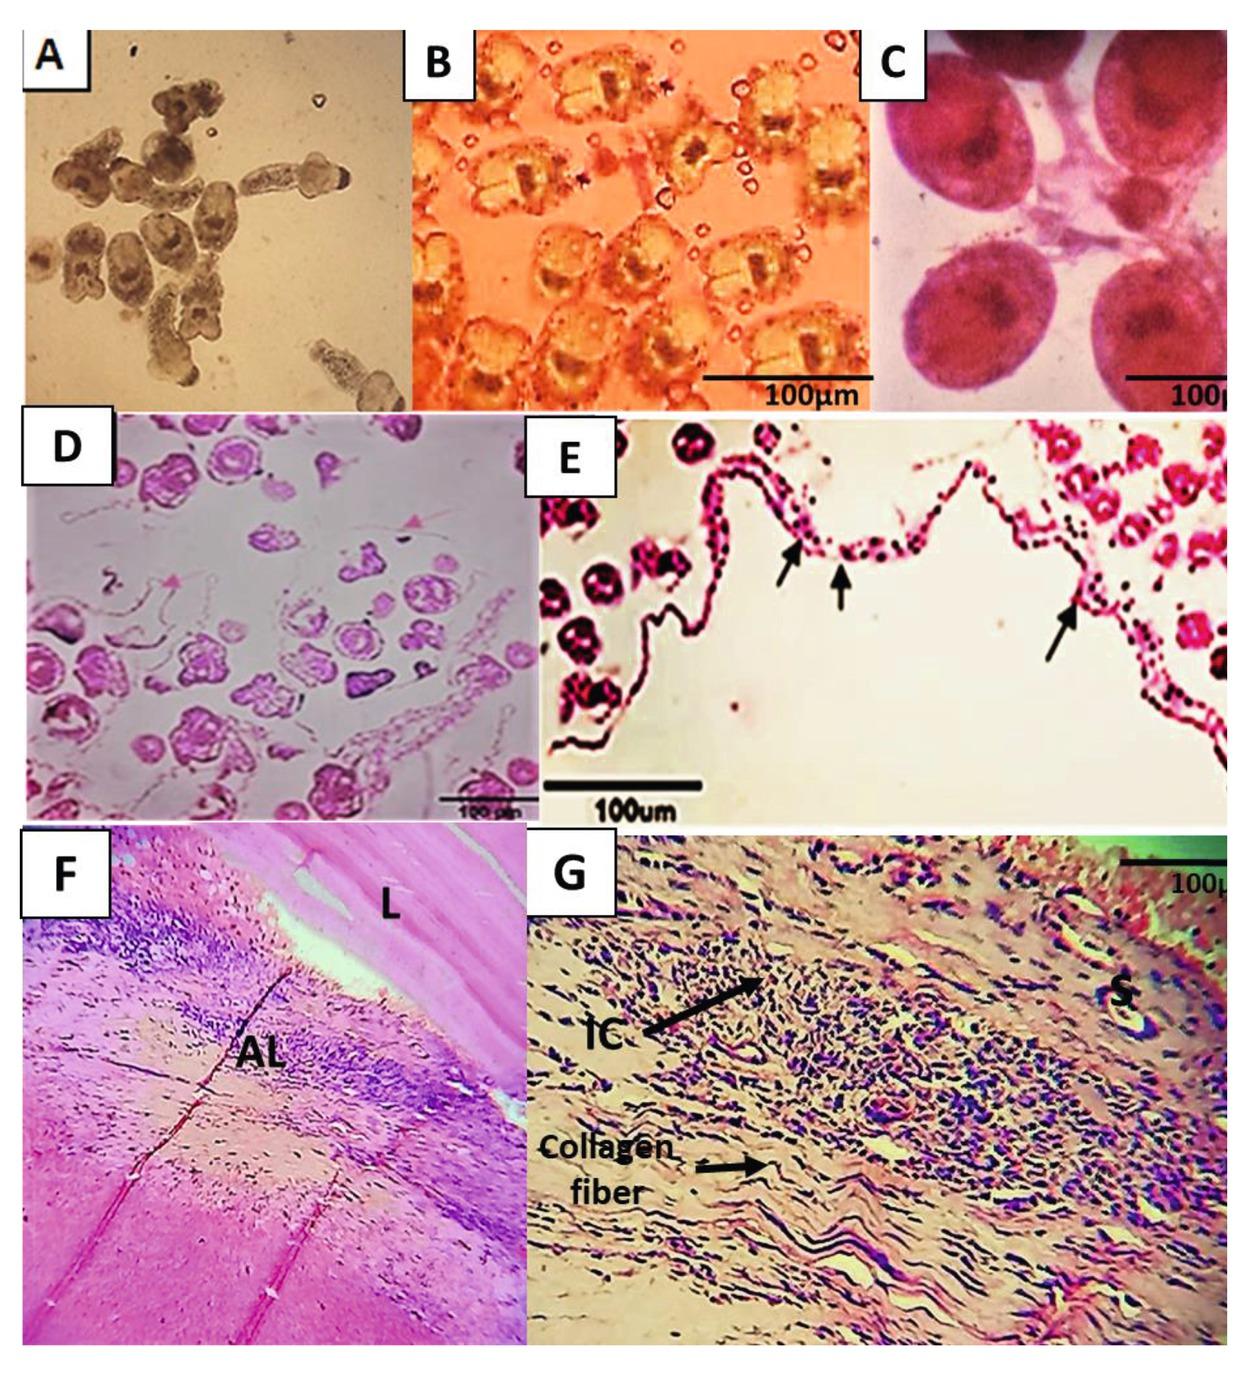
Fig. 2
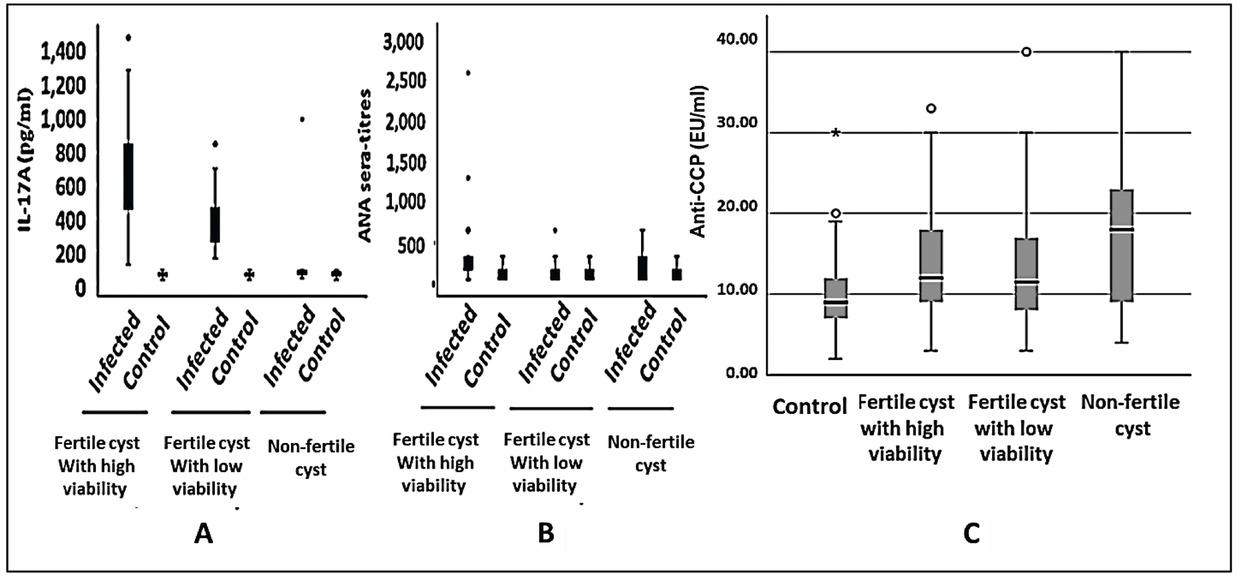
Fig. 3
Fig. 4
Fig. 5
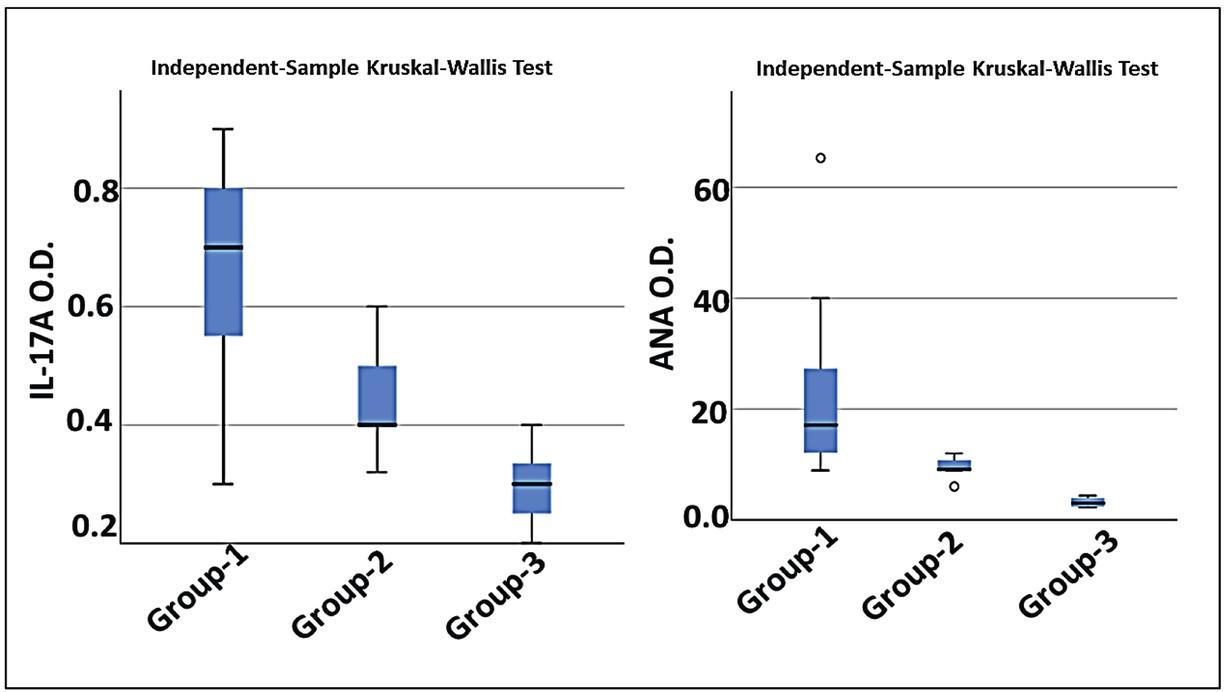
Fig. 6
Distribution of patients into three groups based on fertility rate of hydatid cysts in the current study_
| No of group, n=63 | Type of cysts | Mean value ± SD of protoscoleces | Mean value ± SD of brood capsules | |
|---|---|---|---|---|
| Solitary cysts | Multivesicular cysts | |||
| Group-1, n=22 | 13(59.0%) | 13(59%) | 1020.45± 479.22 | 18.82±9.28 |
| Group-2, n=26 | 18(70%) | 8(30%) | 498.08 ± 232.16 | 18.65±8.78 |
| Group-3, n=15 | 14(93%) | 1(7%) | 0 | 0 |
Mean±S_D_ plasma concentrations of ANA and anti-CCP antibodies in each of the three groups of cystic echinococcosis patients versus their infection- free controls
| Category of patients | Autoimmune- population | Mean±SD of diseased group | Mean±SD of control group | p -value |
|---|---|---|---|---|
| Group-1 | ANA | 405.45±589.99 | 120.00±92.38 | 0.001 |
| anti-CCP | 14.14±7.71 | 11.32±6.52 | 0.109 | |
| Group- 2 | ANA | 158.46±171.76 | 27.12 ±88.31 | 0.063 |
| anti-CCP | 45.12 ±8.09 | 10.58 ±6.31 | 0.291 | |
| Group- 3 | ANA | 218.67 ± 206.67 | 37.73 ±23.72 | 0.084 |
| anti-CCP | 74.47 ± 14.59 | 12.60 ± 9.14 | 0.209 |
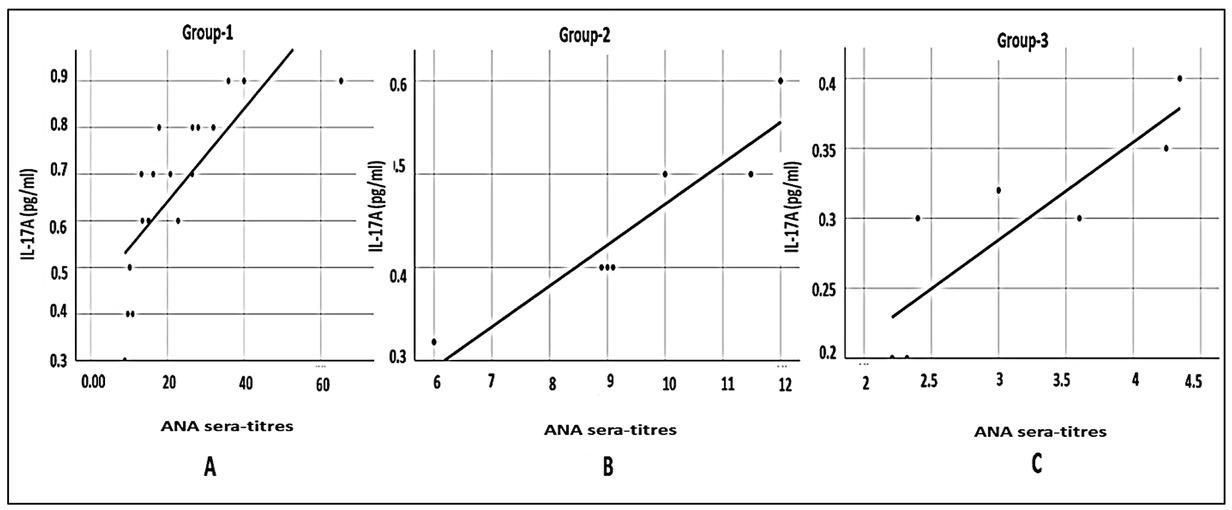
Spearman coefficient of IL-17A plasma levels with autoimmune populations_
| Patient groups | ANA autoimmune population sera titres | Anti-CCP autoimmune population sera titres | |||
|---|---|---|---|---|---|
| Spearman rho-value | p value | Spearman rho-value | p value | ||
| Group-1 | -0.004- | 0.984 | -0.139- | 0.538 | |
| Group-2 | 0.021 | 0.919 | 0.177 | 0.388 | |
| Group-3 | 0.257 | 0.355 | 0.460 | 0.084 | |