
Fig. 1
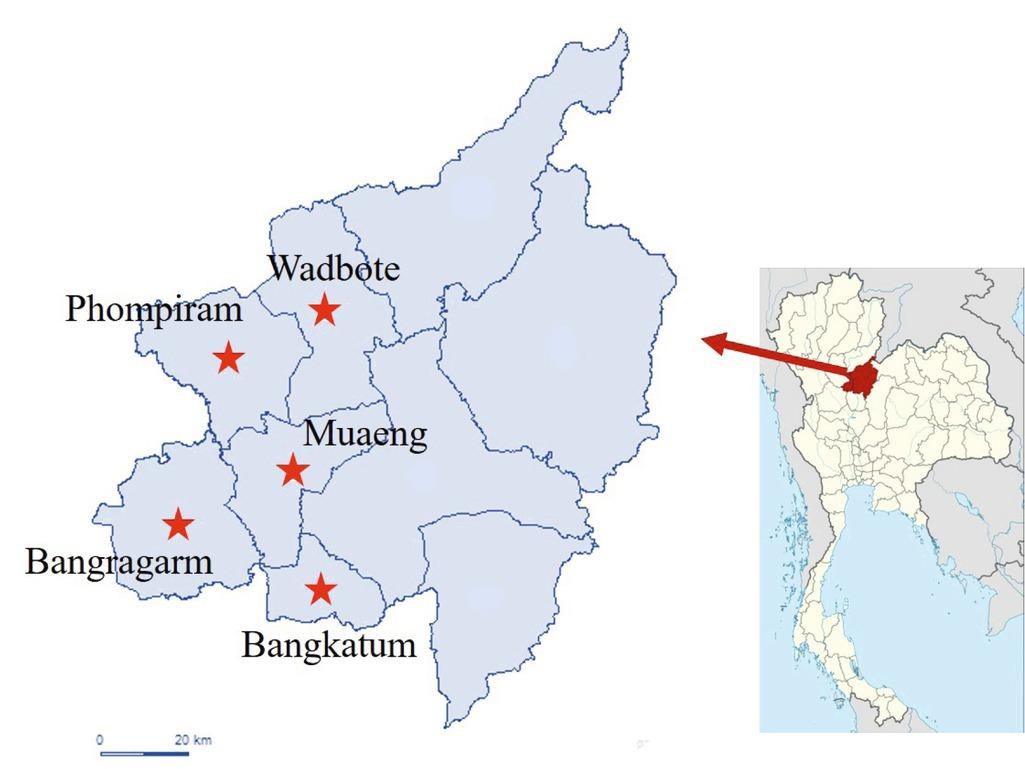
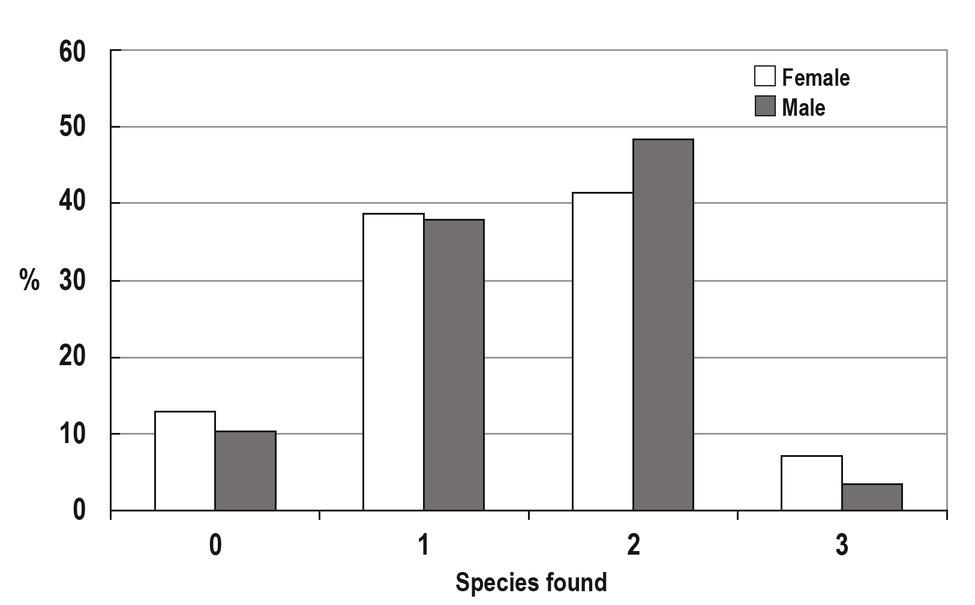
Fig. 2
Prevalence of helminth infections (percentage of infected goats) in male and female goats in Northern Thailand_
| Parasitic infection | Male | Female | X2 | P | ||||
|---|---|---|---|---|---|---|---|---|
| Total | + | % | Total | + | % | |||
| Strongyles | 29 | 24 | 82.8 | 856 | 656 | 76.6 | 0.591 | 0.442 |
| Trichuris spp. | 29 | 0 | 0 | 856 | 4 | 0.5 | 0.136 | 0.712 |
| Nematodirus spp. | 29 | 0 | 0 | 856 | 8 | 0.9 | 0.274 | 0.601 |
| Dicrocoelium dendriticum | 29 | 0 | 0 | 856 | 1 | 0.1 | 0.034 | 0.854 |
| Eimeria spp. | 29 | 15 | 51.7 | 856 | 430 | 50.2 | 0.025 | 0.875 |
| Moniezia spp. | 29 | 3 | 10.3 | 856 | 129 | 15.1 | 0.494 | 0.482 |
| Others (Strongyloides spp.) | 29 | 0 | 0 | 856 | 6 | 0.7 | 0.205 | 0.651 |
Third-stage strongylid larvae identified in coprocultures of goats (expressed as mean percentage)_
| Larval genus | Total (%) |
|---|---|
| Haemonchus contortus | 55.84 |
| Strongyloides papillosus | 20.53 |
| Teladorsagia | 5.80 |
| Bunostomum trigoncephalum | 5.00 |
| Charbertia ovina | 4.18 |
| Nematodirus spp. | 3.46 |
| Trichostrongylus spp. | 3.07 |
| Cooperia oncophora | 0.92 |
| Cooperia curticei | 0.85 |
Results from a predictive logistic regression model for parasitic infection in goats from Northern Thailand_
| Variable | Level | β | SE | Wald | OR | P-Value | 95% CI |
|---|---|---|---|---|---|---|---|
| Sex | Male | 1 | - | - | |||
| Female | -0.16 | 0.502 | 0.102 | 0.852 | 0.750 | 0.319 – 2.278 | |
| Body Condition Score | Good | 1 | - | - | |||
| Moderate | -0.853 | 0.718 | 1.412 | 0.426 | 0.235 | 0.104 – 1.740 | |
| Thin | -1.061 | 0.529 | 4.023 | 0.346 | 0.045 | 0.123 – 0.976 |
Descriptive statistics (number and percentage of positive samples and mean, SD, Min, and Max) of fecal egg/oocyte counts in goats of 31 Smallholder Farms in Thailand_
| Variables | Examined | Positive [n (%)] | Mean | SD | Min – Max |
|---|---|---|---|---|---|
| Gastrointestinal strongyles | 885 | 680 (76.8%) | 799.0 | 1348.6 | 0 – 13333 |
| Trichuris spp. | 885 | 4 (0.5%) | 0.2 | 3.4 | 0.58 |
| Nematodirus spp. | 885 | 8 (0.9%) | 0.6 | 7.1 | 0 – 104 |
| Dicrocoelium dendriticum | 885 | 1 (0.1%) | 1.5 | 1.5 | 0 – 1368 |
| Eimeria spp. | 885 | 445 (50.3%) | 427.6 | 118.1 | 0 – 96285 |
| Moniezia spp. | 885 | 132 (14.2%) | 69.5 | 20.0 | 0 – 15786 |
| Others (Strongyloides spp.) | 885 | 6 (0.7%) | 0.6 | 0.3 | 0 – 246 |
Contingency table and odds ratio results for association of explanatory variables with parasites positive for fecal eggs of goats, by parasites_
| Variables | Infected/ Examined | Prevalence (%) | 95% CI | Odds Ratio | P value |
|---|---|---|---|---|---|
| Stronglyes (%) | |||||
| Sex | 0.402 | ||||
| Female | 656/856 | 76.6 | 74.8 – 88.2 | 1.0 | |
| Male | 24/29 | 82.8 | 46.7 – 91.3 | 0.654 | |
| Body Condition Score | 0.163 | ||||
| Good | 23/30 | 76.7 | 43.2 – 87.6 | 1.0 | |
| Moderate | 613/805 | 76.1 | 73.5 – 90.3 | 0.426 | |
| Poor | 44/50 | 88.0 | 76.3 – 99.7 | 0.430 | |
| Moniezia spp.(%) | |||||
| Sex | 0.511 | ||||
| Female | 129/856 | 15.1 | 10.4 – 21.8 | 1.0 | |
| Male | 3/29 | 2.3 | 1.3 – 24.9 | 0.650 | |
| Body Condition Score | 0.828 | ||||
| Good | 4/30 | 13.3 | 11.1 – 26.5 | 1.0 | |
| Moderate | 119/805 | 14.8 | 6.3 – 20.6 | 0.735 | |
| Poor | 9/50 | 18.0 | 8.1 – 27.9 | 0.799 | |
| Eimeria spp. (%) | |||||
| Sex | 0.895 | ||||
| Female | 430/856 | 50.2 | 50.2 – 66.2 | 1.0 | |
| Male | 15/29 | 51.7 | 14.2 – 66.8 | 0.895 | |
| Body Condition Score | 0.009 | ||||
| good | 15/30 | 50.0b | 13.2 – 65.7 | 1.0 | |
| Moderate | 394/805 | 48.9b | 42.4 – 62.3 | 0.383 | |
| Thin | 36/50 | 72.0a | 58.2 – 85.8 | 0.372 |
Results of the fecal egg (expressed as eggs per gram, EPG) and oocyst (expressed as oocysts per gram, OPG) counts differentiated for the prevalence of gastrointestinal strongylid nematodes (GIN) (classified as negative, low, moderate and high), separated by sex and species ( expressed as % within sex or body condition score)_
| Sex | Body condition score | Total | ||||
|---|---|---|---|---|---|---|
| Male | Female | Poor | Moderate | Good | ||
| Gastrointestinal strongylid | nematodes | (GIN) | ||||
| Mean FECc | 455.5 ± 132.8b | 810.7 ± 46.6a | 1603.3 ± 287.2A | 751.3 ± 45.4B | 738.5 ± 202.78B | 802.1 ± 45.4 |
| Negative | 17.2 | 22.8 | 12.0 | 23.2 | 23.3 | 22.6 |
| Low (< 500 EPG) | 51.7 | 38.3 | 38.0 | 38.8 | 40.0 | 38.8 |
| Moderate (500 – 1000 EPG) | 17.2 | 13.6 | 6.0 | 14.0 | 16.7 | 13.7 |
| High (> 1000 EPG) | 13.8 | 25.4 | 44.0 | 24.0 | 20.0 | 25.0 |
| Eimeria spp. | ||||||
| Mean FOCc | 591.1 ± 245.1 | 422.0 ± 121.8 | 172.8 ± 118.1 | 412.8 ± 124.9 | 1248.9 ± 945.8 | 427.6 ± 118.1 |
| Negative | 48.3 | 49.5 | 28.0 | 50.8 | 50.0 | 49.5 |
| Low (< 1800 OPG) | 37.9 | 47.0 | 72.0 | 45.2 | 43.3 | 46.7 |
| Moderate (1800 – 6000 OPG) | 13.8 | 2.7 | 0 | 3.2 | 3.3 | 3.1 |
| High (> 6000 OPG) | 0 | 0.8 | 0 | 0.7 | 3.3 | 0.8 |