
Table 1
Zinc contents in feed.
| Experimental group | Number of animals | Infection tapeworm | Zinc dose (mg/25 g food) | Zinc dose/week (mg) |
|---|---|---|---|---|
| 00 | 6 | - | 1.75 | 10.5 |
| 0T | 6 | + | 1.75 | 10.5 |
| M0 | 6 | - | 20.5 | 123 |
| MT | 6 | + | 20.5 | 123 |
Table 2
Composition of ST-1 (commercially available from Velaz Ltd. CR).
| Moisture (%) | 12.5 |
| Nitrogen compounds (%) | 24 |
| Fiber (%) | 4.4 |
| Lipids (%) | 3.4 |
| Ash (%) | 6.8 |
| Lysin (mg/kg) | 14 000 |
| Methionine (mg/kg) | 4 800 |
| Ca (mg/kg) | 11 000 |
| P (mg/kg) | 7 200 |
| Na (mg/kg) | 1 800 |
| Cu (mg/kg) | 20 |
| Zn (mg/kg) | 70 |
| Se (mg/kg) | 0.38 |
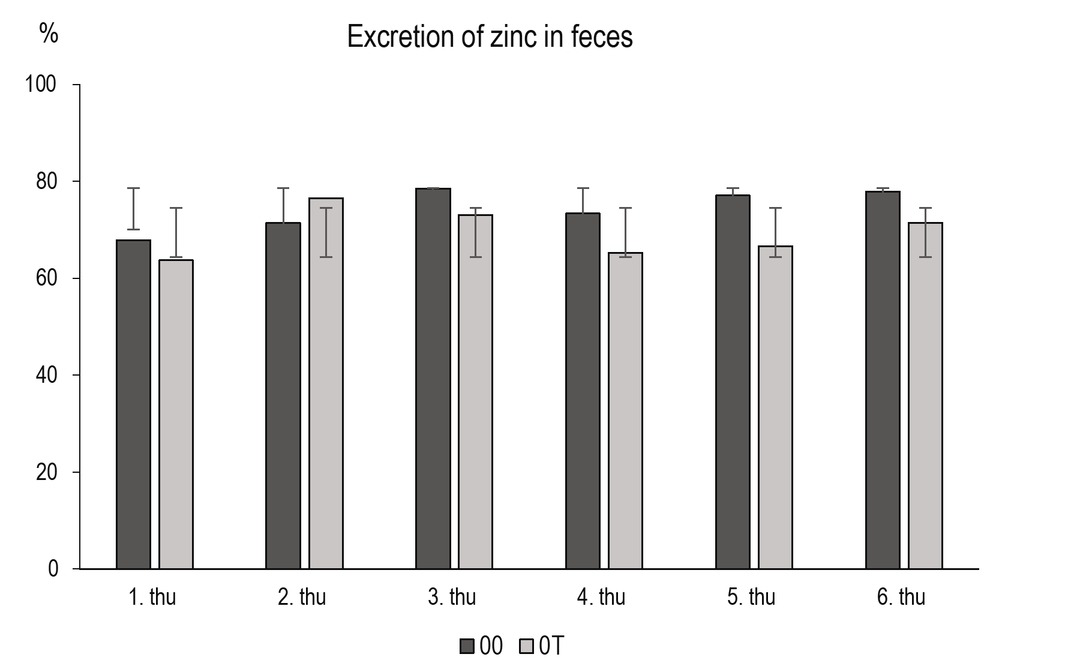
Fig. 1
A comparison of Zn excretion rates (%) in the feces of uninfected control rats (00) and those of control rats (0T) infected with tapeworms (Hymenolepis diminuta). thu, Thursday (samples were taken every Thursday)
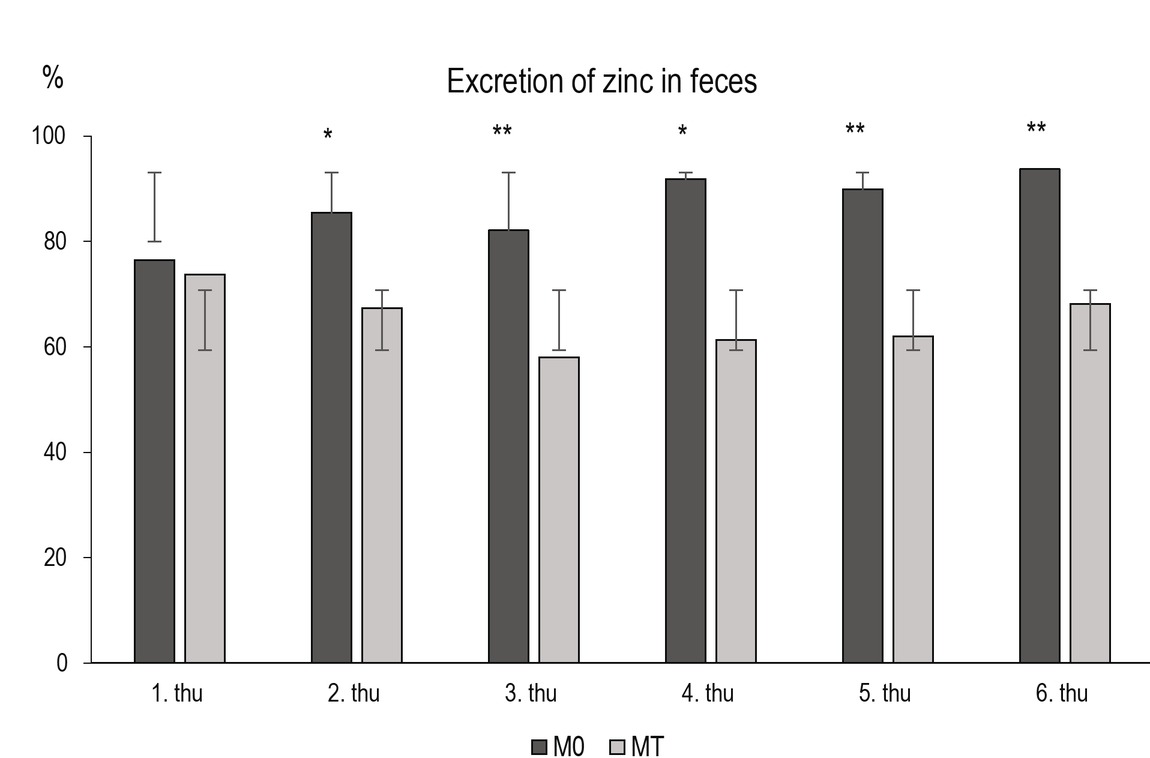
Fig. 2
A comparison between Zn excretion rates (%) in the feces of rats from group M0 (uninfected and fed Zinc lactate) and those of rats from group PT
(tapeworm-infected and fed Zinc lactate).
*Statistically significant difference between groups M0 a MT, p < 0.05;
**Statistically significant difference between groups M0 a MT, p < 0.01;
thu, Thursday (samples were taken every Thursday)