
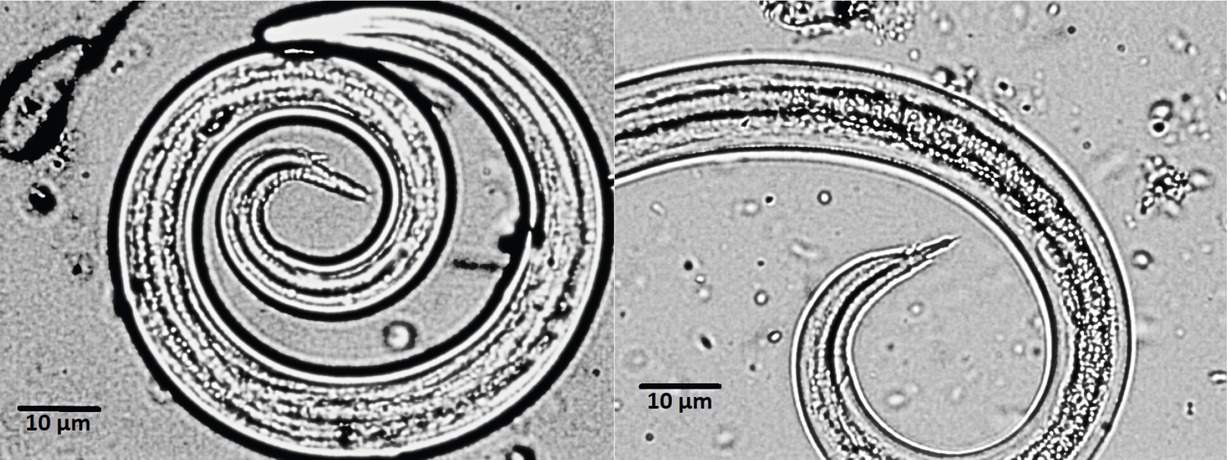
Fig. 1
Protostrongylid L.1 larvae patterns recovered from antelopes, Muellerius capillaris (left) and Neostrongylus linearis (right), showing the morphological characteristics of the tail.
Table 1
Prevalence rates and LPG values extracted from feces of each species of Protostrongylids for the three populations of antelopes.
| Addax (n = 60) | Gazelle (n = 60) | Oryx (n = 60) | ||||
|---|---|---|---|---|---|---|
| M. capillaris | N. linearis | M. capillaris | N. linearis | M. capillaris | N. linearis | |
| LPG Mean | 92.94 | 6.02 | 133.09 | 1.37 | 1.48 | 32.81 |
| LPG Max | 542 | 40 | 951.7 | 20 | 20 | 838.4 |
| LPG Min | 0 | 0 | 0 | 0 | 0 | 0 |
| Standard error | 13.42 | 1.70 | 23.09 | 0.44 | 0.50 | 13.99 |
| Prevalence % | 98.40 | 60.00 | 96.70 | 23,40 | 28.40 | 90,00 |
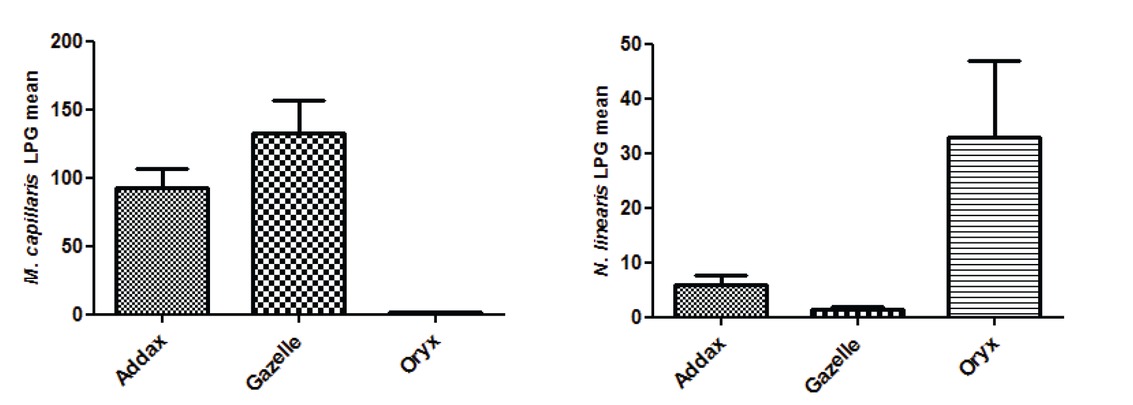
Fig. 2
Comparative LPG means in the all three antelopes for Muellerius capillaris (left) and Neostrongylus linearis (right).
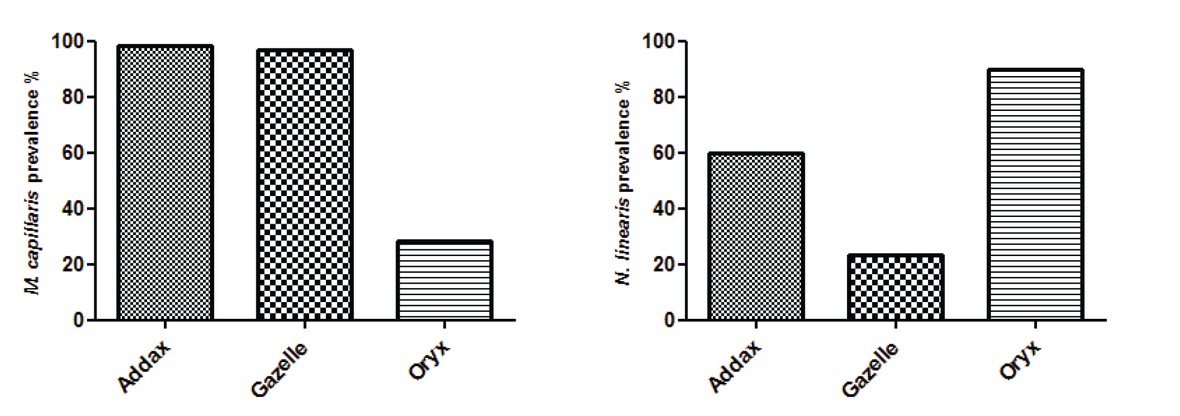
Fig. 3
Comparative prevalence rates across the three antelopes for Muellerius capillaris (left) and Neostrongylus linearis (right).
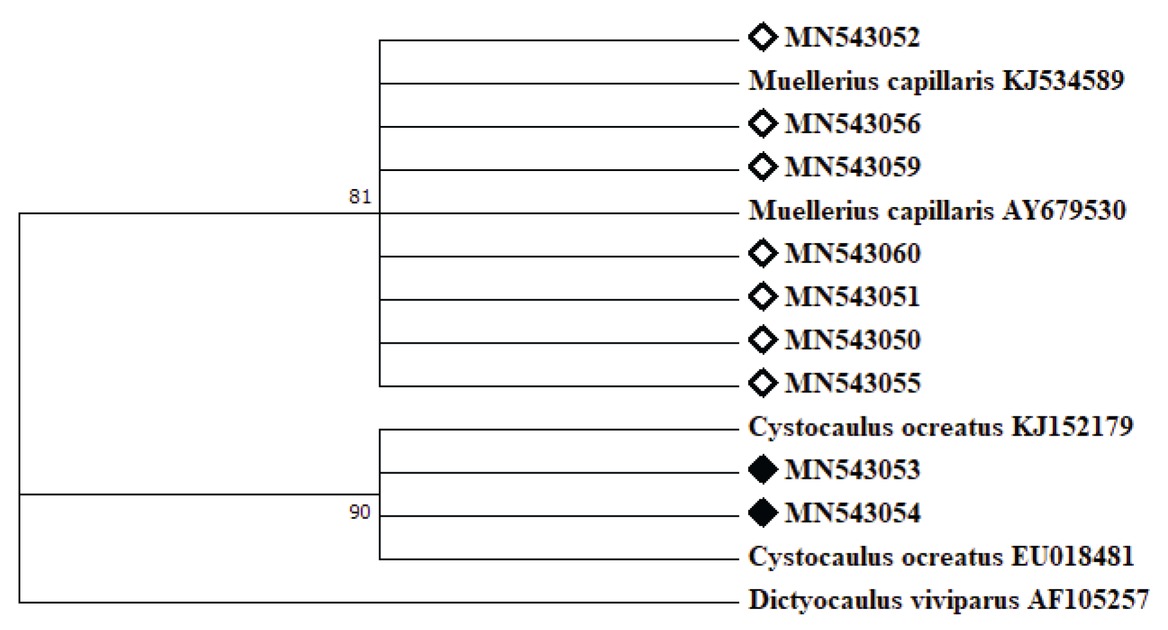
Fig. 4
The condensed phylogenetic relationships of Protostrongylids based on ITS-2 sequences of the rDNA, using the Neighbor-Joining method with the Tamura 3-parameter method. The percentages of replicate trees in the bootstrap test (1000 replicates) are shown next to the branches. The analysis involved 14 rDNA ITS-2 nucleotide sequences (5 from antelopes, 4 from local sheep and 5 from Genbank). Evolutionary analyses were conducted in MEGA7.
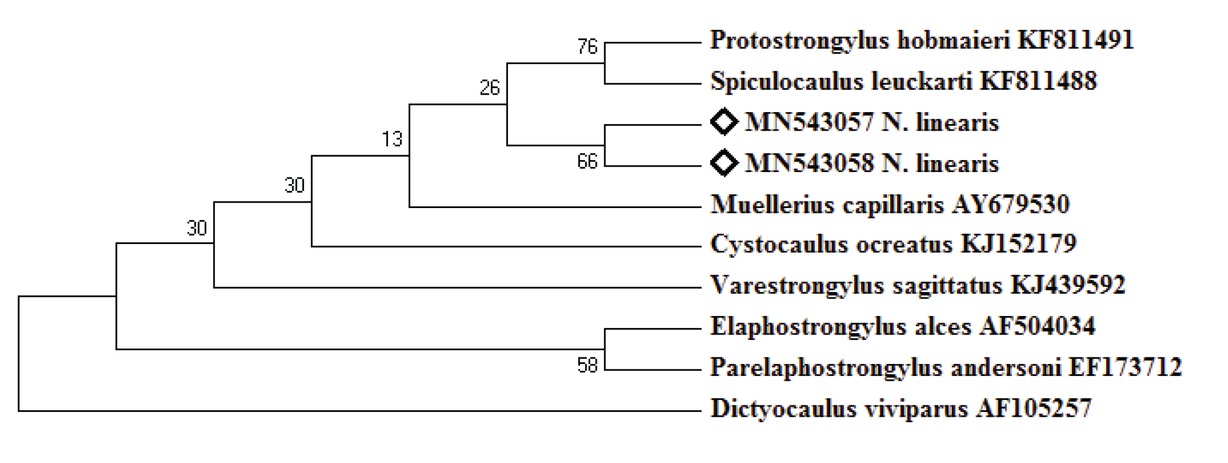
Fig. 5
The phylogenetic relationships showing topology of Protostrongylids using the Neighbor-Joining method with the Tamura 3-parameter method with the bootstrap test (1000 replicates) shown next to the branches. The analysis involved 10 rDNA ITS-2 nucleotide sequences (2 from antelopes and 8 from Genbank). Evolutionary analyses were conducted in MEGA7.