
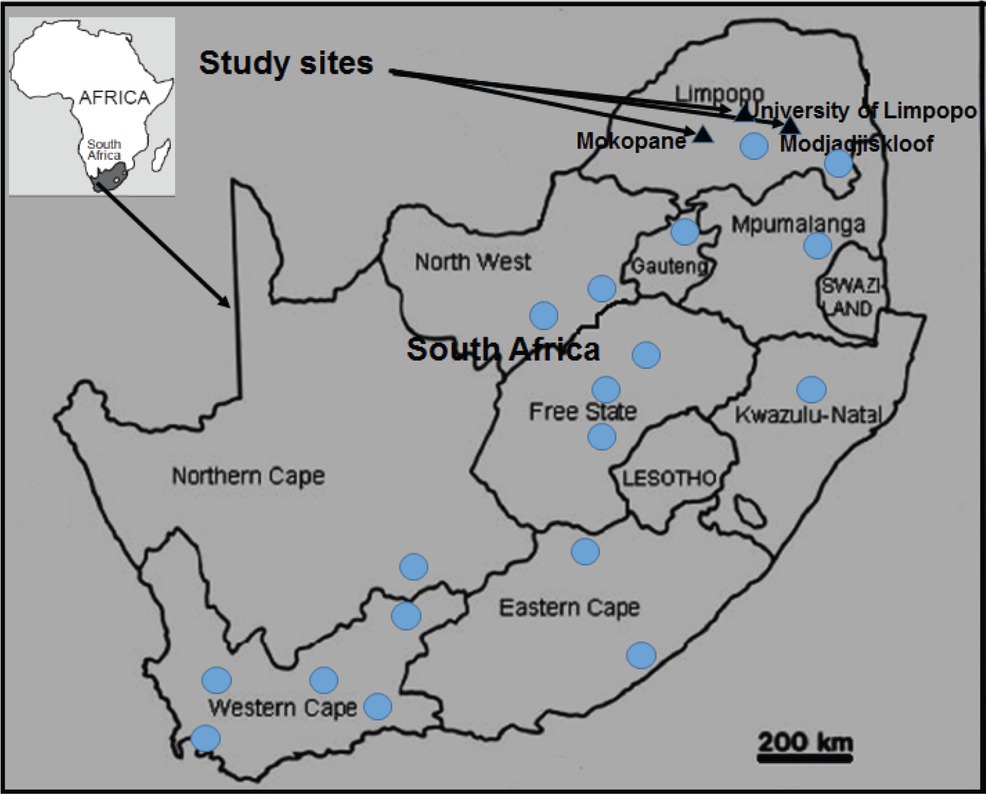
Fig. 1
Map showing the natural distribution of Xenopus laevis in South Africa (circles).
The distribution is based on De Busschere et al. (2016). Triangles indicate the sampling localities or geographical regions.
Table 1
Information on Xenopus laevis sampled at the three localities in the Limpopo Province, South Africa, during the four seasons (January 2007–October 2007).
| Locality | Season | Sex | Number | Standard length |
|---|---|---|---|---|
| examined | (mm) | |||
| Autumn | Male | 8 | 84.75 ± 9.92 | |
| Female | 10 | 88.87 ± 9.55 | ||
| Winter | Male | 10 | 87.20 ± 13.04 | |
| Modjadjiskloof | Female | 12 | 91.67 ± 9.77 | |
| Spring | Male | 11 | 91.09 ± 9.36 | |
| Female | 10 | 94.70 ± 8.46 | ||
| Summer | Male | 12 | 92.66 ± 8.46 | |
| Female | 14 | 91.29 ± 8.79 | ||
| Autumn | Male | 13 | 88.46 ± 8.51 | |
| Female | 12 | 84.16 ± 9.28 | ||
| Winter | Male | 15 | 81.80 ± 9.55 | |
| Female | 13 | 93.77 ± 6.98 | ||
| Mokopane | Spring | Male | 12 | 88.50 ± 8.94 |
| Female | 10 | 84.40 ± 8.54 | ||
| Summer | Male | 14 | 80.57 ± 6.97 | |
| Female | 16 | 86.86 ± 10.07 | ||
| Autumn | Male | 14 | 70.93 ± 4.64 | |
| Female | 11 | 73.63 ± 7.21 | ||
| Winter | Male | 10 | 73.90 ± 11.29 | |
| University of Limpopo | Female | 15 | 70.87 ± 6.13 | |
| Spring | Male | 8 | 66.94 ± 6.41 | |
| Female | 17 | 72.75 ± 6.71 | ||
| Summer | Male | 13 | 68.46 ± 5.21 | |
| Female | 12 | 71.50 ± 10.45 | ||
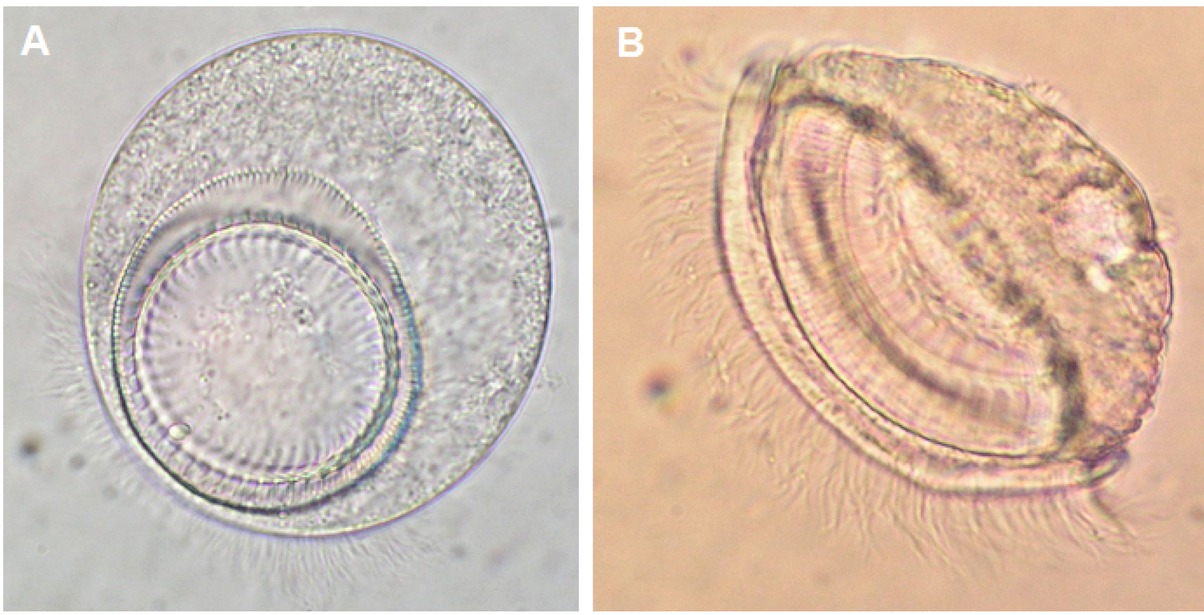
Fig. 2
Trichodina xenopodos, photomicrographs. A = Trichodina xenopodos from a wet preparation. B = T. xenopodos in a Petri-dish with saline. Scale bar: (400×)
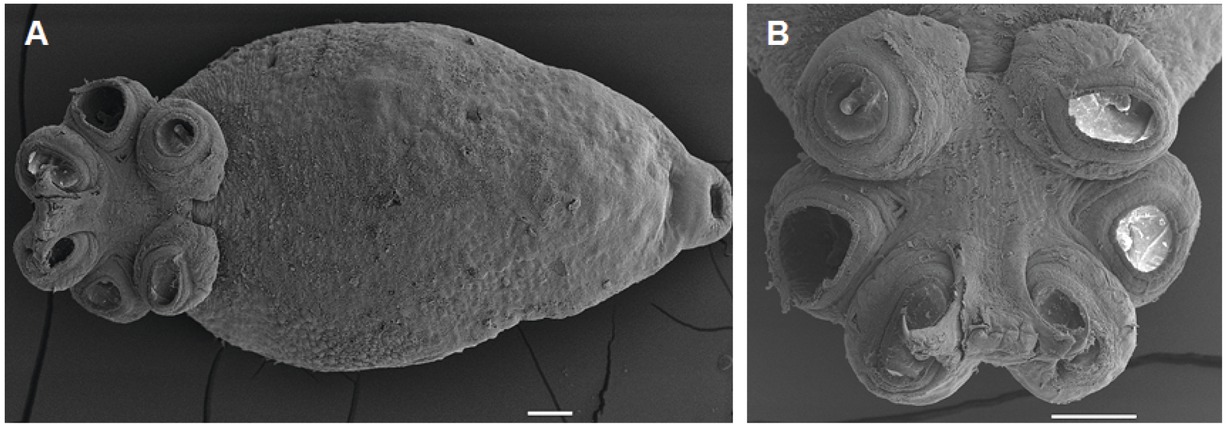
Fig. 3
Protopolystoma xenopodis, photomicrographs. A = ventral view. B = illustration suckers. Scale bar: 100 μm.
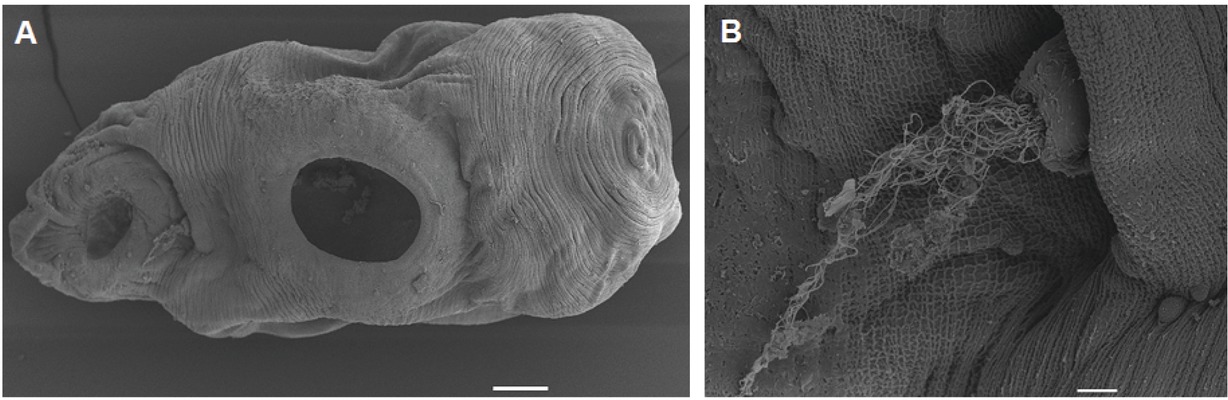
Fig. 4
Dollfuschella rodhaini, photomicrographs. A = ventral view of D. rodhaini. B = Enlarged sinus organ. Scale bar: A = 1100 μm, B = 10μm.
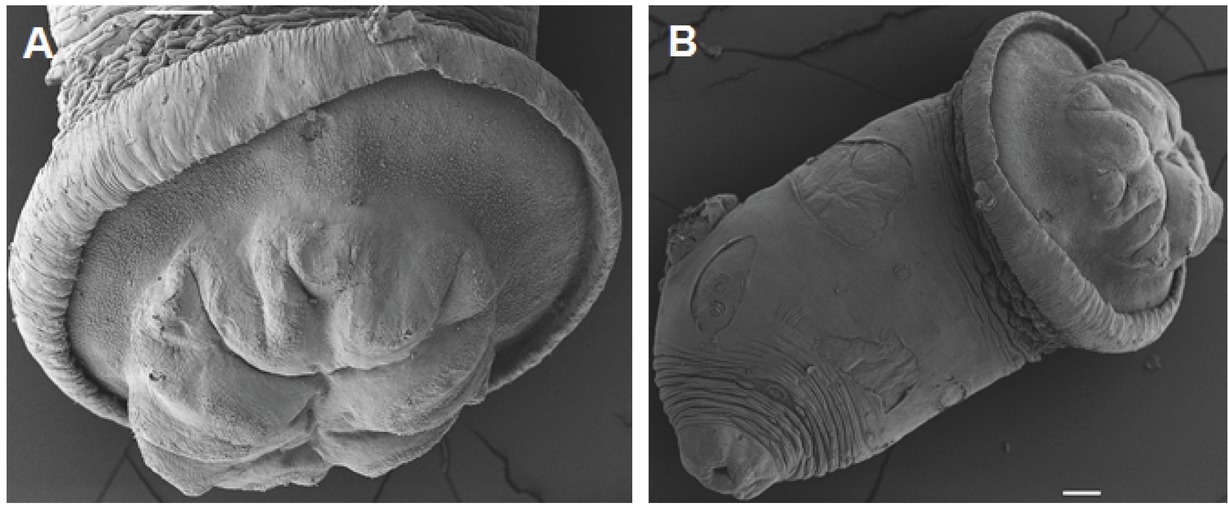
Fig. 5
Progonimodiscus doyeri, photomicrographs. A = posterior view of the large acetabulum. B = micrograph of whole body of Pd. doyeri. Scale bar: 100 μm.
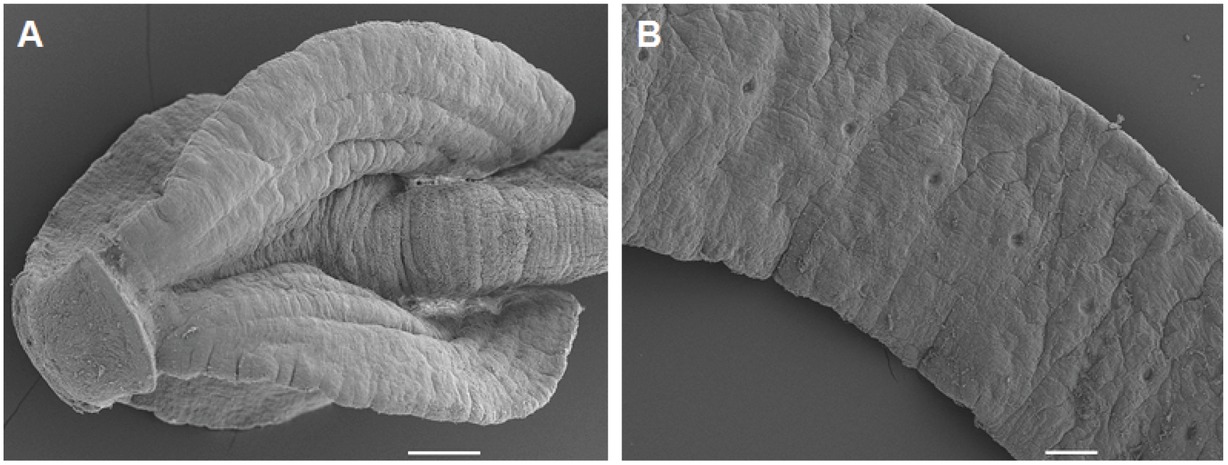
Fig. 6
Cephalochlamys namaquensis, photomicrographs. A = enlarged view of the scolex. B = micrograph showing segments and the position of gonopores. Scale bar: 100 μm.
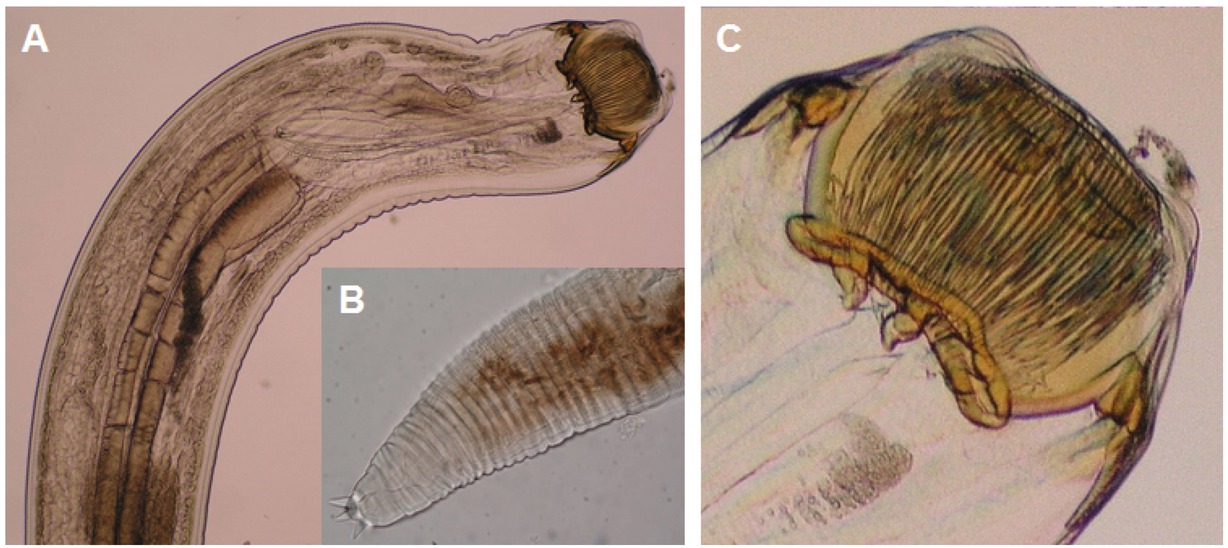
Fig. 7
Camallanus kaapstaadi, photomicrographs A = wet preparation of Cm. kaapstaadi. B = tapering tail with three mucrons.
C = enlarged buccal capsule with two large valves. Scale bar: A – B = (200x), C = (400x).
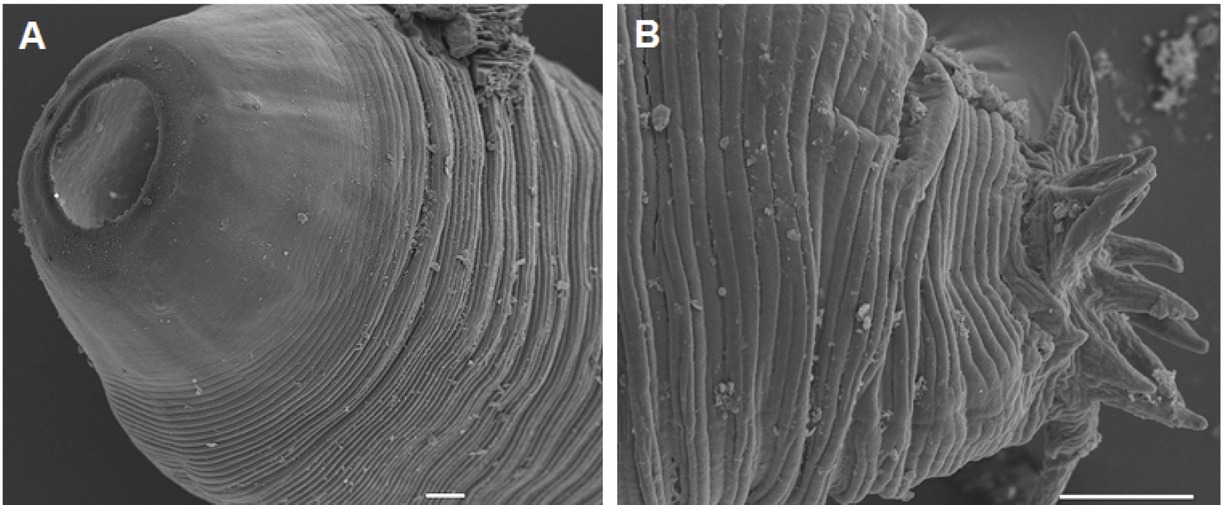
Fig. 8
Batrachocamallanus slomei, photomicrographs. A = opening of the anterior buccal capsule. B = posterior end showing mucrons.
Scale bar: A = 10 μm, B = 100 μm.
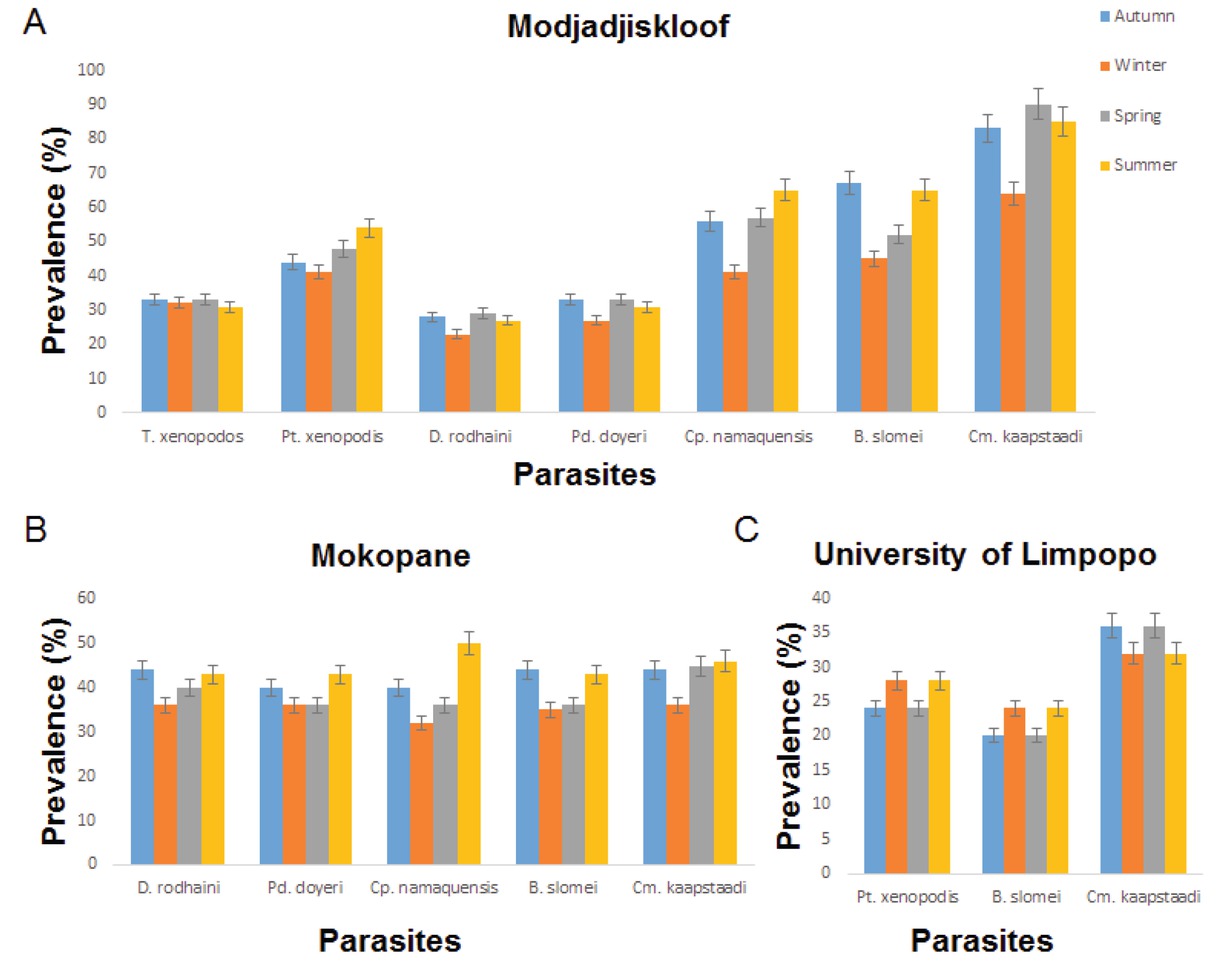
Fig. 9
Prevalence of parasites recorded from Xenopus laevis from Modjadjiskloof, Mokopane and University of Limpopo in different seasons. Key: T. xenopodos = Trichodina xenopodos, Pt. xenopodos = Protopolystoma xenopodis, D. rodhaini = Dollfuschella rodhaini, Pd. doyeri = Progonimodiscus doyeri, Cp. namaquensis = Cephalochlamys namaquensis, B. slomei = Batrachocamallanus slomei, Cm. kaapstaadi = Camallanus kaapstaadi.
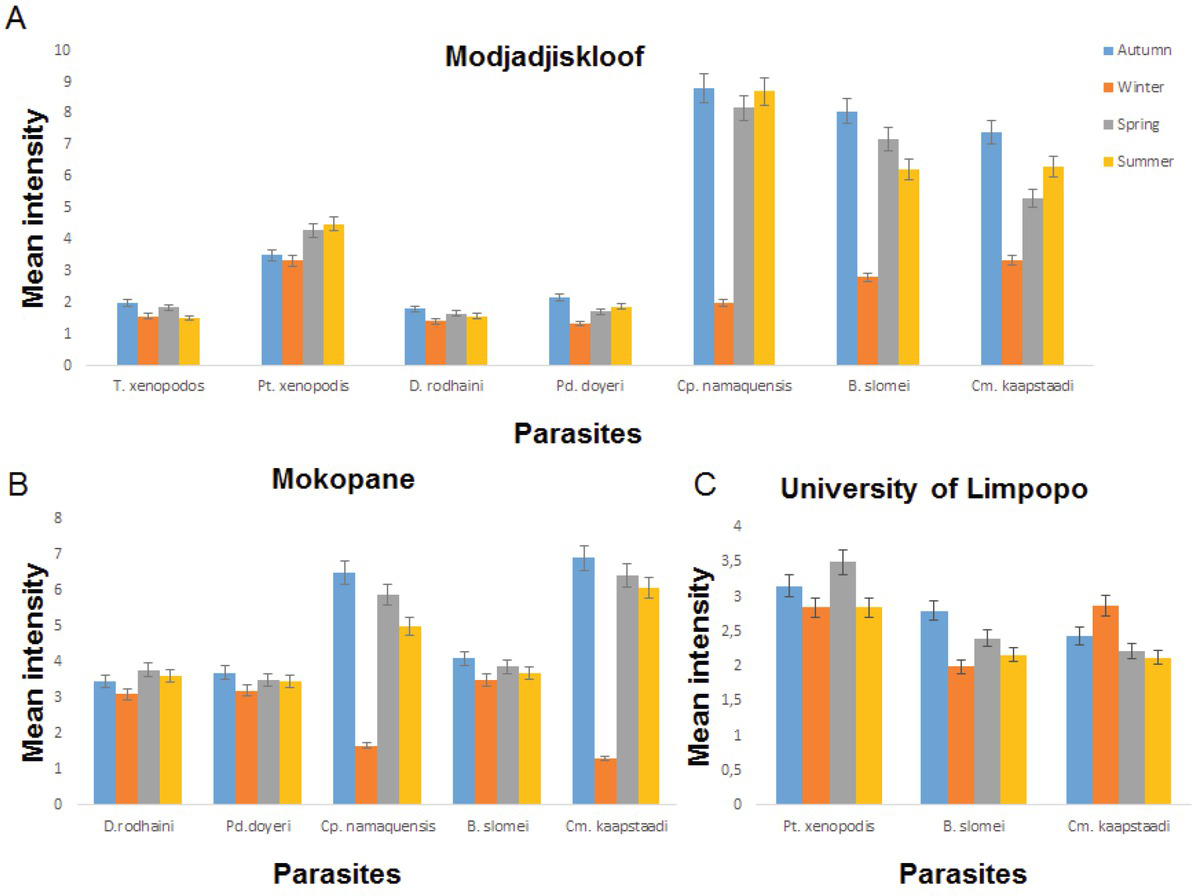
Fig. 10
Mean intensity of parasites recorded from Xenopus laevis from Modjadjiskloof, Mokopane and University of Limpopo in different seasons. Key: T. xenopodos = Trichodina xenopodos, Pt. xenopodos = Protopolystoma xenopodis, D. rodhaini = Dollfuschella rodhaini, Pd. doyeri = Progonimodiscus doyeri, Cp. namaquensis = Cephalochlamys namaquensis, B. slomei = Batrachocamallanus slomei, Cm. kaapstaadi = Camallanus kaapstaadi.
Table 2
Summary of the occurrence of parasites from Xenopus laevis in relation to size and sex for surveys conducted in Modjadjiskloof, Mokopane, University of Limpopo, Limpopo Province, South Africa.
| Locality | Parasites | Chi-square | p – value |
|---|---|---|---|
| Preference for sex | |||
| Trichodina xenopodos | 0.202 | 0.653 | |
| Protopolystoma xenopodis | 0.009 | 0.926 | |
| Dollfuschella rodhaini | 0.404 | 0.525 | |
| Modjadjiskloof | Progonimodiscus doyeri | 2.063 | 0.151 |
| Cephalochlamys namaquensis | 0.010 | 0.920 | |
| Batrachocamallanus slomei | 2.940 | 0.086 | |
| Camallanus kaapstaadi | 0.292 | 0.589 | |
| Dollfuschella rodhaini | 1.069 | 0.301 | |
| Progonimodiscus doyeri | 2.016 | 0.156 | |
| Mokopane | Cephalochlamys namaquensis | 0.047 | 0.829 |
| Batrachocamallanus slomei | 0.012 | 0.912 | |
| Camallanus kaapstaadi | 1.083 | 0.298 | |
| Protopolystoma xenopodis | 1.255 | 0.263 | |
| University of Limpopo | Batrachocamallanus slomei | 0.236 | 0.627 |
| Locality | Camallanus kaapstaadi Parasites | 0.219 R2 value | 0.640 p – value |
|---|---|---|---|
| Preference for size | |||
| Trichodina xenopodos | 0.027 | 0.806 | |
| Protopolystoma xenopodis | 0.176 | 0.103 | |
| Dollfuschella rodhaini | 0.131 | 0.225 | |
| Modjadjiskloof | Progonimodiscus doyeri | −0.045 | 0.680 |
| Cephalochlamys namaquensis | 0.028 | 0.796 | |
| Batrachocamallanus slomei | 0.064 | 0.558 | |
| Camallanus kaapstaadi | 0.130 | 0.231 | |
| Dollfuschella rodhaini | −0.013 | 0.895 | |
| Progonimodiscus doyeri | −0.136 | 0.166 | |
| Mokopane | Cephalochlamys namaquensis | −0.042 | 0.669 |
| Batrachocamallanus slomei | −0.051 | 0.607 | |
| Camallanus kaapstaadi | −0.039 | 0.691 | |
| Protopolystoma xenopodis | −0.089 | 0.376 | |
| University of Limpopo | Batrachocamallanus slomei | −0.104 | 0.303 |
| Camallanus kaapstaadi | −0.014 | 0.893 | |