
Table 1
Parasite burden in mice treated with probiotic bacteria and infected with T. spiralis.
| Intestinal phase (numbers of adults) | ||||||
|---|---|---|---|---|---|---|
| Days post infection | ||||||
| 5 | 11 | 18 | ||||
| (mean ± S.D. ) | reduction (%) | (mean ± S.D.) | reduction (%) | (mean ± S.D.) | reduction (%) | |
| T.spiralis (control) | 295 ± 24 | 229 ± 37 | 2±2 | |||
| E.faecium EF55 + T.spiralis | 293 ± 38 | 0.7 | 160 ±39 | 30.1 | 0±0 | 100 |
| E.faecium CCM8558 + T.spiralis | 244 ± 25 | 17.3 | *107 ±25 | 53.3 | 0±0 | 100 |
| E.faecium CCM7420 + T.spiralis | 235 ± 35 | 20.3 | *112±14 | 51.1 | 0±0 | 100 |
| E.durans ED26E/7 + T.spiralis | 256 ±7 | 13.2 | *142 ±29 | 38 | 1±2 | 50 |
| L.fermentum CCM7421 + T.spiralis | 209 ± 21 | 29.2 | 210 ±27 | 8.3 | 40 ±12 | 0 |
| L.plantarum 17L/L1 + T.spiralis | 326 ± 48 | 0 | 192 ±8 | 16.2 | 1±2 | 0 |
| Muscle phase (numbers of larvae) | ||||||
|---|---|---|---|---|---|---|
| Days post infection | ||||||
| 18 | 25 | 32 | ||||
| (mean ±S.D.) | reduction (%) | (mean ± S.D.) | reduction (%) | (mean ± S.D.) | reduction (%) | |
| T.spiralis (control) | 2±4 | 50,080 ± 4,931 | 54,069 ± 8,020 | |||
| E.faecium EF55 + T.spiralis | 40 ±9 | 0 | 37,060 ±4,150 | 26 | 42,580 ± 7,750 | 21.2 |
| E.faecium CCM8558 + T.spiralis | 47 ±2 | 0 | **13,220 ± 1,842 | 73.6 | *23,810 ±799 | 56 |
| E.faecium CCM7420 + T.spiralis | 24 ±6 | 0 | 27,970 ±7,212 | 44.1 | 46,950 ±3,818 | 13.2 |
| E.durans ED26E/7 + T.spiralis | 28 ±16 | 0 | *23,250 ± 5,938 | 53.6 | **29,080 ± 2,204 | 46.2 |
| L.fermentum CCM7421 + T.spiralis | 4±2 | 0 | **18,380 ± 2,039 | 63.7 | 26,272 ± 2,566 | 51.4 |
| L.plantarum 17L/L1 + T.spiralis | 65 ±6 | 0 | **15,540± 2,191 | 69 | 32,070 ± 6,463 | 40.7 |
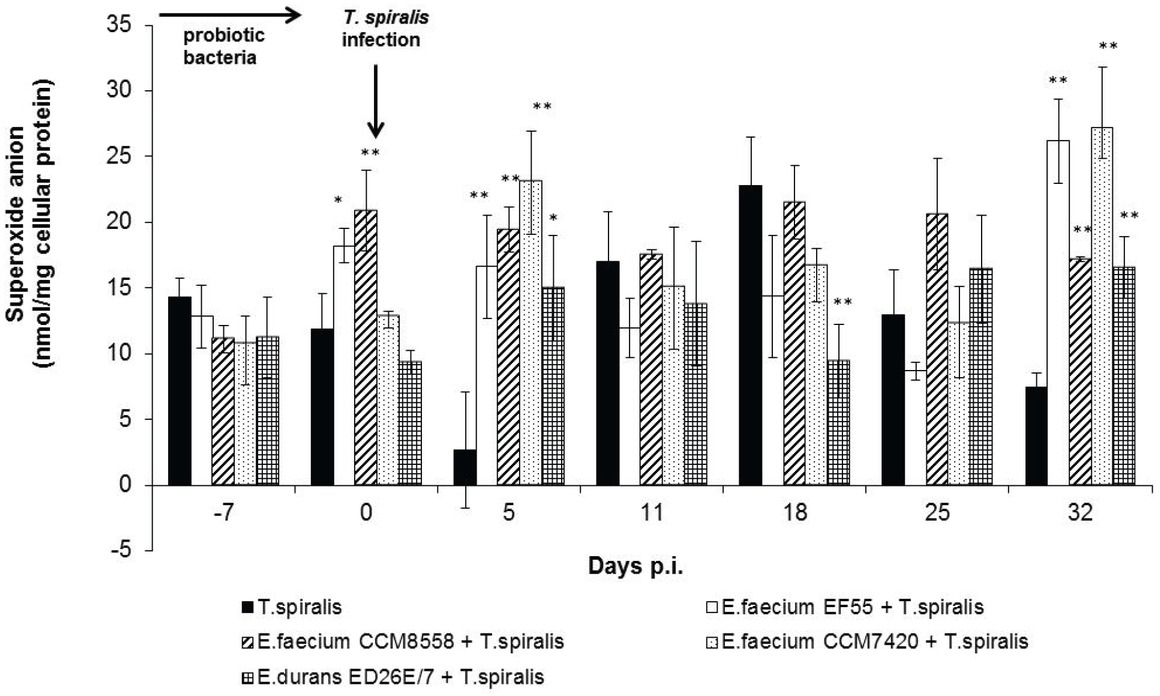
Fig. 1
Production of superoxide anion by peritoneal macrophages from mice treated with probiotic bacteria (enterococci) and infected with T. spiralis. *P<0.05; **P<0.01– statistically significant differences from T. spiralis infected group without probiotic treatment (control).
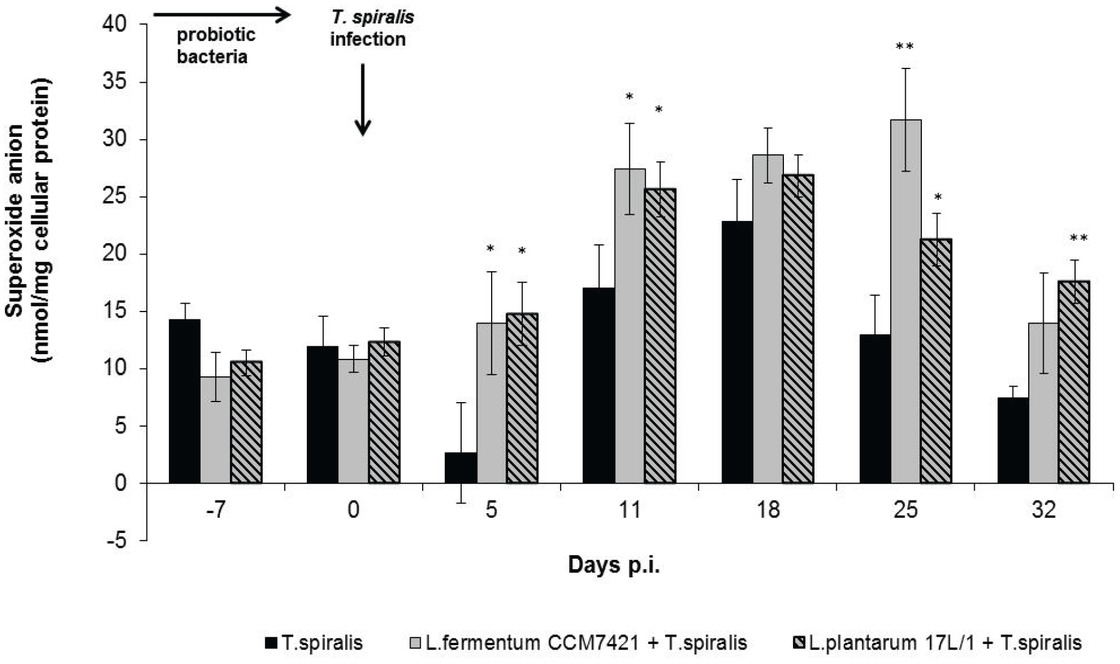
Fig. 2
Production of superoxide anion by peritoneal macrophages from mice treated with probiotic bacteria (lactobacilli) and infected with T. spiralis. *P<0.05; **P<0.01– statistically significant differences from T. spiralis infected group without probiotic treatment (control).