
Introduction
The Artemis generation of space exploration will require spacecraft that are highly independent from Earth, unlike historic low Earth orbit vehicles. The International Space Station (ISS) can receive resupply capsules in a matter of hours, while Gateway, phase four of the Artemis missions, will facilitate the farthest human space missions ever completed (1,000 times farther from Earth than the ISS) (European Space Agency; National Aeronautics and Space Administration, 2025). Gateway will be uninhabited for long periods of time, with astronauts only present in the station for approximately three months at a time (National Aeronautics and Space Administration, 2025). This presents a unique challenge for advanced life support systems, which must remain functional during long periods of dormancy and restart properly before astronauts return. These challenges will only be exacerbated as manned missions extend towards Mars and beyond (Zea et al., 2020).
Previously, the Environmental Control and Life Support Systems (ECLSS) of the ISS have experienced issues with biofilms that have required part replacement and new methods of microbial control (Bruce et al., 2005; Carter, 2010; Velez et al., 2020; Weir et al., 2012; Zea et al., 2018). Biofilms are communities of microorganisms that often confer advantages to cells (e.g., antimicrobial resistance) and protection from environmental stresses like desiccation, starvation, biocides, UV radiation, and osmotic lysis (Donlan, 2001, 2002; Elasri and Miller, 1999; Flemming et al., 2007; Flemming and Wingender, 2010; Mah and O’Toole, 2001; Roberson and Firestone, 1992; Wingender and Flemming, 2011; Yin et al., 2019). The cells within a biofilm are embedded in a sticky matrix known as extracellular polymeric substances (EPS), which are mostly composed of polysaccharides, but also contain nucleic acids, lipids, and proteins. The EPS helps confer many of the survival advantages to the biofilm and can act as a layer of protection to the cells within (Flemming et al., 2007; Flemming and Wingender, 2010). These properties make biofilms difficult to mitigate. Challenges associated with biofilm removal and control are exacerbated in cramped environments that make physical cleaning difficult, such as those found in spacecraft life support systems.
Great improvements have been made to ECLSS on the ISS over its lifetime (Carter, 2010; Gaskill, 2023; Pruitt et al., 2015; Williamson et al., 2024; Williamson et al., 2023). But there will be unique challenges associated with maintaining functional and clean water systems during Gateway’s long dormancy periods (Beitle et al., 2024; Zea et al., 2020). The study presented here aims to improve on previously completed studies using three methods of biofilm control for spacecraft water systems: a surface coating, phosphorus limitation, and silver fluoride biocide. The critical improvement in these updated experiments is the use of a novel low-shear simulated microgravity biofilm reactor (Ketteler et al., 2025) rather than high-shear normal gravity biofilm evaluation (Mettler and Peyton, 2025). The incorporation of simulated microgravity marks a large step toward accurate modeling of spacecraft water systems. The organisms (Zea et al., 2020), nutrient medium (Velez Justiniano et al., 2021), and surface material (Callahan et al., 2007) used were all informed by what is present in the ISS, since it is assumed that the life support systems in Gateway will be heavily informed by and modeled after the ISS.
The simulated microgravity biofilm reactor (SMBR) was developed by researchers at the Center for Biofilm Engineering and Department of Mechanical and Industrial Engineering at Montana State University (MSU). The SMBR is a rotating wall vessel that features coupons on the reactor walls that provide a removable physical surface for biofilm evaluation (Ketteler et al., 2025). This is a key design feature for assessing material coatings as a method of biofilm control. The reactor provides a non-unidirectional, low-shear environment, even at the reactor walls, with computational fluid dynamics models showing maximum fluid shear on the wall coupons of 0.17 mPa (Ketteler et al., 2025), well below the accepted shear stress limit of 1 mPa for simulated microgravity (SMG) (Begley and Kleis, 2000; Lynch et al., 2006; Nauman et al., 2007). Further, this reactor offers increased flexibility over some other reactors on the market, namely the option of operation in batch or continuous flow mode. As shown in this study, these unique features make the MSU SMBR an attractive option for evaluating biofilm control methods for spacecraft applications. The study presented here builds on previous multi-domain biofilm research (Beitle et al., 2024; Mettler and Peyton, 2025) and, for the first time, evaluates the combined impacts of a surface coating, nutrient limitation, and biocide addition on biofilm accumulation in a simulated microgravity environment.
Methods
Organism selection and preparation
The organisms used in the experiments are all frequently isolated from the ISS water system (Zea et al., 2020), and several species are also present in consortia used by other researchers (Nickerson et al., 2024; O’Rourke et al., 2020; Thompson et al., 2020; Yang et al., 2021). The three bacterial species used were direct ISS isolates provided by Boeing: Burkholderia contaminans (wastewater tank isolate), Methylobacterium organophilum (oxygen generation assembly isolate), and Ralstonia insidiosa (wastewater tank isolate). The fungus used, Coniochaeta mutabilis (formerly Lecythophora mutabilis), is a direct wastewater tank isolate provided by Marshall Space Flight Center. See Supplemental Table 1 for internal and external strain identifiers. Genomes for the strains of B. contaminans and M. organophilum used here have been published (Velez Justiniano et al., 2023). These four organisms were used as a consortium in all experiments. The organisms were stored as frozen stocks in a 50/50 (v/v) mixture of glycerol and cell culture medium in their corresponding medium (tryptic soy broth for bacteria and Sabouraud dextrose broth for the fungus). Streak plates were prepared on R2A agar (BD Difco) to ensure culture purity, and one colony was used to inoculate sterile 125 mL baffled flasks containing 30 g/L tryptic soy broth (for bacteria) or 30 g/L Sabouraud dextrose broth (for the fungus). The flasks were placed in a shaking incubator at 225 rpm and 30 °C. M. organophilum and C. mutabilis cultures were started 48 h prior to reactor inoculation, and B. contaminans and R. insidiosa cultures were started 24 h prior to reactor inoculation. After incubation, the C. mutabilis cultures were filtered through sterile glass wool to remove some hyphae. All cultures were then washed via three centrifugation steps (3 min at 8,000 × g) and resuspended in 0.85% NaCl (pH 5.5). The optical density of each culture was measured at 600 nm and adjusted such that when 100 μL of washed cells were added to the reactor, the initial reactor concentration of each organism was approximately 104 CFU/mL.
Table 1.
Recipe for microbial ersatz MTN featuring final component concentrations. Final pH adjusted to 5.55 ± 0.05.
| Component | Concentration | Component | Concentration | ||
|---|---|---|---|---|---|
| Propylene Glycol | 8.971 | µL/L | Benzyl Alcohol | 6.075 | µL/L |
| Ethanol | 44.946 | µL/L | Diethylphthalate | 2.01 | µL/L |
| Acetone | 25.799 | µL/L | Trimethyl Silanol | 0.635 | µL/L |
| 2-(2-butoxyethoxy) Ethanol | 2.356 | µL/L | Benzothiazole | 0.21 | µL/L |
| N, N-Dimethylformamide | 1.486 | µL/L | 2-Ethyl-1-Hexanol | 0.48 | µL/L |
| 2-Ethoxyethanol | 1.303 | µL/L | Decamethylcyclopentasiloxane | 1.03 | µL/L |
| 1-Methyl-2-Pyrrolidinone | 0.782 | µL/L | Dodecamethylcyclohexasiloxane | 10 | µL/L |
| 2-Propanol | 0.896 | µL/L | Octamethylcyclotetrasiloxane | 1.02 | µL/L |
| 1-Propanol | 0.876 | µL/L | Dimethoxydimethylsilane | 35.1 | µL/L |
| 4-Ethylmorpholine | 2.265 | µL/L | Calcium Sulfate | 1.885 | mg/L |
| Formic Acid | 27.489 | µL/L | Dimethyl Sulfone | 0.205 | mg/L |
| Lactic Acid | 8.55 | µL/L | Hexamethylcyclotrisiloxane | 1.02 | mg/L |
| Benzoic Acid | 3.015 | mg/L | Monobasic Potassium phosphate | 0.835 | mg/L |
| Caprolactam | 1.111 | mg/L | Magnesium chloride hexahydrate | 0.397 | mg/L |
| Urea | 1.899 | mg/L | Manganese chloride tetrahydrate | 0.319 | mg/L |
| Zinc (II) Acetate dihydrate | 1.425 | mg/L | Ferric chloride | 0.129 | mg/L |
| Nickel (II) Acetate tetrahydrate | 0.518 | mg/L | Boric acid | 0.268 | mg/L |
| Acetic Acid | 32.088 | µL/L | Cobalt chloride hexahydrate | 0.004 | mg/L |
| Ammonium Bicarbonate | 101.457 | mg/L | Sodium molybdate dihydrate | 0.016 | mg/L |
| Sodium Fluoride | 0.88 | mg/L | |||
| Potassium Iodide | 0.021 | mg/L | |||
Nutrient medium
The nutrient medium used was microbial ersatz minor/trace nutrients (MTN), a medium designed to mimic the nutrient concentration and chemical composition of the ISS wastewater tank, which is composed of approximately 50% influent from humidity condensate and 50% influent from urine distillate. The medium recipe is listed in Table 1 and is a slightly modified version of a previously published recipe to account for minor and trace nutrients that are expected to be in the wastewater tank influent (Sandvik et al., 2022; Velez Justiniano et al., 2021). The medium was prepared in a 13L glass carboy that had been washed with 10% HCl and thoroughly rinsed with high-resistance water (HRW; 18.2 MΩ·cm).
To prepare the medium, 7 L of HRW was sterilized in the carboy by autoclaving for at least 90 minutes (121 °C, 21 PSI). After the autoclave cycle, sterile concentrated nutrient stock solutions were added, and the volume was brought to 8 L with sterile HRW. The pH of a 10 mL aliquot was checked and adjusted to 5.55 ± 0.05 with 1 M HCl or 1 M NaOH. The volume of acid/base was then scaled, and sterile solutions were added to the carboy. The pH of a new 10 mL aliquot was then validated. For experiments without phosphorus, the monobasic potassium phosphate stock was not added to the medium.
Biocide preparation
For experiments that received a biocide dose, silver (I) fluoride (99+%, Thermo Scientific) was prepared at a concentration of 521 mg/L such that, when introduced to the reactor, it was present at a concentration of 2 ppm. The silver (I) fluoride was dissolved in HRW and filter sterilized into a sterile 50 mL conical vial.
Reactor assembly and preparation
The reactor was a rotating wall vessel custom built by researchers at the MSU Center for Biofilm Engineering (Figure 1). Details of the reactor, fluid modeling, and preliminary batch biofilm studies were recently published in Ketteler et al., 2025 (Ketteler et al., 2025). Slight changes to the reactor were made prior to the experiments presented here, including a coupon ring with 8 slots for disk coupons featuring recesses flush with the walls of the reactor (0.25mm from tangency), and the elimination of coupons suspended down the center axis. The rest of the reactor remained the same, including the use of polycarbonate tubing for the walls.
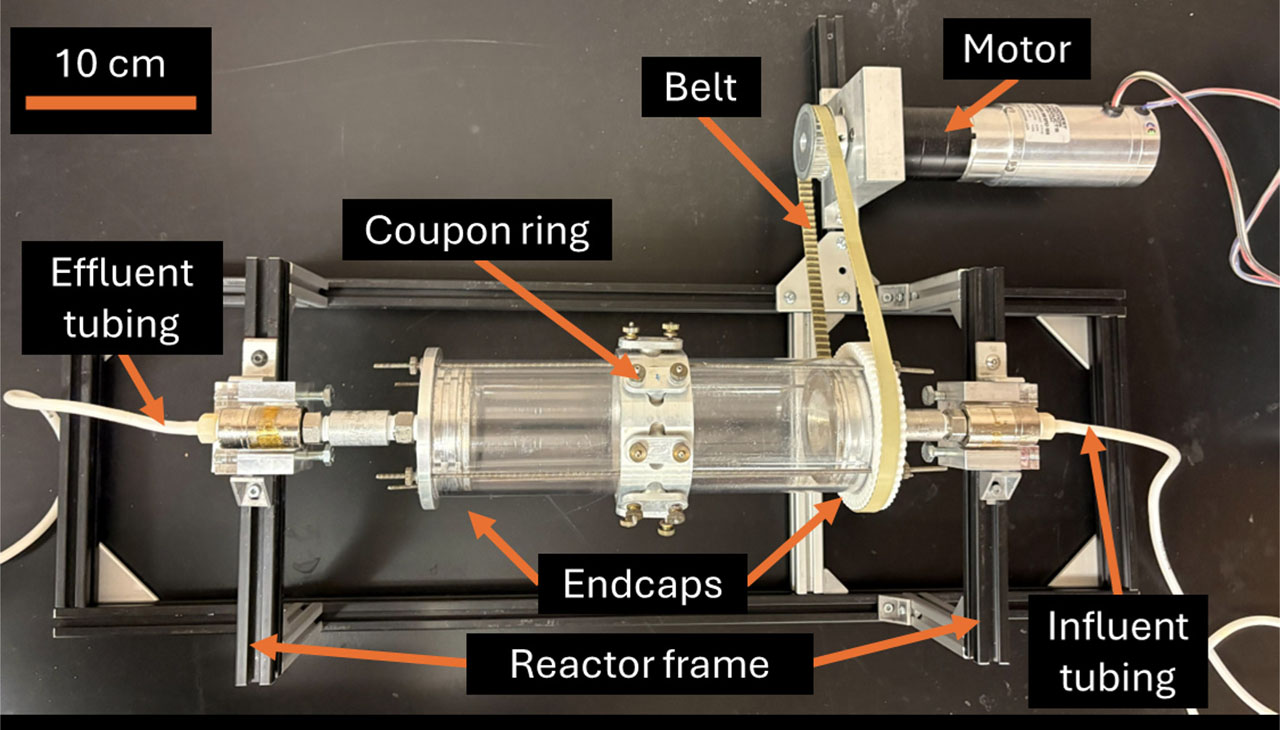
Figure 1.
Simulated microgravity reactor featuring uncoated polycarbonate walls. For a detailed CAD drawing of the original reactor design, refer to Ketteler et al., 2025 (Ketteler et al., 2025).
The disk-shaped biofilm coupons (BioSurface Technologies; Bozeman, MT) used in these experiments were 316 stainless steel, a common material in spacecraft water systems (Callahan et al., 2007). The coupons were designed for use in the Centers for Disease Control (CDC) biofilm reactors (ASTM, 2021) and are 12.7 mm in diameter and 1.8 mm in thickness. Upon receiving the coupons, they were washed by submersion and sonication in soapy water, rinsed with HRW, and sonicated again in HRW. Coupons used for the surface coating tests were coated with The Sherwin-Williams Company (Cleveland, OH) Sher-Loxane® 800 coating (product numbers B80W501 extra white and B80V500 standard temperature hardener). The coating was applied with a paintbrush such that a visually homogeneous layer was present. Only one side of the coupons was coated, as only one side of the coupons was exposed to the bulk fluid in the reactor.
For experiments featuring coated coupons, the polycarbonate tubing (reactor wall) was also coated with the Sher-Loxane® 800 (The Sherwin-Williams Company, Cleveland, OH) using a paintbrush and rolling the tubing to evenly coat the walls. Tape was used to ensure the ends were not coated to maintain the tolerances in the endcaps and to allow some visibility into the reactor during operation.
Prior to experiments, the uncoated reactor was fully assembled and sterilized in an autoclave at 121 °C and 21 PSI (Figure 1). When the coating was used, the polycarbonate tubing and stainless steel coupons were not autoclaved and were instead disinfected with 99% isopropanol, and the reactor was assembled in a biosafety cabinet (Labconco, Class II cabinet).
Reactor operation
The reactor was connected via size 16 C-Flex tubing (MasterFlex #06424-16; selected to maximize tubing flexibility while minimizing gas diffusion and bubbles) to the influent carboy containing sterile ersatz MTN medium and the effluent waste carboy. The reactor was filled to the halfway mark while in the horizontal position on the reactor stand. The pump (Masterflex L/S) was then paused, a coupon holder slot was opened, and 100 μL of each washed cell culture was added to the reactor. The coupon was replaced, and the reactor was positioned vertically on a ring stand (filling from the bottom to remove air). The pumping was resumed, and the reactor was filled with medium.
After filling with medium so no bubbles were present, the reactor was placed in the horizontal position on the frame, and rotation was initiated (24.8 RPM). The delay between inoculation and starting rotation was about 15 min. The reactor remained rotating during the entire duration of the experiments. Cyclical batch and continuous flow phases were implemented to model the filling of the ISS wastewater tank (batch) and the emptying for subsequent processing (continuous flow). The cycle featured 21 h of batch operation followed by 3 h of continuous flow at 4.83 mL/min (a residence time of approximately 160 min to match the residence time in relevant CDC experiments (Figure 2) (Mettler and Peyton, 2025). This cycle was repeated for 7 days of operation, with final sampling taking place about 20 min into the final continuous flow phase.
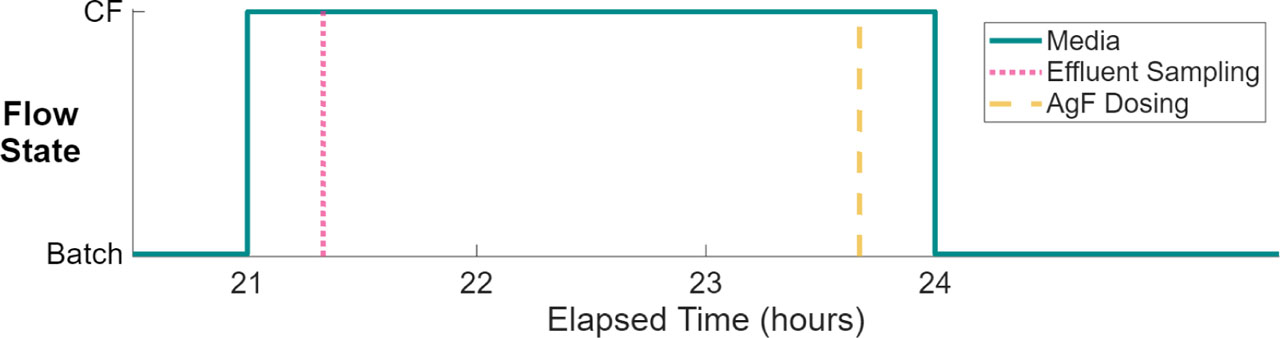
Figure 2.
Daily operational timeline for the SMBR. Hours 0–21 are left off of the figure for ease of interpretation (batch phase with no sampling/dosing occurring). CF= continuous flow.
Three iterations of experiments were conducted. The first featured no biofilm control methods. The second iteration focused on coupons and reactor walls coated with Sher-Loxane® 800, with the coating covering about 64% of the reactor interior surface area. The last iteration of the experiment included three previously investigated biofilm control methods: Sher-Loxane® 800 coating on coupons and walls (also 64% surface area coverage), nutrient medium without phosphorus (nutrient limitation), and a daily biocide dose of silver (I) fluoride (similar to the methods used by Mettler and Peyton (Mettler and Peyton, 2025)). Duplicates of all three experiments were completed.
For experiments that included biocide dosing, 3 mL of sterile silver (I) fluoride was injected through an inline luer injection port in the influent tubing. The membrane was disinfected with a 70% ethanol preparation wipe, and the biocide was injected with a needle and syringe. Biocide dosing took place with approximately 20 min remaining in the continuous flow cycle each day (Figure 2). These experiments also featured the removal of phosphorus from the medium. The polycarbonate tubing for the reactor was replaced for each new experiment; however, the metal components of the reactor (Figure 1) were not replaced between experiments. It is possible that trace amounts of phosphorus were present in the system from the metal components.
Sampling
About 20 min into the continuous flow phase each day, an effluent planktonic sample was taken via a sampling port in the effluent tubing (a syringe connected to a luer lock in a Y-split). A 4.4 mL effluent sample was added to 600 μL of 50% glutaraldehyde to achieve a final glutaraldehyde concentration of 6%, and another aliquot was diluted and plated for viable counts. Prior to diluting for viable counts, the second aliquot was vortexed briefly to break up any large aggregates of cells. The sample fixed in glutaraldehyde was not vortexed and was later examined on a FlowCam (Yokogawa) to evaluate the presence and morphology of suspended biofilm aggregates.
After 7 days, the reactor was sampled for biofilm. About 1 hour prior to sampling, the gradual slowing of the rotation began. Continuous flow was initiated for the last 20 min of slowed reactor rotation to allow the collection of an effluent sample. After the sample was taken, the pump and reactor rotation were stopped entirely. The effluent tubing was clamped (to prevent reactor drainage), and a coupon was removed with flame-sterilized tweezers. The first coupon removed was stained for confocal microscopy, and a bulk planktonic sample was removed from the reactor with a serological pipette. The coupon was placed biofilm side up in a 24-well plate and stained initially with BacLight LIVE/DEAD stain (Thermo Fisher Scientific) and incubated in the dark for 15 min. After the incubation period, the stain was removed, and the coupon was gently rinsed 3 times with filter-sterilized HRW. The coupon was then stained with a 50/50 solution of Calcofluor White (MilliporeSigma) and phosphate-buffered saline (PBS) and incubated in the dark for 10 min. The stain was pipetted off, and the coupon was rinsed three times with filter-sterilized HRW and submerged in 4% paraformaldehyde and 2.5% glutaraldehyde fixative solution until confocal microscopy. An unused coupon was placed into the slot, and the coupon holder was reassembled.
The reactor was rotated until a new coupon was at the uppermost slot. The coupon holder was disassembled, and the coupon was removed with flame-sterilized tweezers. The coupon was placed biofilm-side up in a sterile Petri dish. Sterile tweezers were used to hold the coupon stable, and the biofilm was scraped off with a sterile rayon swab. The swab tip was cut off with flame-sterilized scissors and placed into a 50 mL sterile conical vial containing 10 mL sterile PBS and 10 μL Tween 20. The scraped coupon was then placed back into the reactor, and the process was repeated until 5 coupons were sampled for viable plate counts. The biofilm on the rayon swabs was disaggregated via vortex mixing and sonication (VWR Model 50T, 35kHz) in an alternating series of 30-second intervals for a total of 2.5 min, beginning and ending with vortex mixing. The disaggregated biofilm was serially diluted in sterile PBS and plated for viable plate counts.
Selective agar was used to enumerate the species individually, and samples were also plated on plain R2A agar for total counts. See Table 2 for agar recipes. After drying, agar plates were placed in a 30 °C incubator until visible colonies formed, typically 2 days for B. contaminans, R. insidiosa, and general R2A plates, and 4 days for C. mutabilis and M. organophilum.
Table 2.
Selective agar recipes.
| Organism selected for | Agar type |
|---|---|
| B. contaminans | Pseudomonas isolation agar |
| C. mutabilis | Sabouraud dextrose agar, pH lowered to 3 |
| M. organophilum | Methylobacterium agar (Atlas, 2010) with Amphotericin B (7.5 µg/mL) |
| R. insidiosa | R2A with Amphotericin B (7.5 µg/mL) and chloramphenicol (20 µg/mL) |
Statistical analysis on viable cell density
Biofilm cell densities were analyzed using a factorial ANOVA with species, treatment, and day as fixed effects. Pairwise comparisons of treatments within each species were performed using Tukey’s honestly significant difference (HSD) test to control for multiple comparisons. The same comparisons were made for the effluent versus reactor broth planktonic sampling on day 7 of reactor operation. All tests were conducted using RStudio 4.2.3.
FlowCam
The planktonic samples for FlowCam analysis were fixed in glutaraldehyde (6% final concentration) and stored at 4°C until image analysis. Samples for each day and experimental replicates were processed (n=48 total samples). Samples from the experiment with uncoated coupons, full-strength medium, and no biocide dosing were analyzed using the 4x and 10x flow cells. Prior to imaging these samples on the 10x flow cell, they were filtered through a sterile 100 μm nylon mesh to remove large clumps and avoid clogging the flow cell. The samples from the other two experimental iterations (with Sher-Loxane® 800-coated walls as the only biofilm control method and Sher-Loxane® 800-coated walls, no-phosphorus medium, and silver biocide dosing) were imaged on the 10x flow cell without a prefiltering step due to the lack of large clumps. Analysis setup, data acquisition, and image processing were performed using VisualSpreadsheet 6. Sample analysis achieved 72% efficiency, meaning that 72% of the total sample volume used for analysis was imaged.
Results
Biofilm community
Biofilm sampling took place on the final day of the experiment, 7 days after the reactor was inoculated. In the SMBR with no biofilm control methods applied (Figure 3A), the total viable biofilm density was approximately 6.5 log10CFU/cm2, dominated by R. insidiosa. The SMBR with Sher-Loxane® 800-coated walls and coupons (Figure 3B) featured a viable cell density similar to that with uncoated coupons (Figure 3A), with B. contaminans (p-value 0.0395) and R. insidiosa (p-value 0.4009) present at similar densities in all four tests. The reactor with coated walls/coupons, medium without phosphorus, and daily silver fluoride doses did not support a viable biofilm that could be detected with plate counts (Figure 3C; limit of detection 2.08 log10CFU/cm2). The p-values of the Tukey comparisons performed on the biofilm densities between each experimental iteration are all presented in Supplemental Table 2.
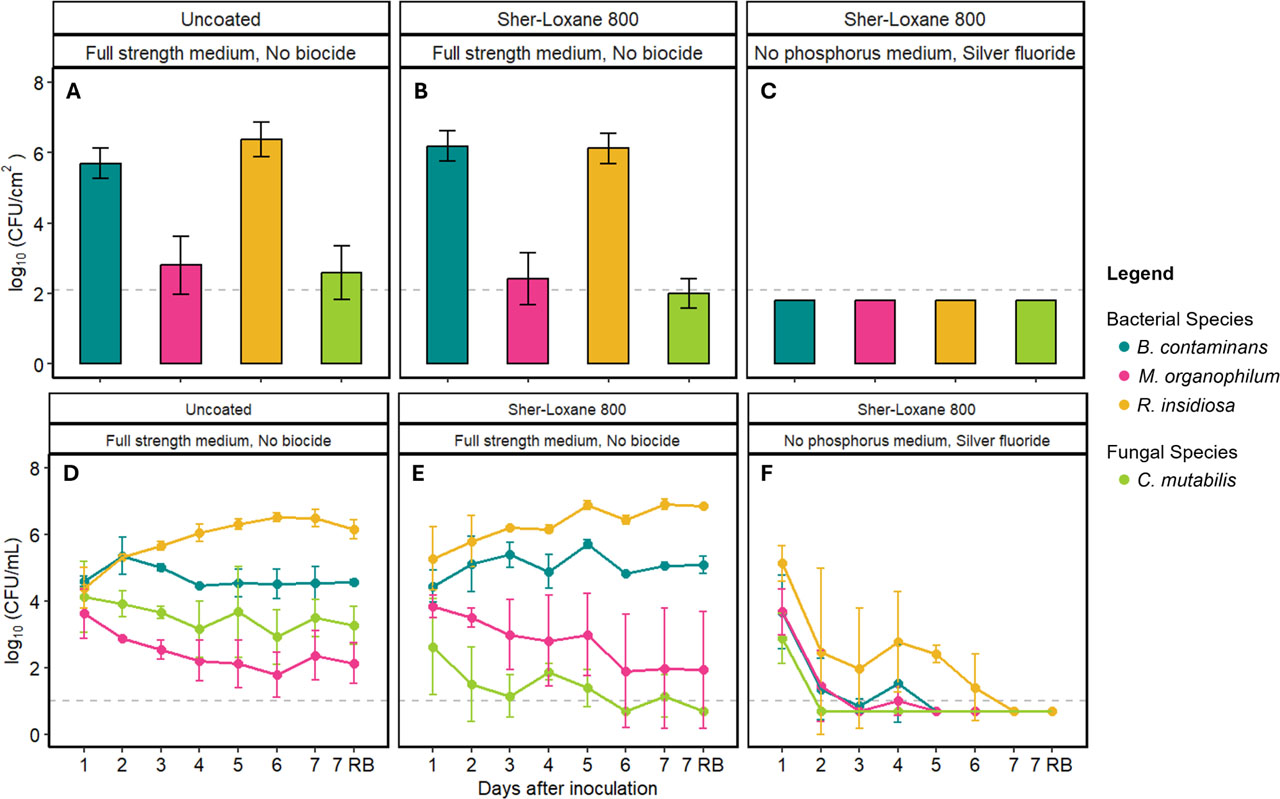
Figure 3.
Viable biofilm density (A-C) accumulated on coupons 7 days after reactor inoculation. The bars represent the average of 10 coupons across 2 biological replicates (5 coupons per reactor). Error bars represent the standard deviation of the same. The grey dashed line represents the limit of detection (2.08 log10CFU/cm2). Planktonic cell densities (D-F) of each species in the consortium. The dots are the average of the biological replicates of the reactors, and the error bars are the standard deviation between the two biological replicates. RB= reactor bulk fluid. The dashed line represents the limit of detection, 1.00 log10CFU/mL.
In the second biological replicate of the experiment with three methods of biofilm control, the limit of detection was lowered to 1.1 log10CFU/cm2 by spread plating 1 mL of sample on one set of agar plates. The original limit of detection was also maintained by plating 100 μL on another set of agar plates. No viable colonies were detected for any of the coupons with either limit of detection. Only the original 2.08 log10CFU/cm2 limit of detection is present on the graph to remain consistent with the other experiments and the first replicate.
Confocal microscopy was used to visualize the biofilm on the coupons after 7 days in the reactors. Representative images from random locations on the coupon surface are presented in Figure 4. In reactors with no biofilm mitigation strategy (Figure 4A), fungal hyphae were present on the surface (in blue and white) as well as 20–30 μm aggregates of bacteria.
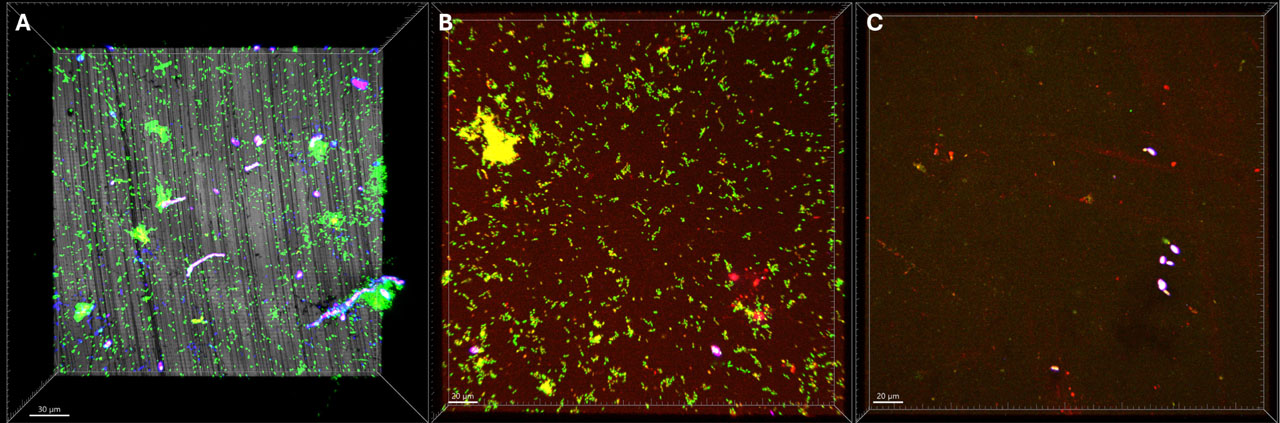
Figure 4.
Confocal microscopy images of biofilms after 7 days in the SMBR grown A) with no biofilm control methods, B) on Sher-Loxane® 800-coated coupons as the only method of biofilm control, and C) on Sher-Loxane® 800-coated coupons in no-phosphorus medium and daily silver fluoride biocide doses. Viable bacteria are represented in green, non-viable bacteria in red, and fungal biomass in blue/purple/pink depending on the panel. Note: the scale bar in panel A is 30 μm while the scale bars in panels B and C are 20 μm.
The biofilm grown on Sher-Loxane® 800 coupons as the only method of biofilm control had fewer bacterial cell aggregates and very little fungal biomass (Figure 4B). Minimal biomass was detected on the coupons featuring biofilm grown under all three methods of biofilm control (Sher-Loxane® 800 coupons, no phosphorus in the nutrient medium, and daily silver fluoride biocide doses; Figure 4C). Several non-viable bacteria (in red) and a few conidial fungal cells (purple/pink) are apparent in panel 4C. For panels 4B and C, the coating is fluorescent at the same wavelengths used to image the biomass: excitation wavelengths of 405 nm (blue), 483 nm (green), and 568 nm (red), making the images appear different.
Planktonic community
The planktonic cell concentrations were tracked throughout the 7 days of reactor operation (Figure 3D-F). On the last day of reactor operation, two samples for planktonic cell concentration were taken: one from the reactor effluent tubing (marked with 7) following the sampling method for days 1–6 and one from the bulk fluid in the reactor during coupon sampling (marked with 7 RB for reactor bulk fluid). The two endpoint samples were not statistically different, with the variation between the two being less than 0.5 log10CFU/mL (p-values> 0.9984 for comparison between two sampling points within the same species and experimental iteration). This indicates that the planktonic samples taken from the effluent tubing days 1–6 are likely representative of the planktonic cells in the reactor itself.
In the reactor with no biofilm control method (Figure 3D), the planktonic community was dominated by R. insidiosa, which continued to increase in concentration throughout the duration of the experiment. The other three organisms fell in concentration until about day 4 after inoculation, when they reached a steady state. In experiments with the Sher-Loxane® 800 coating as the only method of biofilm control (Figure 3E), the planktonic community was still dominated by R. insidiosa, which continuously increased and reached a slightly higher concentration than in the uncoated system. The M. organophilum and C. mutabilis fell in concentration throughout the coating-only experiment, with the C. mutabilis eventually dropping below the limit of detection. In the SMBR reactor treated with three methods of biofilm control (Sher-Loxane® 800 coating, medium without phosphorus, and silver fluoride biocide dose; Figure 3F), the planktonic concentration for all organisms was highest one day after inoculation, before the biocide dosing began. The repeated dosing of silver fluoride in combination with the other mitigation methods reduced the planktonic concentration by several orders of magnitude after one day, eventually resulting in planktonic cell concentrations at or below the limit of detection by the end of the experiment (Figure 3F). The p-values of the Tukey comparisons performed on the planktonic densities between each experimental iteration and day are all presented in Supplemental Table 3.
Again, in the second biological replicate of the experiment with three methods of biofilm control, the limit of detection was lowered, this time to 1 CFU/mL by spread plating 1 mL of sample on one set of agar plates and 100 μL on another, instead of only plating 100 μL of sample as was done for the first replicate. No viable colonies were detected for either limit of detection.
The size and shape of biofilm aggregates in the planktonic samples were visualized using a FlowCam, which takes an image of each detected particle. The output image collage featuring the particles with the largest diameters from each day and experimental condition is presented in Figure 5. Particle diameters are presented as area-based diameters, meaning the FlowCam software determined the area of the irregularly shaped particle and then calculated the diameter by assuming the particle was a perfect circle. The collages aid in evaluating the shape of the particles and how they may contribute to clogging in a spacecraft water system. The replicates for the treatments were combined to determine the largest particle per treatment per day. The particles in the reactor without treatment (Figure 5A) are dominated by fungal hyphae. The reactors with Sher-loxane® 800 coating (Figure 5B-C) initially have fungal hyphae, which disappear over the course of the experiment as the bacterial aggregates dominate. The particles in the reactor featuring all three methods of control are optically much clearer (Figure 5C) than the particles from the reactor with just the coating (Figure 5B).
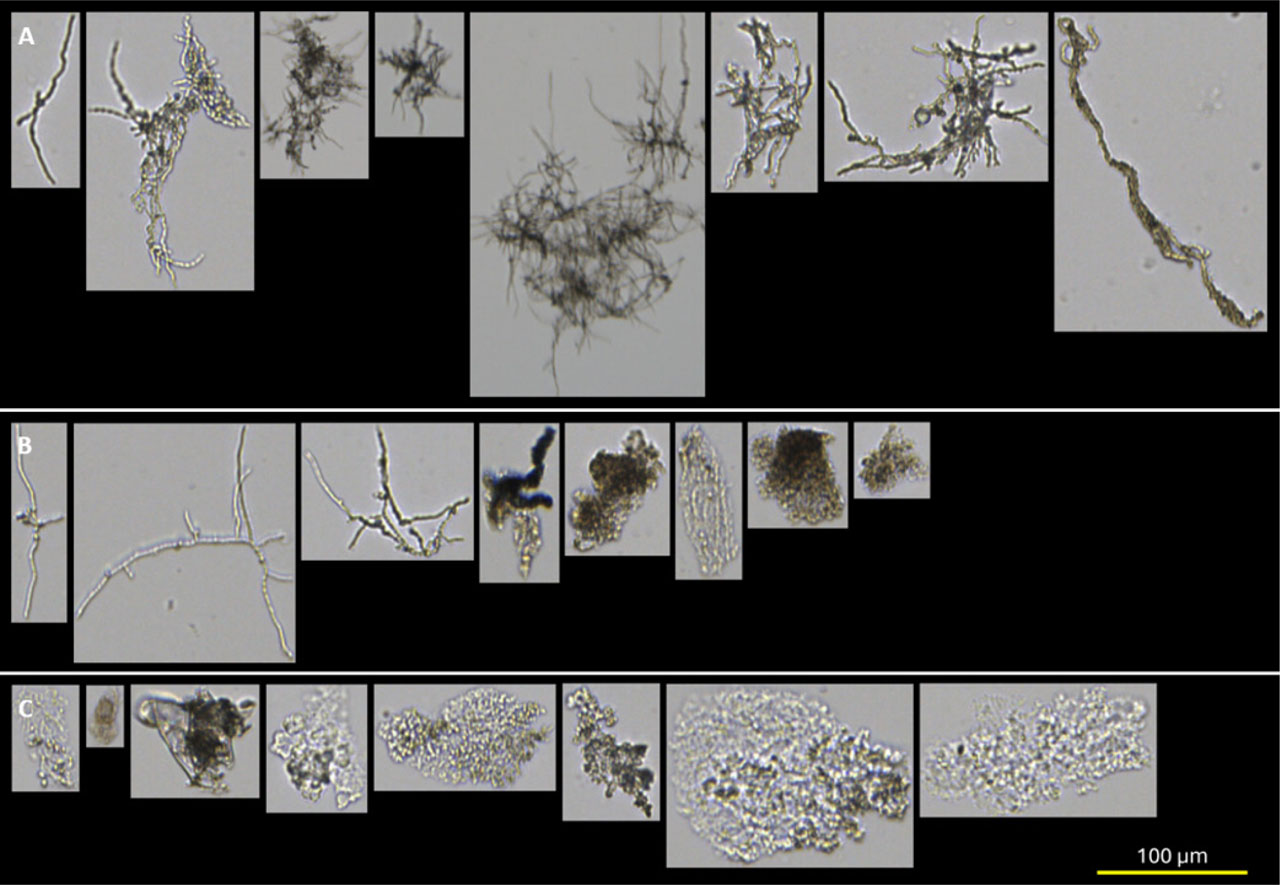
Figure 5.
Collages that feature the largest particle diameter from each sampling day and experimental iteration. A) Uncoated coupons and walls; B) Sher-Loxane® 800-coated coupons and walls; C) Sher-Loxane® 800-coated coupons and walls, no phosphorus medium, and daily silver fluoride biocide dosing. Images for each day are presented in order from left (day 1) to right (day 7 and day 7 RB, respectively). RB = reactor bulk fluid. See Supplemental Table 4 for information regarding the replicate and magnification for each particle.
Discussion
While biocides, nutrient limitations and antibiofilm coatings have all been used to control biofilms, surprisingly little research has been published to determine the efficacy of all three control strategies combined, with only one study published to the best of our knowledge (Mettler and Peyton, 2025). Considerable work has been done in the medical field to explore the use of traditional antibiotics in combination with additional drugs (combination approaches) to control biofilm (Grassi et al., 2017; Hawas et al., 2022; Ren et al., 2019). However, this has not been extended to water systems. Coatings have long been used for biofilm control on surfaces, largely in the medical device industry and more recently proposed for use in spacecraft (Wang et al., 2021) for high touch surfaces (Krämer et al., 2025; Lemelle et al., 2020; Lemelle et al., 2023; Lemelle et al., 2022; Shea et al., 2025; Sobisch et al., 2019; Touching Surfaces 2022) and spacecraft water systems (Demir et al., 2022; Flores et al., 2023; Li Sip et al., 2023; Mettler et al., 2022; Zea et al., 2020). Phosphorus can be a major limiting nutrient for all organisms, including microorganisms, due to its pervasiveness in various molecular processes such as DNA replication, membrane production, and energy production (Elser, 2012). Potential methods of removing phosphorus in spacecraft include resins, nutrient filters, plant growth, or other biological methods. All of these approaches would need experimentation and validation prior to incorporation into spacecraft water systems. Silver’s antimicrobial effects are extensive, including generation of reactive oxygen species, damaging interactions with proteins and DNA, and disruption of cellular respiration (Li et al., 2018). As such, silver has long been used in biocides (Sim et al., 2018), coatings (Knetsch and Koole, 2011; Schierholz et al., 1998), and even textiles (Radetić, 2013). On the Russian side of the ISS water system, silver is already in use, and NASA has expressed interest in incorporating silver fluoride rather than iodine in the water system (Birmele et al., 2011; Li et al., 2018). This has led to many studies exploring silver implementation and compatibility in spacecraft water systems (Adam, 2009; Beringer et al., 2014; Callahan et al., 2007; Petala et al., 2016; Petala et al., 2017; Roberts et al., 2007; Wallace et al., 2016; Wallace et al., 2017). All three of these microbial control strategies (coatings, phosphorus limitation, and silver biocide) have been investigated for use in spacecraft water systems (Beitle et al., 2024; Mettler and Peyton, 2025), but this study represents the first time, to our knowledge, these approaches have been tested together in an SMG environment. Further, this study marks the first time the SMBR was used in experiments longer than 24 hours, and with intermittent periods of continuous flow. These achievements show promise for greater control of biofilms in spacecraft water systems, and greater flexibility of the reactor system and the experiments it can facilitate.
The experiments presented here build on the previously published results of similar biofilm control experiments performed by the authors at normal gravity in CDC biofilm reactors (Mettler and Peyton, 2025). Previously, all seven independent combinations of biofilm reduction methods were examined in addition to a control experiment that lacked any method to limit biofilm accumulation. Rather than repeating the same iterations in the SMBR, only three conditions are presented: a baseline without any biofilm control method, a reactor with only a coating as a biofilm control method (to relate to previous coating-only research published by the authors (Mettler et al., 2022)), and all three methods of biofilm control (coating, phosphorus removal, and silver fluoride biocide) as that combination most successfully reduced biofilm accumulation in the normal gravity experiments.
Sher-Loxane 800 ®, manufactured by The Sherwin-Williams Company, was used for this study to build on the previously published CDC reactor study (Mettler and Peyton, 2025). The general mechanism of action is to reduce microbial adhesion to act as a hydrophobic antifouling coating. Initial selection of this coating was informed by preliminary screening experiments comparing several candidate coatings (results not shown). As the coating is epoxy-based, its application within water-handling systems may raise questions regarding potential leaching and downstream water quality. The experiments here examine the use of a coating, biocide dosing, and phosphorus removal in the wastewater tank where downstream treatment could take place to remove possible contaminants prior to potable water generation and consumption. The authors do not present Sher-Loxane 800 ® as the coating that should be implemented into a spacecraft water system. It was chosen due to its efficacy compared to other candidates in initial CDC biofilm experiments, and even so, it still does not perform adequately on its own. Prior to implementing any coating in a water system (in spacecraft or on Earth), further testing for human safety, compatibility with water processing steps, duration of efficacy, and aspects such as mechanical durability must be examined. Alternatively, a functionally similar coating optimized specifically for use in spacecraft water systems could be developed.
Biofilm cell density using plate counts
When compared to the previously published normal gravity study using many of the same experimental parameters (Mettler and Peyton, 2025), the final viable biofilm density achieved in the SMBR was several orders of magnitude lower than in the CDC reactor experiments with the same four organisms, medium, and the same 7 d experiment duration (6.5 log10CFU/cm2 in the SMBR vs 8.4 log10CFU/cm2 in the CDC reactor). The SMBR was operated in alternating batch and continuous flow modes, so the lower biofilm density may be due to oxygen limitation, as the SMBR likely went through periods of lower oxygen concentration or anoxic operation compared to CDC reactors, which are very well mixed with a large headspace. The low shear stress required for SMG could have also contributed to lower viable biofilm density, as fluid shear helps transport substrate and nutrients to the biofilm surface and often tends to increase biofilm accumulation rates (Manuel et al., 2007; Tsagkari et al., 2022; Wang et al., 2022). Another possibility for lower viable biofilm density in the SMBR is the longer contact time of the biocide. In these experiments, the silver fluoride was added to the SMBR just prior to a 21 h batch phase (Figure 2), giving it sufficient contact time to kill accumulated biofilm, whereas in the CDC reactor (residence time of 160 min), biocide may have been washed out prior to an effective contact time during the sustained continuous flow.
In the SMBR, accumulated biofilm was only sampled 7 days after inoculation because biofilm sampling required the reactor rotation to be stopped, which reintroduces unidirectional gravity (normal gravity) into the system. Additionally, because the fluid in the reactor is assumed to achieve solid body rotation, any significant change to the rotation (i.e., stopping) would lead to a sudden increase of fluid shear force at the reactor walls. It is known that shear stress and fluid dynamics directly affect the formation and morphology of biofilms (Manuel et al., 2007; Tsagkari et al., 2022; Wang et al., 2022), and in the incredibly low shear stress environment of the SMBR, it is likely that the biofilms were much more loosely attached to the coupon surfaces, putting the biofilms at risk of premature detachment during sampling. The increased shear due to a short interruption of the no-slip boundary may remove accumulated biofilm from the coupons. So, to maintain SMG and prevent excess shearing events associated with intermittent stopping and starting of rotation, only endpoint (day 7) biofilm samples were collected from coupon surfaces. The reactor rotation was gradually slowed prior to sampling to reduce the shear stress on the biofilm.
The viable biofilm density of experiments without biofilm mitigation (Figure 3A) was very similar to that of experiments with the Sher-Loxane® 800 coating as the only method of biofilm control (Figure 3B). This is not an unexpected result considering that when the Sher-Loxane® 800 coating was used as the only method of biofilm control in CDC reactors, the final viable biofilm density was within 0.5 log10CFU/cm2 of the unmitigated biofilm accumulation (Mettler and Peyton, 2025). In the normal gravity CDC experiments, it appeared that the function of the coating was to delay biofilm accumulation by several days; however, since only endpoint sampling could occur in the SMBR experiments, it is impossible to know if a similar trend occurred here. For experiments with the coating, with phosphorus eliminated from the nutrient medium and daily silver fluoride biocide dosing, no viable biofilm was detected in either replicate using plate counts (Figure 3C). Even with another plating technique for the second replicate, which gave biofilm densities at two limits of detection (2.08 and 1.1 log10CFU/cm2), still no viable cells were recovered on selective or plain R2A agar plates. This is similar to what was previously reported in CDC reactors where the viable biofilm was present at approximately 1.5–2 log10CFU/cm2 density. This is a very promising result and indicates that these three methods of biofilm control may operate well together in a true microgravity environment like the ISS or Gateway.
Confocal images
The confocal microscopy images show that larger biofilm aggregates formed on uncoated coupons than on Sher-Loxane® 800-coated coupons (Figure 4A vs 4B). Also, fungal hyphae were observed on the uncoated coupons, which provided additional surface area for biofilm accumulation. The fluorescence of the coating itself in Figure 4B makes it difficult to ascertain whether conidial fungal cells were present or whether portions of the coating fluoresced at the same wavelength as the fungus (405 nm). There was a large decrease in the quantity of biomass present on the Sher-Loxane® 800-coated coupon in the reactor with no phosphorus that was dosed with silver fluoride daily (Figure 4C). In the image, the main source of biomass was from several conidial fungal cells, despite no viable cells (fungal or bacterial) being detected by plate counts (Figure 3C). All fungal cells were stained with Calcofluor white, whether they were viable or non-viable. So, it is difficult to state if the cells present in Figure 4C were viable but non-culturable (Pinto et al., 2015) or truly non-viable.
The differences in viable biofilm density between the CDC reactors (Mettler and Peyton, 2025) and the SMBR directly correlate with differences in biofilm appearance in confocal images. Biofilms in the confocal images presented here are much less robust than those grown in the CDC reactors, very likely due to the low shear stress, potential low oxygen availability, and longer contact time with the biocide, which are the same factors that likely resulted in lower viable biofilm accumulation as determined by the plate counts. Additionally, the sampling process for stopping the reactor and removing coupons for confocal imaging is much more gentle in the CDC reactor than in the SMBR. More biofilm detachment during sampling likely occurred in the SMBR than in the CDC reactor, which would also result in less robust biofilm in the confocal images presented in this paper.
Planktonic plate counts
In the SMBR, the daily planktonic samples taken during the continuous flow phase offered a method of tracking microbial activity throughout the experiments (Figure 3D-F). The trends in viable planktonic cell concentration on the final day of reactor operation generally follow the trends in viable biofilm density, except for a few instances. In reactors where the Sher-Loxane® 800 coating was the only method of biofilm control, R. insidiosa viable planktonic cell concentration was approximately 2 log10CFU/mL higher than B. contaminans (Figure 3E) despite the two species being present in the biofilm at approximately the same density (6 log10CFU/cm2; Figure 3B). This differs from previous observations in CDC reactors where the planktonic community in reactors with Sher-Loxane® 800 coating was dominated by B. contaminans (Mettler and Peyton, 2025). Additionally, in SMBR experiments with no biofilm control method (Figure 3D), the fungus was present in the planktonic community at a concentration approximately one order of magnitude higher than M. organophilum despite M. organophilum being present in the biofilm at a slightly higher density than C. mutabilis (Figure 3A).
FlowCam
Reduction in biofilm density (viable or non-viable) on surfaces is a key goal of the microbial control methods investigated in this study. Another major goal in reducing microbial contamination in spacecraft water systems is reducing biofilm aggregates present in bulk fluid. These aggregates pose clogging threats in the small diameters of spacecraft water system pipes and valves. FlowCam analysis of planktonic samples allows for an investigation into the morphologies of cellular aggregates in the bulk fluid, which may cause clogging in small-diameter tubing, filters, or valves (Zea et al., 2020; Zea et al., 2018). The aggregates from the untreated reactors are dominated by fungal hyphae, which serve as scaffolding for bacterial attachment. In the reactor treated with the coating only, the FlowCam images indicate a decrease in fungal hyphae over the course of the experiment. By day 4, the hyphae are almost entirely missing from the aggregate samples, and the aggregate sizes steadily decrease for the remainder of the experiment. However, the shift that occurred on the last sampling day, where the reactor with all three microbial control methods fostered some of the largest particles, is concerning. Since the day 7 samples were taken after the rotation was slowed (Day 7) or stopped (Day 7 RB), it is possible that the larger aggregates could have been due to biofilm detaching from the reactor walls or coupons due to changes in shear stress. The lack of viable biofilm cells detected on agar plates (Figure 3C) and lack of significant biomass on the coupons (Figure 4C) suggest that non-viable or viable but non-culturable biomass may have detached from the reactor surfaces. Further, the plate counts for planktonic concentration (Figure 3F) do not indicate the aggregates imaged by the FlowCam (Figure 5C) were viable. Multiple potential hypotheses for these observations suggest further research may be needed to understand the particles in reactors with coated walls, phosphorus limitation, silver fluoride dosing, and simulated microgravity.
Additionally, aggregates in reactors with the coating as the sole method of microbial control were optically much darker than aggregates in reactors with the coating, no phosphorus, and silver fluoride dosing. One potential explanation for these optical differences could be the accumulation of polyphosphates in the phosphate-containing medium. To our knowledge, the specific organisms used in these experiments have not been shown to produce polyphosphates; however, other Burkholderia and Ralstonia species have been shown to produce polyphosphates (Mullan et al., 2002; Tumlirsch et al., 2015) which often appear as darker areas in light microscope images. Some physical aggregation of phosphorus within bacteria grown with phosphate present could have potentially darkened the observed FlowCam images (Figure 5A-B), which may be why the aggregates of cells grown without phosphorus are optically clearer (Figure 5C). Additionally, biomass particles in experiments with all three methods of microbial control could have remained intact due to the EPS holding cells together despite potential autolysis of cells due to the silver fluoride (Li et al., 2018). The lysed cells could have resulted in optically clearer clumps of biomass. Large particles with fungal hyphal networks could become lodged in pipes, valves, and filters, acting as a net to catch additional particles flowing through. As such, in reactors featuring biofilm control measures, the reduction of fungal hyphae present in large aggregates is encouraging.
Conclusion
The experiments presented here report, for the first time, three methods of biofilm control used in combination during simulated microgravity tests. This study marks a large step toward accurately modeling the ISS water system on Earth by using direct ISS microbial isolates, a medium designed to mimic ISS wastewater, relevant materials of construction, and now a relevant acceleration regime. Results indicate that the Sher-Loxane® 800 surface coating, exclusion of phosphorus from the nutrient medium, and daily silver fluoride biocide doses offer promise for significant improvements for microbial control in spacecraft water systems. The novel SMBR was used for the first time outside of its initial design application, with the inclusion of continuous flow operation, a duration 7 times longer than the original study (Ketteler et al., 2025), and the use of a mixed-domain consortium of microorganisms. Successful observation of microbial growth within the reactor indicates promise for its continued use in other configurations and applications. Future expansion of the study presented here should include reinoculation of the organisms throughout the experiments and an increased duration past 7 days. Additional methods of microbial metabolic activity tracking, such as oxygen measurements, could help build further understanding of critical factors in biofilm formation and control in microgravity systems. Another powerful addition to these experiments would be ground testing of these combined biofilm control strategies in pilot systems and full-scale replicas of the ISS water recovery system.
Acknowledgements
This research could not have been done without the help of Matthew Culp, Stephan Warnat, and Christine Foreman, who were all instrumental in the design and optimization of the simulated microgravity reactor. Elizabeth Sandvik was immensely helpful with FlowCam imaging and the design of the nutrient medium and biofilm consortium. An additional thank you to Phil Stewart, who has worked to coordinate the EPSCoR effort at the Center for Biofilm Engineering. Imaging and image analyses were made possible by The Center for Biofilm Engineering (CBE) Bioimaging Facility (RRID:SCR_026519) at Montana State University, which is supported by funding from industry members of the CBE, the National Science Foundation MRI Program (2018562), the M. J. Murdock Charitable Trust (202016116), the US Department of Defense (77369LSRIP & W911NF1910288), and the National Institutes of Health (P20GM162003).
Notes
[1] Funding
Funding was provided by NASA through EPSCoR cooperative agreement 80NSSC21M0331. This work was supported by a NASA Space Technology Graduate Research Opportunity to HMK.
[2] Author Disclosure Statement
The authors jointly disclose commercial associations with The Sherwin-Williams Company, which has been an industrial affiliate of the Center for Biofilm Engineering since 2009. Brent Peyton participates in collaborative research with The Sherwin-Williams Company on a project funded by the Department of Defense. Madelyn Mettler, Haley Ketteler, and Brent Peyton have not received any direct funding from The Sherwin-Williams Company.
Notes
Supplementary
Supplemental Table 1.
Center for Biofilm Engineering (internal) and external strain identification numbers for the microorganisms from the consortium.
| Organism | Domain | Internal ID | Boeing ID | Sampling location | GenBank accession number |
|---|---|---|---|---|---|
| Burkholderia contaminans | Bacteria | ES1600 | 17-01563-1 | ISS Water processing assembly | GCA_022533485.1 |
| Methylobacterium organophilum | Bacteria | ES1612 | 15-01561-1 | ISS Oxygen generation assembly | GCA_022533465.1 |
| Ralstonia insidiosa | Bacteria | ES1604 | 19-597-yn-2 | ISS Water processing assembly | N/A |
| Coniochaeta mutabilis | Eukaryota | ES1639 | N/A-provided by MSFC* | ISS Water processing assembly | N/A |
Supplemental Table 2.
P-values from Tukey honestly significant difference tests for biofilm density. All treatment methods refers to the coating, biocide, and omission of phosphorus from nutrient medium. Values less than 0.05 have been bolded.
| Comparison | |||
|---|---|---|---|
| Species | No treatment – Coating only | Coating only – All treatment methods | No treatment – All treatment methods |
| B. contaminans | 0.0395 | <0.0001 | <0.0001 |
| M. organophilum | 0.1466 | 0.0071 | <0.0001 |
| R. insidiosa | 0.4009 | <0.0001 | <0.0001 |
| C.mutabilis | 0.0126 | 0.5824 | 0.0005 |
Supplemental Table 3.
P-values from Tukey honestly significant difference tests for planktonic density. Values less than 0.05 have been bolded.
| Comparison | Species | Day | p-value |
|---|---|---|---|
| Coating only - All treatment methods | B. contaminans | 1 | 0.5290 |
| No treatment - All treatment methods | B. contaminans | 1 | 0.4150 |
| No treatment - Coating only | B. contaminans | 1 | 0.9800 |
| Coating only - All treatment methods | M. organophilum | 1 | 0.9707 |
| No treatment - All treatment methods | M. organophilum | 1 | 0.9977 |
| No treatment - Coating only | M. organophilum | 1 | 0.9527 |
| Coating only - All treatment methods | R. insidiosa | 1 | 0.9776 |
| No treatment - All treatment methods | R. insidiosa | 1 | 0.5679 |
| No treatment - Coating only | R. insidiosa | 1 | 0.4443 |
| Coating only - All treatment methods | C. mutabilis | 1 | 0.9332 |
| No treatment - All treatment methods | C. mutabilis | 1 | 0.1985 |
| No treatment - Coating only | C. mutabilis | 1 | 0.0980 |
| Coating only - All treatment methods | B. contaminans | 2 | <0.0001 |
| No treatment - All treatment methods | B. contaminans | 2 | <0.0001 |
| No treatment - Coating only | B. contaminans | 2 | 0.9429 |
| Coating only - All treatment methods | M. organophilum | 2 | 0.0152 |
| No treatment - All treatment methods | M. organophilum | 2 | 0.1241 |
| No treatment - Coating only | M. organophilum | 2 | 0.6647 |
| Coating only - All treatment methods | R. insidiosa | 2 | <0.0001 |
| No treatment - All treatment methods | R. insidiosa | 2 | 0.0004 |
| No treatment - Coating only | R. insidiosa | 2 | 0.7876 |
| Coating only - All treatment methods | C. mutabilis | 2 | 0.5207 |
| No treatment - All treatment methods | C. mutabilis | 2 | 0.0001 |
| No treatment - Coating only | C. mutabilis | 2 | 0.0031 |
| Coating only - All treatment methods | B. contaminans | 3 | <0.0001 |
| No treatment - All treatment methods | B. contaminans | 3 | <0.0001 |
| No treatment - Coating only | B. contaminans | 3 | 0.8494 |
| Coating only - All treatment methods | M. organophilum | 3 | 0.0057 |
| No treatment - All treatment methods | M. organophilum | 3 | 0.0324 |
| No treatment - Coating only | M. organophilum | 3 | 0.8092 |
| Coating only - All treatment methods | R. insidiosa | 3 | <0.0001 |
| No treatment - All treatment methods | R. insidiosa | 3 | <0.0001 |
| No treatment - Coating only | R. insidiosa | 3 | 0.7499 |
| Coating only - All treatment methods | C. mutabilis | 3 | 0.8069 |
| No treatment - All treatment methods | C. mutabilis | 3 | 0.0003 |
| No treatment - Coating only | C. mutabilis | 3 | 0.0023 |
| Coating only - All treatment methods | B. contaminans | 4 | <0.0001 |
| No treatment - All treatment methods | B. contaminans | 4 | 0.0003 |
| No treatment - Coating only | B. contaminans | 4 | 0.8276 |
| Coating only - All treatment methods | M. organophilum | 4 | 0.0366 |
| No treatment - All treatment methods | M. organophilum | 4 | 0.2198 |
| No treatment - Coating only | M. organophilum | 4 | 0.6845 |
| Coating only - All treatment methods | R. insidiosa | 4 | <0.0001 |
| No treatment - All treatment methods | R. insidiosa | 4 | 0.0001 |
| No treatment - Coating only | R. insidiosa | 4 | 0.9861 |
| Coating only - All treatment methods | C. mutabilis | 4 | 0.2419 |
| No treatment - All treatment methods | C. mutabilis | 4 | 0.0028 |
| No treatment - Coating only | C. mutabilis | 4 | 0.1837 |
| Coating only - All treatment methods | B. contaminans | 5 | <0.0001 |
| No treatment - All treatment methods | B. contaminans | 5 | <0.0001 |
| No treatment - Coating only | B. contaminans | 5 | 0.2421 |
| Coating only - All treatment methods | M. organophilum | 5 | 0.0059 |
| No treatment - All treatment methods | M. organophilum | 5 | 0.1288 |
| No treatment - Coating only | M. organophilum | 5 | 0.4513 |
| Coating only - All treatment methods | R. insidiosa | 5 | <0.0001 |
| No treatment - All treatment methods | R. insidiosa | 5 | <0.0001 |
| No treatment - Coating only | R. insidiosa | 5 | 0.7019 |
| Coating only - All treatment methods | C. mutabilis | 5 | 0.6070 |
| No treatment - All treatment methods | C. mutabilis | 5 | 0.0002 |
| No treatment - Coating only | C. mutabilis | 5 | 0.0060 |
| Coating only - All treatment methods | B. contaminans | 6 | <0.0001 |
| No treatment - All treatment methods | B. contaminans | 6 | <0.0001 |
| No treatment - Coating only | B. contaminans | 6 | 0.8993 |
| Coating only - All treatment methods | M. organophilum | 6 | 0.2235 |
| No treatment - All treatment methods | M. organophilum | 6 | 0.2986 |
| No treatment - Coating only | M. organophilum | 6 | 0.9837 |
| Coating only - All treatment methods | R. insidiosa | 6 | <0.0001 |
| No treatment - All treatment methods | R. insidiosa | 6 | <0.0001 |
| No treatment - Coating only | R. insidiosa | 6 | 0.9938 |
| Coating only - All treatment methods | C. mutabilis | 6 | 1.0000 |
| No treatment - All treatment methods | C. mutabilis | 6 | 0.0076 |
| No treatment - Coating only | C. mutabilis | 6 | 0.0076 |
| Coating only - All treatment methods | B. contaminans | 7 | <0.0001 |
| No treatment - All treatment methods | B. contaminans | 7 | <0.0001 |
| No treatment - Coating only | B. contaminans | 7 | 0.7546 |
| Coating only - All treatment methods | M. organophilum | 7 | 0.1868 |
| No treatment - All treatment methods | M. organophilum | 7 | 0.0586 |
| No treatment - Coating only | M. organophilum | 7 | 0.8473 |
| Coating only - All treatment methods | R. insidiosa | 7 | <0.0001 |
| No treatment - All treatment methods | R. insidiosa | 7 | <0.0001 |
| No treatment - Coating only | R. insidiosa | 7 | 0.8322 |
| Coating only - All treatment methods | C. mutabilis | 7 | 0.8069 |
| No treatment - All treatment methods | C. mutabilis | 7 | 0.0006 |
| No treatment - Coating only | C. mutabilis | 7 | 0.0046 |
| Coating only - All treatment methods | B. contaminans | 7 RB | <0.0001 |
| No treatment - All treatment methods | B. contaminans | 7 RB | <0.0001 |
| No treatment - Coating only | B. contaminans | 7 RB | 0.7489 |
| Coating only - All treatment methods | M. organophilum | 7 RB | 0.2067 |
| No treatment - All treatment methods | M. organophilum | 7 RB | 0.1213 |
| No treatment - Coating only | M. organophilum | 7 RB | 0.9591 |
| Coating only - All treatment methods | R. insidiosa | 7 RB | <0.0001 |
| No treatment - All treatment methods | R. insidiosa | 7 RB | <0.0001 |
| No treatment - Coating only | R. insidiosa | 7 RB | 0.6046 |
| Coating only - All treatment methods | C. mutabilis | 7 RB | 1.0000 |
| No treatment - All treatment methods | C. mutabilis | 7 RB | 0.0017 |
| No treatment - Coating only | C. mutabilis | 7 RB | 0.0017 |
Supplemental Table 4.
Magnification and replicate information from the largest daily particle captured from the FlowCam samples as represented in Figure 6.
| Treatment method | Untreated | Sher-Loxane 800 | Sher-Loxane 800, no phosphorus, AgF dosing | |||
|---|---|---|---|---|---|---|
| Day | Rep. | Mag. | Rep. | Mag. | Rep. | Mag. |
| Day 1 | 2 | 10x | 1 | 10x | 1 | 10x |
| Day 2 | 1 | 10x | 2 | 10x | 2 | 10x |
| Day 3 | 1 | 4x | 2 | 10x | 2 | 10x |
| Day 4 | 2 | 4x | 2 | 10x | 1 | 10x |
| Day 5 | 1 | 4x | 2 | 10x | 1 | 10x |
| Day 6 | 1 | 10x | 2 | 10x | 1 | 10x |
| Day 7 - Eff | 1 | 10x | 1 | 10x | 2 | 10x |
| Day 7 - RB | 2 | 10x | 2 | 10x | 2 | 10x |