
Extraterrestrial containerized plant production holds significant promise for supporting astronauts' dietary and mental well-being during long-term space exploration (Haeuplik-Meusburger et al., 2014). In 2019, NASA initiated the Ohalo III Crop Production System to prototype crop production systems for extended space missions, focusing on testing water delivery systems and volume optimization concepts under microgravity conditions (i.e., 0 g) (Johnson et al., 2021). Simultaneously, containerized plant production on Earth (at 1 g) within controlled environments, such as greenhouses and residential households, is gaining traction due to growing concerns about food and water security (Fields et al., 2021). Advancements in containerized crop production systems, both on Earth and in space, emphasize automation in managing canopy environments (light, humidity, and temperature) and root zone fluid delivery (water, oxygen, and nutrients) to reduce labor and resource use. Recent developments in plant growth modules aboard the International Space Station (ISS), including the Advanced Plant Habitat (APH) system (Monje et al., 2020) and the Veggie system (Massa et al., 2017), range from active pumping systems to passive capillary-driven systems. The APH system employed an active pumping system similar to past space-based plant cultivation experiments, including ADVASC (Link et al., 2003) and BPS (Morrow and Crabb, 2000), in which irrigation is scheduled or manually operated based on monitored root zone water status. In contrast, the Veggie system was the first to implement a nonpowered, passive irrigation approach. This system utilized a root pillow filled with a porous medium, with one side interfacing with a water reservoir via a wicking material (Massa et al., 2017). However, Veggie encountered challenges, with excess water and poor root zone aeration (Massa et al., 2017; Monje et al., 2020).
Capillary-driven passive fertigation is a simple and widely used method for maintaining water availability in the root zone under Earth's gravity. For example, Stutte et al. (2011) successfully demonstrated plant cultivation using a prototype of the Veggie system under Earth gravity. However, understanding the hydrodynamics of porous media becomes imperative, especially when transitioning between Earth's gravity and microgravity conditions. Hydrodynamics in porous media is influenced by surface and capillary forces acting against Earth's gravitational force, while surface and capillary forces are dominant under microgravity conditions. To illustrate this concept, consider how filter paper absorbs water after one end is placed in contact with a surface. The wetting front travels upward through the paper's fiber matrix in response to capillarity, but the rate of rise diminishes as water climbs higher above the water surface. The balancing act between Earth's gravitational force and the capillary and surface forces of the filter paper matrix eventually limits the height to which water climbs, resulting in a partially saturated paper. However, under microgravity conditions, water imbibition into filter paper is not restrained by gravity, resulting in saturated paper. This same principle likely explains the excess water accumulation observed in capillary-driven fertigation systems under microgravity conditions.
The hydraulic properties of porous media, especially the water retention characteristics (WRC), also play a crucial role in hydrodynamics. WRC is essential in various disciplines such as soil science, hydrology, and engineering, as it defines a porous medium's volumetric water content (θ) and hydraulic energy state, namely, matric potential (h), under both saturated and unsaturated conditions. WRC depends on the pore size distribution of the porous medium and the interfacial properties of air, water, and solid phases (Hillel, 1998). The hysteretic nature of WRC, which manifests differently during drying and wetting processes (Pham et al., 2005), is particularly relevant in plant production, where evapotranspiration and irrigation subject the porous medium to alternating drying and wetting processes. Studies indicate that the hysteretic WRC of porous media on Earth applies similarly in microgravity conditions (Heinse et al., 2005, 2007, 2015).
This research proposed and evaluated a simple passive fertigation management approach for microgravity to achieve and regulate θ and/or h, in porous media based on the WRC. The proposed innovation incorporates a spring-loaded check valve between the water reservoir and the porous membrane embedded within the porous medium, creating an improved passive fertigation system suited for microgravity conditions. Under Earth's gravity conditions, Jones and Or (1998a) previously implemented a check valve to maintain negative h within a containerized sand for wheat cultivation. That system operated 80 days without root zone moisture sensors or active water pumping. The check valve enabled one-way nutrient solution transport based on the hydraulic potential difference (ΔH) that developed periodically between the valve's inlet and outlet. That ΔH increase begins within the porous medium as roots take up water and evaporation takes place at the porous medium's surface. The reduced water content translates into a more negative h within the root zone, which translates through the porous membrane into the water supply at the outlet side of the check valve. We note that the porous membrane characteristic is critical and must have a more negative air entry pressure than the opening pressure of the check valve to maintain a continuous water-filled domain between the reservoir and membrane within the porous medium. Air entering the membrane as θ decreases and h becomes more negative would result in loss of the required suction within the porous membrane, leading to failure of this key mechanism. When the ΔH across the check valve reaches the threshold value, water is released from the reservoir through the check valve, thereby slowly increasing the water content within the root zone until the ΔH across the valve no longer exceeds the threshold potential difference at a less negative root zone h. Furthermore, the check valve's threshold ΔH ensures that the porous medium never becomes saturated. Additionally, by selecting check valves with different threshold ΔH, multiple growth containers can be maintained at different matric potential values while being connected to the same reservoir. This adaptability allows the system to be tailored to the hydraulic properties of different porous media and the water requirements of various plant species. The primary objective of this research was to demonstrate plant cultivation using an improved passive fertigation system. Further discussions address the potential application of this system under microgravity conditions.
The foundational hydrodynamics of porous media physics involves key components, including volumetric water content (θ, cm3 cm−3) and matric potential (h, cm), pressure potential (p, cm), gravitational potential (z, cm) and hydraulic potential (H, cm). Although these potentials can be expressed in pressure units such as Pascals (Pa), it is also common to express them as the height of a water column that would exert the same pressure, also referred to as head (1 cm = 98 Pa). The hydraulic potential, denoted as H = h + p + z, represents the combined energy contributions from matric-, pressure- and gravitational-potentials. The terms h (always negative) and p (always positive) are mutually exclusive, and h is generally associated with an unsaturated porous medium, while p corresponds to a saturated condition, e.g., below the water table. The z term is critical for any gravity field and is defined as the vertical location of interest relative to a reference position (typically z = 0 cm), e.g., the soil surface or bottom of a porous medium container. In this study, the reference position was set at z = 0 cm at the bottom of the growth medium container.
The widely used water retention model developed by van Genuchten (1980) (hereafter the VG model), initially derived on Earth, has also been applied to microgravity conditions (Heinse et al., 2005, 2007, 2015). The VG model is expressed as follows:
Coarse-textured granular porous media, specifically, aggregated calcined clay, have been widely used as plant growth substrates under microgravity conditions (Heinse et al., 2015). Calcined clay can be autoclaved to minimize the risk of bacterial and fungal contamination (Yendler, 1998). This material generally exhibits a larger particle size and a narrow particle size distribution, facilitating controlled θ within a relatively small h range (Jones et al., 2012). Calcined clay from Profile Products LLC (Buffalo Grove, IL) has been extensively used in space-based plant growth applications (Morrow and Crabb, 2000; Link et al., 2003; Heinse et al., 2005, 2007, 2015; Massa et al., 2017; Khodadad et al., 2020; Monje et al., 2020). Three different particle size ranges were tested: Profile Greens Grade (Profile, 0.300–0.850 mm), Turface Proleague (Turface, 1.19–2.38 mm) and a 1:1 volume ratio of Profile and Turface (Mix, 0.300–2.38 mm), as shown in Figure 1. Their physical properties, including particle density (ρs), bulk density (ρb), porosity (φ = 1 – ρb/ρs), and hysteretic water retention parameters, have been well documented (Heinse et al., 2007; Dixon et al., 2023) and are summarized in Table 1.

Calcined clay with three particle size ranges: Profile (0.300–0.850 mm), Turface (1.19–2.38 mm) and Mix (0.300–2.38 mm).
Physical properties, including particle size distribution, particle density (ρs), bulk density (ρb), the computed porosity (φ = 1 – ρb/ρs), and hysteretic water retention parameters for the VG (1980) model and the computed target volumetric water content (θt) and matric potential (ht) in Profile, Turface, and Mix
| Profile | Turface | Mix | |||
|---|---|---|---|---|---|
| Physical Properties | |||||
| Particle size distribution | mm | 0.25–1 | 1–2 | 0.25–2 | |
| Particle density† | ρs | g cm−3 | 2.52 | 2.52 | 2.52 |
| Bulk density | ρb | g cm−3 | 0.63 | 0.64 | 0.69 |
| Porosity (φ = 1 – ρb/ρs) | φ | 0.75 | 0.75 | 0.73 | |
| Hydraulic properties | |||||
| Drying process | |||||
| VG model parameters‡ | θr | cm3 cm−3 | 0.34 | 0.34 | 0.32 |
| θs | cm3 cm−3 | 0.72 | 0.73 | 0.72 | |
| α | cm−1 | 0.099 | 0.19 | 0.11 | |
| n | 7.7 | 5.6 | 3.9 | ||
| Computed parameters | θt | cm3 cm−3 | 0.57 | 0.57 | 0.56 |
| ht | cm | −9.8 | −5.1 | −9.1 | |
| Wetting process | |||||
| VG model parameters‡ | θr | cm3 cm−3 | 0.34 | 0.34 | 0.32 |
| θs | cm3 cm−3 | 0.69 | 0.68 | 0.64 | |
| α | cm−1 | 0.19 | 0.32 | ||
| n | 4.4 | 4.1 | 2.9 | ||
| Computed parameters | θt | cm3 cm−3 | 0.55 | 0.54 | 0.51 |
| ht | cm | −5.2 | −3.1 | −6.2 | |
Calcined clay exhibits two primary pore structures: interaggregate and intra-aggregate pores. Given the need for a greater h control range (wet substrate) to prevent root drought stress (dry substrate) in controlled environments (Lieth and Oki, 2019), our study focused on the interaggregate pore region, corresponding to the h range of −25 < h < 0 cm.
The experimental setup of the passive fertigation system is illustrated in Figures 2A and 2B. Each porous medium (Profile, Turface, and Mix) was packed into a cylindrical plastic column (10.8 cm diameter, 10 cm height, 916 cm³ volume). The bottom of each column was sealed to a corrugated plastic sheet, and the reference elevation (z = 0 cm) was set at the bottom of the column. A porous cup (ASC-025B, Pawfly, https://www.amazon.co.jp/-/en/Pawfly-Cylinder-Diffuser-Release-Aquarium/dp/B0998GHLNV?th=1), typically used as an air stone in aquariums, was positioned at z = 5 cm within the porous medium to deliver water and nutrient solution. A pressure transducer (PX-40-50GHG5V, ± 67 cm, Omega Engineering, Norwalk, CT) was installed between the check valve and the porous cup using a 3-way stopcock to monitor h values at z = 5 cm in the porous medium. The pressure transducers provided ± 0.1 cm precision in h measurements. Figure 2A presents a top-down view of the setup, highlighting the pressure transducer installation. Air-dried Turface, Profile, and Mix were packed using the multiple-sieve pluviation (MSP) method (Dixon et al., 2023) to ensure consistent ρb values (Table 1). The MSP method facilitated random particle scattering, improving packing uniformity (Miura and Toki, 1982). While Dixon et al. (2023) used a 5.1 cm diameter column, a larger funnel (10.2 cm diameter) was employed in this study to accommodate the 10.8 cm diameter columns. A base layer of the porous medium, approximately 4 cm thick, was initially packed before placing the porous cup at the center of the container. The remaining porous medium was then packed around it. The experiment targeted 60% effective saturation (0.6Se) to promote optimal biomass production (Fatzinger and Bugbee, 2022). The target volumetric water content (θt) was determined using VG model, where the left side of Eq. (2) was set to 0.6. The corresponding target matric potential (ht) was obtained by rearranging Eq. (1) for h and substituting θt. Since the plant cultivation experiments involved an initial drying process, the calculations for determining the target matric potential (ht) and volumetric water content (θt) were based on the drying water retention curve. The computed values of each porous medium are listed in Table 1.

(A) Top-down view and (B) schematic illustration of the passive fertigation system. Key components include the growth medium, porous cup, check valve and Mariotte bottle reservoir.
The passive fertigation system consisted of 1) a nutrient solution reservoir (i.e., Mariotte bottle for 1 g application), 2) a spring-loaded check valve, 3) a porous cup (membrane) and 4) the porous medium. Fertigation was regulated by the spring-loaded check valve (SCV08053, Nordson Medical, Westlake, OH) with two positive threshold ΔH values between the inlet and the outlet of H (ΔH = Hi – Ho) to open and close the valve, ΔHvo and ΔHvc, respectively. These threshold values in the check valves were determined using a hanging water column.
The 20 L Mariotte bottle contained Hoagland #1 nutrient solution (EC = 1 dS m−1; Hoagland and Arnon, 1938) and was sealed with two tubes exiting the air-tight rubber stopper: one tube serving as an air inlet/free-water surface and the other as a siphon tube. The Mariotte bottle maintained a constant h = 0 cm (free-water surface) at the bottom of the air inlet tube (zm), ensuring a constant H value (Mccarthy, 1934; Holden, 2004). The siphon tube in the Mariotte bottle was hydraulically connected to the check valve, the pressure transducer, the porous cup, and the porous medium, as long as it remained water-filled. Black tubing, filled with nutrient solution, connected all components while minimizing light exposure to prevent algae growth.
Figure 3 provides an enlarged illustration of the check valve mechanism. The valve consists of a spring-loaded rubber disk, allowing one-way liquid flow (i.e., right to left). The check valve's inlet and outlet hydraulic potentials (Hi and Ho) are represented by gray dashed- and blue solid lines, respectively. The inlet of the check valve was connected to the fertigation reservoir, while the outlet was connected to the porous cup embedded in the porous medium. The Hi value was set as a constant, adjusted by the Mariotte bottle's inlet tube elevation (zm), and could be a negative or positive value. In contrast, the Ho value generally remained negative in response to the evaporation/transpiration processes of the porous medium, i.e., the dominant unsaturated conditions within the porous medium. The green solid line indicates ΔHvo, which represents the threshold H difference across the check valve required for opening the valve, while the pink solid line indicates ΔHvc, representing the threshold ΔH required for closing the valve. Water delivery from the reservoir through the check valve is governed by the condition Hi – Ho > ΔHvo. When this condition is met, the valve opens, allowing nutrient solution to flow into the porous medium. In response to the liquid flow, Hi – Ho decreases as water content increases, and once Hi – Ho falls below ΔHvc (i.e., Hi – Ho ≤ ΔHvc), the valve closes, preventing wetting above the target water content.

Illustration of hydraulic potential (H) dynamics in the fertigation system. Enlarged diagrams of the check valve show the opening/closing mechanism during drying and wetting of the porous medium, with inlet (Hi) and outlet (Ho) hydraulic potentials, as well as threshold hydraulic potential differences (ΔHvo and ΔHvc).
Table 2 shows computed values of H components in the passive fertigation system under Earth-gravity conditions for Profile. The porous cup (zt = 5 cm) was designed to maintain a target matric potential (ht = −9.8 cm). Under quasi-hydrostatic conditions, the H value in Profile and at the check valve outlet (Ho), which was hydraulically connected, was equal to −4.8 cm. On the other hand, the H value in the Mariotte bottle was set at 3.8 cm by adjusting the air-entry tube position (zm). Under hydrostatic equilibrium conditions, the H value in the Mariotte bottle and at the check valve inlet (Hi) remained equal to 3.8 cm. There is therefore an H difference of ΔH = Hi – Ho = 8.6 cm across the check valve. The Ho value can be more negative due to the facilitated evaporation and transpiration from the porous medium, reducing h. To open the valve, the Ho value has to be more negative to overcome the threshold ΔH to open the valve (i.e., ΔHvo < Hi – Ho). Once the check valve opens, the Ho value increases (becomes less negative) due to the fertigation, while the ΔH value decreases. When the ΔH across the check valve becomes smaller than the ΔHvc (i.e., Hi – Ho < ΔHvc), the fertigation stops. This self-regulating mechanism enabled passive and on-demand fertigation without active sensors. The air inlet position in the Mariotte bottle (zm) was primarily determined by three factors: ht, zt, and the average value of the threshold potential difference for opening and closing the valve (ΔHv). The relationship among these components can be expressed as
Computed hydraulic potential components in the fertigation system under Earth's gravity at quasi-hydrostatic condition in profile.
| Gravitational Potential | Matric Potential | Hydraulic Potential | ΔH across the Check Valve | |
|---|---|---|---|---|
| Components | z | h | H (=z + h) | ΔH =Hi–Ho |
| cm | cm | cm | ||
| Profile | zt = 5 | ht = −9.8 | −4.8 | |
| Check valve outlet | 10 | −14.8 | Ho = −4.8 | Hi–Ho = 8.6 |
| Check valve inlet | 10 | hi = −6.2 | Hi = 3.8 | |
| Mariotte bottle | zm = 3.8 | Atmosphere = 0 | 3.8 |
As shown in Figure 2A, the surface of each container was covered with a disk featuring two holes (3 cm in diameter) to minimize mineral precipitation from nutrient solution evaporation. Prior to seed placement, all porous media were fully saturated with nutrient solution and then drained using an external stainless steel tube vertically inserted along the container wall. Drainage was halted once the measured h values at the center of the container reached −5 cm, corresponding to a hydrostatic equilibrium where h = 0 cm at the bottom of the container and linearly decreased with increasing gravitational potential toward the surface. This procedure was conducted on Day 0 and Day 30 to ensure consistent initial water distribution for two consecutive cultivation experiments. Three romaine lettuce seeds (Lactuca sativa cv. “Paris Island;” Johnny's Selected Seeds, Winslow, ME) were placed on the surface of the porous media, positioned over the holes in the surface disk (Figure 2A). Each container contained two holes, resulting in six seeds per container. After seedling emergence, one seedling per hole (two per container) was selected for continued growth, while the remaining four seedlings were removed. If seedlings were too small or failed to emerge, replacements from a wet paper towel germination trial conducted on the same sowing days were transplanted. After 30 days, plants were harvested, and fresh leaf masses were recorded. Dry leaf mass was measured after oven-drying the harvested leaves at 70°C for 48 h. Fresh- and dry-leaf masses were normalized per surface area (86.6 cm2) to compute average values and standard deviations for each container. Plant growth was maintained under T40-fluorescent lighting, providing 227±7.3 μmol m−2 s−1 of photosynthetic photon flux density (PPFD) at the leaf surface. The light cycle was set to 16 h per day (5 pm to 9 am). The height of the light source was adjusted as plants grew to maintain a minimum clearance of 10 cm between the top leaves and the light fixture. The nutrient solution level in each Mariotte bottle was monitored using pressure transducers, which triggered refilling when the level dropped below 10 cm. All pressure transducers were connected to a data logger (CR1000, Campbell Scientific, Logan, UT) to monitor the medium's h value at the 5 cm depth and the water level remaining in the Mariotte bottle. Data were logged every 10 s, and a 1-min moving average was recorded. Before the plant cultivation experiment, all pressure transducers were calibrated using a hanging water column to derive calibration offset and slope regression values.
Although passive fertigation provided automatic h regulation in the growth media, weekly manual maintenance was required. Accumulation of trapped air in the tubing between the check valve and the porous cup potentially disconnects the hydraulic connection to the porous media, necessitating repriming. Additionally, overpressuring during manual cleaning could damage the pressure transducer's internal membrane, allowing air entry and further disrupting measurements. Repriming was conducted by injecting 20 mL of nutrient solution with a syringe after disconnecting the tubing from both the Mariotte bottle and the pressure transducer. Disinfection of tubing and connections (i.e., manifolds and three-way stopcock) was performed to prevent biofilm clogging during the third and fourth weeks of the second trial by injecting 4% hydrogen peroxide solution, followed by nutrient solution flushing. Biofilm accumulation in fertigation lines can reduce water flow (Elasri and Miller, 1999; Lee and Lee, 2015; van Os et al., 2021), potentially compromising water and nutrient delivery. Since oxygen gas is released when hydrogen peroxide reacts with biofilms, any trapped gas was removed by injecting the nutrient solution after the disinfection process.
Figures 4A–4C show the hysteretic water retention of Profile, Turface and Mix using the hysteretic water retention model parameters (Eq. (1)) listed in Table 1. Solid and dashed-dotted lines represent the drying and wetting water retention curves, respectively. The particle size range and its distribution substantially influence WRC, with Turface (1–2 mm) exhibiting a smaller air-entry potential and steeper slopes compared to the finer-textured Profile and Mix. The θt and ht were computed using the drying water retention curve; the respective values are listed in Table 1 and depicted in Figures 4A–4C. Across all porous media, θt values ranged from 0.56 and 0.57 cm3 cm−3, while ht values were −9.8, −5.1, and −9.1 cm for Profile, Turface, and Mix, respectively. Due to its coarser texture, Turface exhibited a higher ht compared to Profile and Mix.

(A–C) Hysteretic water retention curves for different media, modeled using VG parameters from Table 1. (D–F) Temporal variation of hourly average h measurements. Red star symbols indicate manual maintenance events; black solid lines show hourly averages of h; blue dashed lines mark the computed ht corresponding to 60% effective saturation (0.6Se) (from A–C, Table 1).
The porous cup, serving as a subsurface fertigation emitter (1.5 cm in diameter, 2.5 cm in height), had an air entry potential of 60 ± 6.5 cm and was installed at z = 5 cm via an elbow fitting. Table 3 presents the threshold ΔH for opening and closing the check valve, ΔHvo and ΔHvc, respectively. There was about a 2.8 cm difference in ΔHvo and ΔHvc, indicating that water delivery through the valve needs a greater H difference to open the valve than to close it. Table 4 presents the computed air inlet position (zm) of the Mariotte bottle using Eq. (2) with zt = 5 cm, ht, and ΔHv. Since Profile and Mix had similar zm values of 3.8 and 3.5 cm, respectively, they were connected to a single Mariotte bottle with a unified zm value of 3.6 cm. In contrast, the higher ht in Turface (ht = −5.1 cm) required a greater value of 7.3 cm. Table 4 also presents the expected porous media's h value to trigger opening and closing the check valve in Profile, Turface, and Mix. These values were computed by rearranging Eq. (3) and substituting the ΔHvo (or ΔHvc) value instead of ΔHv.
Threshold ΔH value for opening (ΔHvo) and closing (ΔHvc) of the check values.
| ΔHvo | ΔHvc | |
|---|---|---|
| cm | cm | |
| Profile | 9.8 ± 0 | 7.0 ± 0.87 |
| Turface | 8.7 ± 0.058 | 5.8 ± 0.75 |
| Mix | 8.7 ± 0.68 | 5.8 ± 0.64 |
Computed air-inlet tube position (zm) in the Mariotte bottle using Eq. (3), the ht, and the expected h values in the center of each porous medium by substituting ΔHvo and ΔHvc into Eq. (3) in Profile, Turface, and Mix.
| Computed zm | ht | Expected threshold porous media's h | ||
|---|---|---|---|---|
| Valve opening | Valve closing | |||
| cm | cm | cm | ||
| Profile | 3.8 | −9.8 | −11 | −8.2 |
| Turface | 7.3 | −5.1 | −6.4 | −3.5 |
| Mix | 3.5 | −9.1 | −10.2 | −7.3 |
The black solid lines in Figures 4D–4F show the hourly average value of h in triplicated Profile, Turface, and Mix containers over the 60-day cultivation period, which included two consecutive 30-day trials. At the start of each cultivation trial, all porous media were saturated, followed by drainage to semicontainer capacity (h = −5 cm at the container center). This resulted in a rapid decrease in h from saturation during the first week of both trials. The red star (*) symbols in Figures 4D–4F mark h spikes caused by manual maintenance, including pressure transducer replacements, repriming of water lines, and biofilm removal using hydrogen peroxide solution. Standard deviations of mean hourly h measurements in triplicate containers were 1.2, 1.9, and 1.8 cm over the consecutive 60-day plant cultivation period in Profile, Turface, and Mix, respectively. Those hourly average h values (blue dashed lines) demonstrated a gradual drift within 10 days after each sowing event, migrating from the semicontainer capacity value to ht = −9.8, −5.1, and −9.1 cm in Profile, Turface, and Mix, respectively.
We further show the individual hourly h in triplicate Profile containers during the early growth period (0–10 days) to the late growth period (18–28 days) as solid lines in Figures 5A and 5B. The yellow bands in Figures 5A and 5B represent the 16 h of photoperiod from 5 pm to 9 am. Dashed gray lines represent the constant Hi value of 3.8 cm and the dotted pink and green lines represent the equilibrant H values in Profile to trigger opening and closing the valve, based on the ΔHvc and ΔHvo values, respectively. These pink and green lines also correspond to the expected h (= H – zt) values in Profile to trigger opening and closing the check valve as well (Table 4). During the early growth period (0–10 days) in Figure 5A, all three h values fluctuated above the expected h values to trigger opening and closing the valve, while all three h measurements in Figure 5B were maintained between the expected threshold h lines.
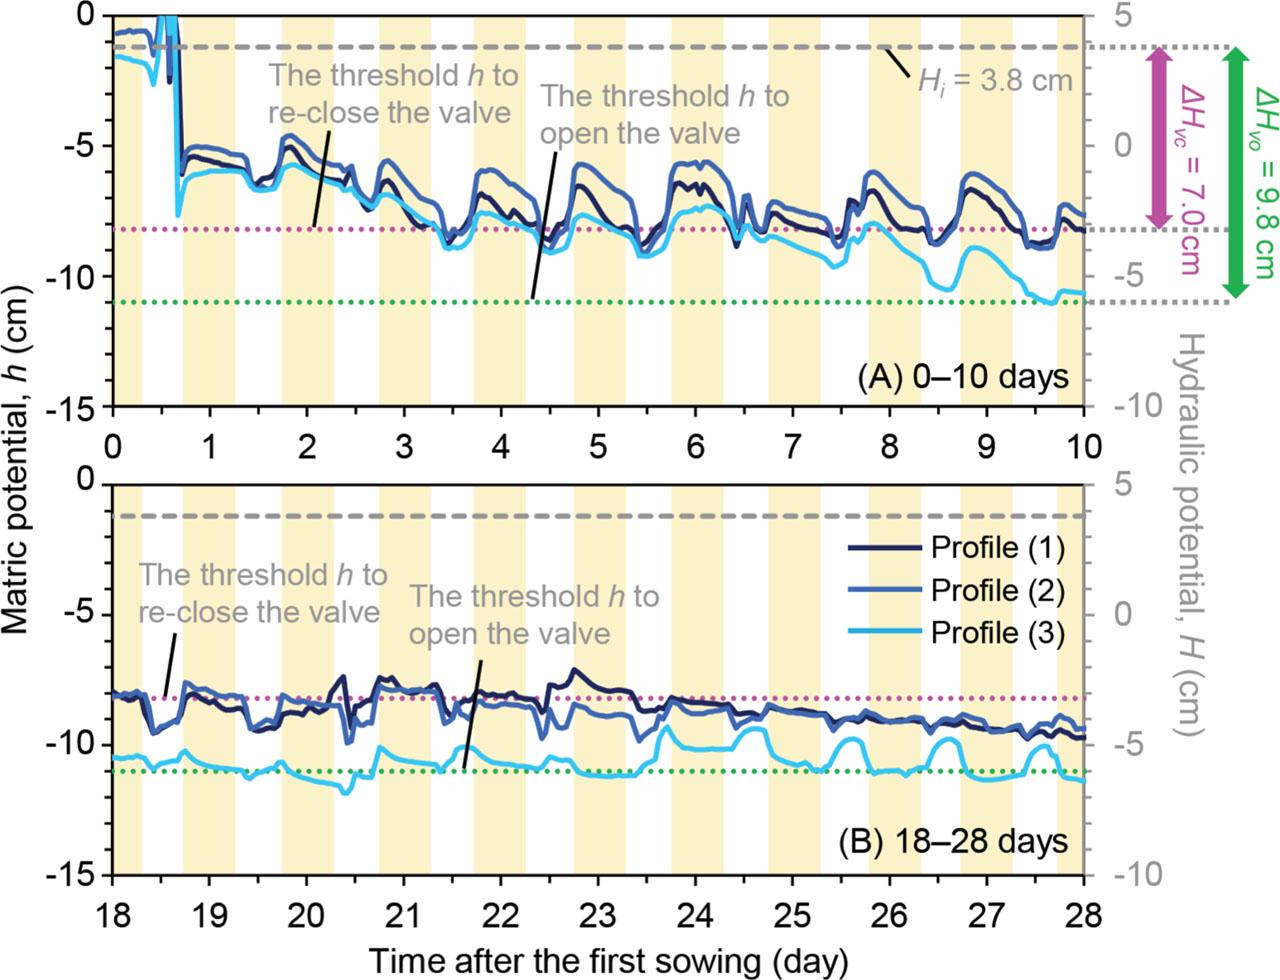
Diurnal h measurements in three Profile containers and corresponding H values for the irrigation system during (A) 0–10 days and (B) 18–28 days of the plant cultivation trial.
In Figure 5A, we observed a diurnal trend in h measurements exhibiting a rapid increase at the beginning of the photoperiod and a subsequent gradual decrease during the photoperiod. This was then reversed during the dark period, showing that the h rapidly declined, followed by a gradual increase throughout the remainder of the dark period. During the late growth period (18–28 days) in Figure 5B, however, the diurnal h in each container exhibited less diurnal fluctuation but somewhat resembled a step-like shape as the photoperiod and night period cycled. We also observed the opposite trend in the light blue line (Profile (3); Figure 5B), where the h exhibited an increase during the night period while showing reduced h during the photoperiod. In addition to the diurnal fluctuation in h, you can see the gradual decreasing trend in h from the early growth period (Figure 5A) to the late period (Figure 5B), likely caused by the combined effect of the facilitated transpiration rate due to the plant growth and the mechanical change in the threshold value of opening and closing the valve (i.e., Hvo and Hvc).
We explored the possibility of trapped air between the check valve and altering the check valve mechanics, leading to a change in the Hvo and Hvc values. Therefore, repriming was conducted on Day 15 and 21 for Turface (Figure 4E) and Day 21 for Mix (Figure 4F) to remove trapped air in the water lines and the check valve. This trapped air likely originated from the accumulation of dissolved air released from fertigation water and air retained in the porous cup. Additional h fluctuations were observed during pressure transducer replacements (Day 37 in Profile and mix, Figures 4D and 4F) and biofilm cleaning (Day 47 and 54 in all containers, Figures 4D–4F). During hydrogen peroxide cleaning, gas release from tubing connected to the containers was observed due to the oxidation of biofilm, confirming the effectiveness of biofilm removal. These findings underscore the importance of periodic cleaning and light-blocking tubing in fertigation systems to prevent biofilm accumulation. However, after the repriming or even cleaning the water line, we did not observe a decrease in value in the standard deviation of the hourly average h value.
Table 5 shows the average and standard error values for fresh- and dry-leaf mass per container for Profile, Turface, and Mix after 30 days of cultivation across two trials. The first trial, fresh-and dry-mass values ranged from 45.2 to 57.5 g and 2.49 to 2.96 g, respectively. In the second trial, yields were slightly lower, ranging from 32.0 to 46.6 g in fresh mass and 2.07 to 2.86 g in dry mass. Despite these reductions, no significant differences were observed between trials. Across both trials, all porous media exhibited similar dry biomass, suggesting that the passive fertigation system effectively maintained root zone moisture conditions suitable for plant growth.
Average and standard error values of the fresh- and dry-leaf mass per container (surface area 86.6 cm2) filled with Profile, Turface, and Mix.
| Fresh Mass | Dry Mass | |||
|---|---|---|---|---|
| 1st trial | 2nd trial | 1st trial | 2nd trial | |
| g | g | g | g | |
| Profile | 49.5 ± 16.1 | 32.0 ± 7.79 | 2.78 ± 0.80 | 2.72 ± 0.50 |
| Turface | 45.2 ± 20.0 | 38.0 ± 19.2 | 2.49 ± 1.06 | 2.07 ± 0.20 |
| Mix | 57.5 ± 7.15 | 46.6 ± 9.32 | 2.96 ± 0.37 | 2.86 ± 0.58 |
This study demonstrated a passive fertigation system that integrates a check valve H regulation and a Mariotte bottle. The target matric potential (ht) was determined to achieve 60% of relative saturation (0.6 Se) based on the drying process of WRC of three porous media with different particle size ranges: Profile (0.300–0.850 mm), Turface (1.19–2.38 mm), and Mix (0.300–2.38 mm). To regulate fertigation, we introduced Eq. (3) to calculate the air entry tube position (zm) in the Mariotte bottle relative to the reference level (z = 0 cm) at the bottom of the porous medium. This equation accounts for gravitational, matric, pressure, and water-potentials across system components, including the porous medium and check valve. An example of the passive fertigation system is shown in Figures 2A and 2B, while the corresponding potential components are summarized in Table 2.
Our lettuce cultivation experiment demonstrated two consecutive cultivations of romaine lettuce, with both yields exceeding the average fresh mass reported by Massa et al. (2017) for passive fertigation systems, which recorded 15.29 g on Earth and 20.61 g under microgravity conditions. However, a direct comparison is limited due to differences in lettuce cultivars and growth conditions (e.g., light sources, growth area, nutrient formulation, and growth period).
Figures 6A and 6B compare the passive fertigation system under Earth gravity and microgravity conditions, using a porous cup emitter connected to a nutrient solution reservoir via a check valve. Our system integrates a check valve H regulation with a Mariotte bottle, focusing on fertigation design for plant production under microgravity. Under microgravity conditions, the Mariotte bottle would be replaced with a lightweight, collapsible water bag commonly used as a water reservoir under microgravity conditions. On Earth, the Mariotte bottle can maintain a constant gravitational potential, making check valve regulation optional. However, in microgravity, the Mariotte bottle mechanism becomes ineffective due to the absence of gravitational potential. Instead, passive fertigation must rely on the check valve's threshold ΔH, which controls the nutrient solution's flow.

Passive fertigation system with potential diagrams at different positions (a–c: growth medium at different heights, d: check valve outlet, e: check valve inlet, f: water reservoir) under (A) Earth and (B) microgravity conditions.
Figures 6A and 6B illustrate potential diagrams of the passive fertigation system under Earth and microgravity conditions. Black, red, and blue lines represent gravitational (z), matric (h), and hydraulic (H = z + h) -potentials, respectively. In this simplified illustration, the reservoir connected to the check valve's inlet yields a constant Hi, and the check valve provides a threshold hydraulic potential difference, ΔHv, regulating the growth media's H. In reality, however, the check valve exhibited hysteresis in the threshold ΔHv, which yielded two different ΔHv values for opening and closing the valve, ΔHvo and ΔHvc, respectively. Evaporation from the growth medium's surface and the nutrient solution uptake by plant roots induced by transpiration leads to reduced H in the porous medium, increasing the H difference across the check valve, triggering fertigation when the ΔH exceeds ΔHvo. Once the fertigation increased H in the porous medium and decreased the H difference across the check valve, fertigation is terminated when ΔH becomes smaller than ΔHvc. These two threshold values allowed a range of H in the growth medium determined by the mechanical characteristics of the check valves.
Characterizing individual ΔHvo and ΔHvc values is critical for precisely designing passive fertigation systems. Our preliminary ΔHvo measurements were about 2.9 cm lower than ΔHvc. (Table 3). These two different threshold values provided a range of h values of growth media instead of maintaining a constant h value during the cultivation period. During the plant cultivation experiment, we observed compelling diurnal fluctuation in the growth media's h. The distinct diurnal fluctuation in h was observed during the early growth period, showing that the h measurements fluctuated at slightly greater h values (wetter condition) than the expected operational h range. However, during the late growth period, h measurements exhibited more obscure diurnal fluctuation within the expected operational range, and the growth media's h exhibited relatively stable values. Further research is needed for evaluating ΔHvo and ΔHvc values when the check valve's inlet is connected to a water reservoir providing a constant H while the check valve's outlet is connected to a compound layer of porous membranes, consisting of the porous cup fertigation emitter, the growth medium, and the plant roots. Additionally, we could not confirm whether the check valve remained fully- or partially-open or whether it cycled between opening and closing, especially during the late growth period, when higher water fluxes are common. Although we monitored h in the middle of the container, specifically between the porous cup and check valve, additional potential monitoring between the water reservoir and the check valve could provide further insights into check valve dynamics, including opening/closing timing and the actual ΔH during cultivation. We assumed constant ΔHvo and ΔHvo values for each check valve over the 60-day experiment; however, further research is needed to evaluate the long-term effects on the check valve's opening/closing mechanism.
Although this study did not aim to optimize the target volumetric water content and matric potential value for maximum plant yield, these values can be optimized based on the porous media's physical and hydraulic characteristics (i.e., hysteretic water retention) as well as the water requirements specific to plants. Jones and Or (1998b) noted that porous media selection is often empirical, based on the availability rather than on hydraulic principles. Raviv et al. (2004) emphasized that proper fertigation strategies should be implemented after selecting appropriate porous media. Additionally, Wallach (2008) highlighted the importance of choosing the correct process of WRC (drying versus wetting) to calculate ht, as hysteresis significantly affects water retention.
Monitoring h using pressure transducers provides valuable diagnostics for detecting fertigation failures (e.g., over- or under-fertigation) and scientific insights into root zone conditions. However, some transducers displayed atmospheric pressure readings, likely due to the leakage on the internal membrane or discontinuities between the sensor and the water line. Trapped air in the porous cup or tubing may also release air bubbles into the water line, disrupting the hydraulic connectivity. Ensuring hydraulic continuity between pressure transducers and the water line is critical for accurate h monitoring. Future protocols should include standardized air-removal procedures and sensor replacement guidelines.
To prevent biofilm clogging, we selected black tubing for water lines. However, translucent manifolds and three-way stopcocks facilitated biofilm and algae buildup, requiring hydrogen peroxide cleaning. Although implementing light blocking components would prevent diagnosing the accumulation of air and potential blocking of liquid discharge from the porous cup, future improvements could include 1) using fully black tubing to eliminate algae formation and anti-microbial components (e.g., silver- or copper-infused) to prevent biofilm growth and fouling; 2) integrating a bypass system (e.g., four-way stopcocks) to allow cleaning solution circulation without disrupting fertigation; and 3) implementing inline water filtration systems to minimize contamination during long-term experiments.
In this study, we introduced a passive fertigation system designed for application under microgravity conditions using aggregated porous media with three distinct particle size ranges: Profile (0.300–0.850 mm), Turface (1.19–2.38 mm), and Mix (0.300–2.38 mm). The system was composed of three key components: 1) fertigation delivery through a check valve opened via evapotranspiration; 2) a water reservoir (collapsible for microgravity adaptation); and 3) a containerized porous membrane, regulating H by maintenance of negative hydraulic potentials above the membrane bubbling pressure. The integration of a check valve within the water line enabled on-demand fertigation, which is based on ΔH values developing between the valve's inlet and outlet. The check valve dynamically opened when the potential difference exceeded the valve opening threshold difference, ΔHvo, and closed when the potential difference fell below the closing threshold difference, ΔHvc. This system demonstrated an efficient, nonpowered fertigation approach without active pumping. The passive fertigation system offers a cost-effective solution for both Earth and microgravity conditions, supporting sustainable plant production. Successful implementation requires a fundamental understanding of porous media hydrodynamics, including water, gravitational, and matric potentials. To improve applicability for Earth-based scenarios, we introduced a simple equation to calculate the air-entry tube position (zm) in the Mariotte bottle for fine-tuning target potentials. This equation incorporates gravitational and matric potentials of system components (i.e., check valve and porous medium) and can be adapted for microgravity conditions by setting the gravitational potential to zero. The target hydraulic potential, ht, was determined by analyzing the drying process of the WRC of each porous medium. The check valve mechanism enabled independent matric potential (h) regulation for each containerized porous medium, even when connected to a shared water reservoir with a constant hydraulic potential. This flexibility allows customization based on porous media hydraulic properties and potentially optimizes fertigation for different plant species. While this study establishes a foundation for integrating check valves into passive fertigation systems for on-demand water delivery, further validation is needed. Future research should focus on further understanding the dynamic mechanism of check valves and hysteretic behavior during long-term plant cultivation experiments.