
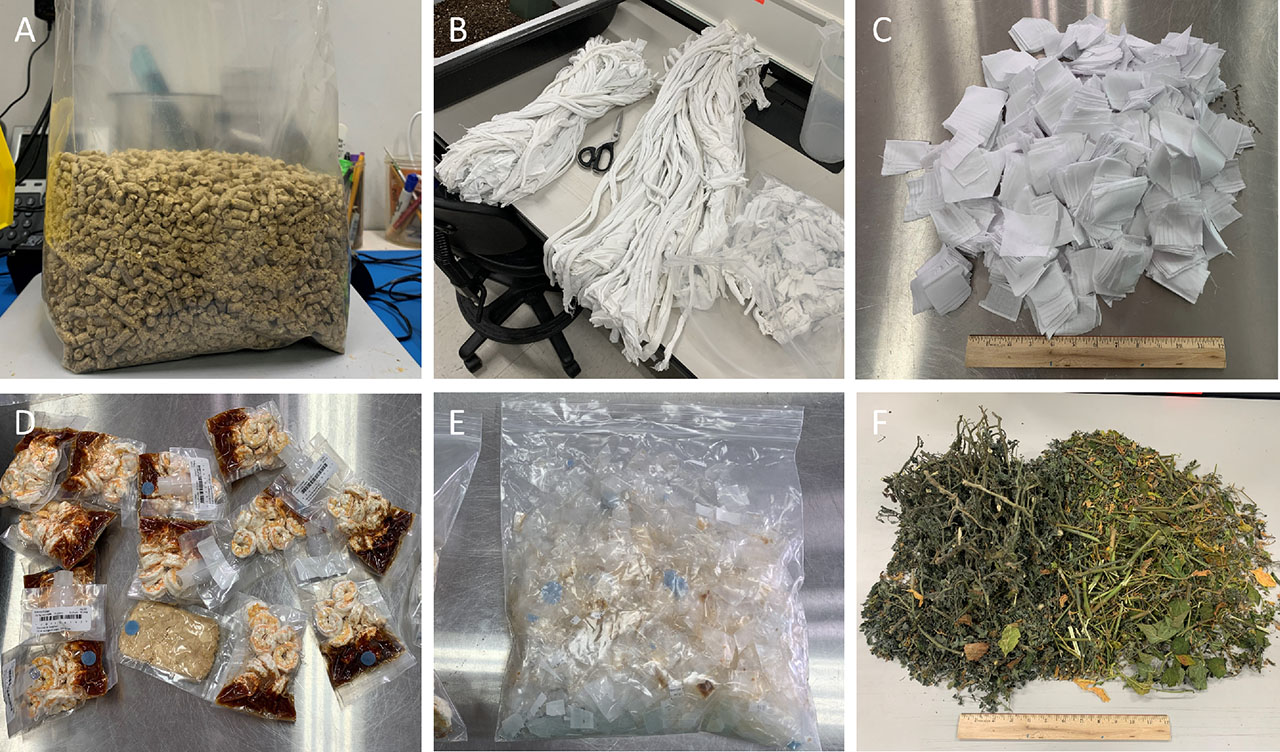
Figure 1.
(A) Wheat straw and soy hull pellets mixed together. (B) Cotton t-shirt rags torn into strips as well as cut into small square pieces. (C) Handkerchiefs cut into small square pieces. (D) Astronaut food packaged in a rehydratable pouch made from a composite polymer containing nylon, EVOH, and LDPE. (E) Food packaging plastic waste (with food residue) cut into 1-cm square pieces. (F) Inedible biomass from various crops that were dried and ready to be processed.
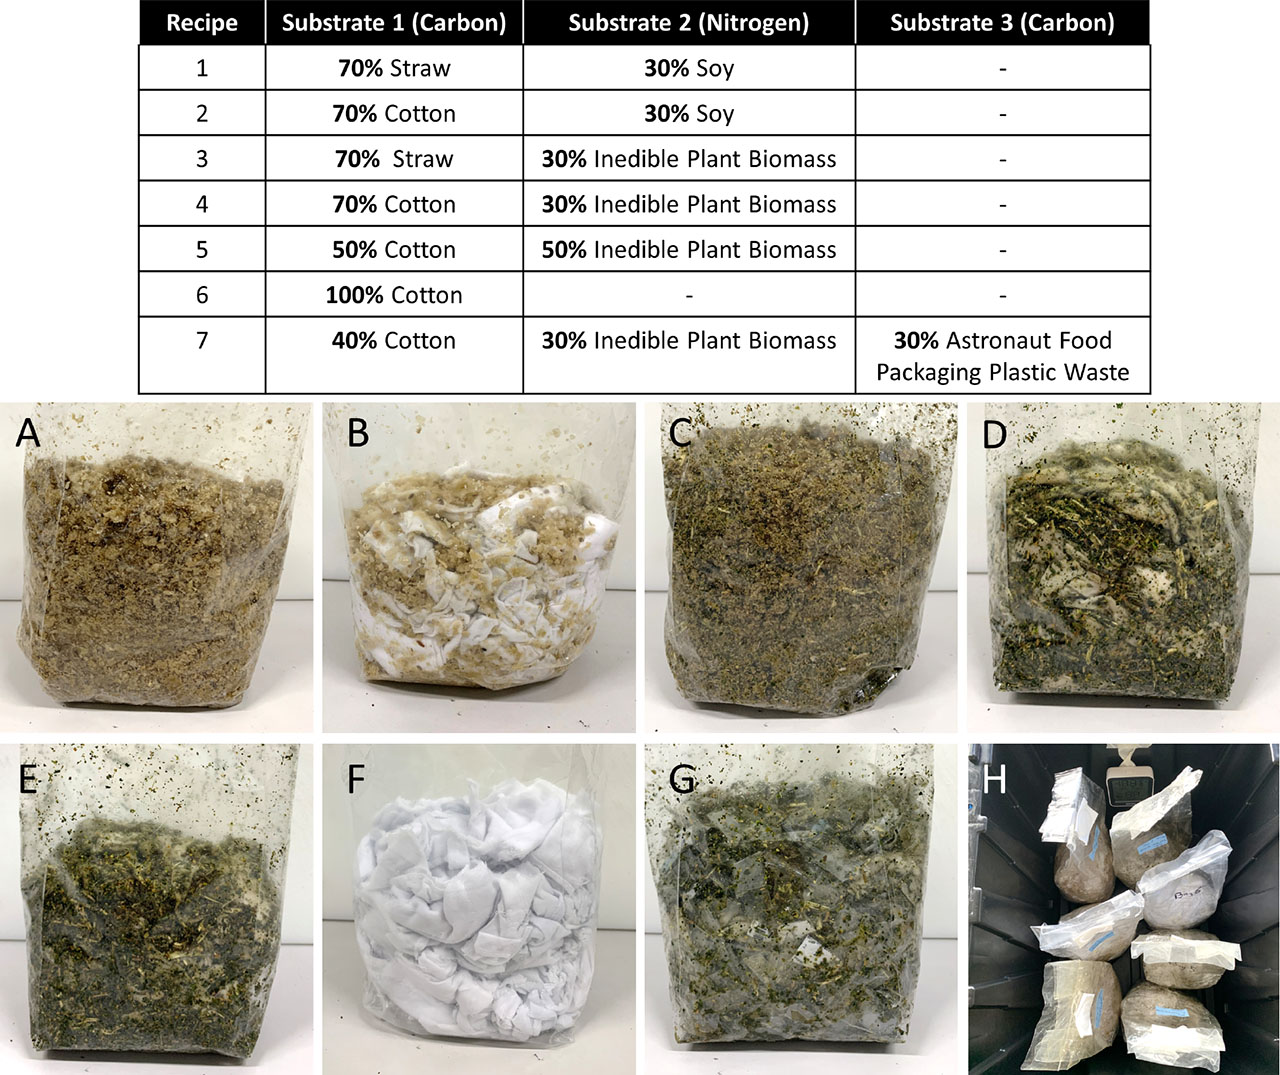
Figure 2.
List of substrate recipes and their carbon/nitrogen ratios inside their respective grow bags before sterilization. (A) Recipe 1—70/30 Straw/Soy. (B) Recipe 2—70/30 Cotton/Soy. (C) Recipe 3—70/30 Straw/Inedible. (D) Recipe 4—70/30 Cotton/Inedible. (E) Recipe 5—50/50 Cotton/Inedible. (F) Recipe 6—100 Cotton. (G) Recipe 7—40/30/30 Cotton/Inedible/Packaging. (H) Aerial view of sterilized and inoculated grow bags inside a dark spawn run container.
Table 1.
Respective dry-weight amounts of each substrate added to each recipe for all three trials. IPB, inedible plant biomass; AFP, astronaut food packaging plastic waste.
| Recipe | Substrate | Rep 1 | Rep 2 | Rep 3 |
|---|---|---|---|---|
| 1 | 70% Straw | Straw = 162.72 g | Straw = 159.96 g | Straw = 159.42 g |
| 30% Soy | Soy = 69.40 g | Soy = 68.00 g | Soy = 68.79 g | |
| 2 | 70% Cotton | Cotton = 159.25 g | Cotton = 159.06 g | Cotton = 159.31 g |
| 30% Soy | Soy = 70.59 g | Soy = 68.46 g | Soy = 68.14 g | |
| 3 | 70% Straw | Straw = 158.59 g | Straw = 159.33 g | Straw= 159.40 g |
| 30% IPB | IPB = 68.21 g | IPB = 68.24 g | IPB = 68.82 g | |
| 4 | 70% Cotton | Cotton = 159.33 g | Cotton = 159.18 g | Cotton = 159.37 g |
| 30% IPB | IPB = 67.98 g | IPB = 68.30 g | IPB = 68.59 g | |
| 5 | 50% Cotton | Cotton = 113.22 g | Cotton = 113.59 g | Cotton = 113.15 g |
| 50% IPB | IPB = 113.30 g | IPB = 113.30 g | IPB = 114.04 g | |
| 6 | 100% Cotton | Cotton = 228.03 g | Cotton = 227.44 g | Cotton = 227.37 g |
| 7 | 40% Cotton | Cotton = 91.01 g | Cotton = 91.01 g | Cotton = 91.76 g |
| 30% IPB | IPB = 68.79 g | IPB = 68.34 g | IPB = 68.29 g | |
| 30% AFP | AFP = 68.23 g | AFP = 69.91 g | AFP = 69.94 g |
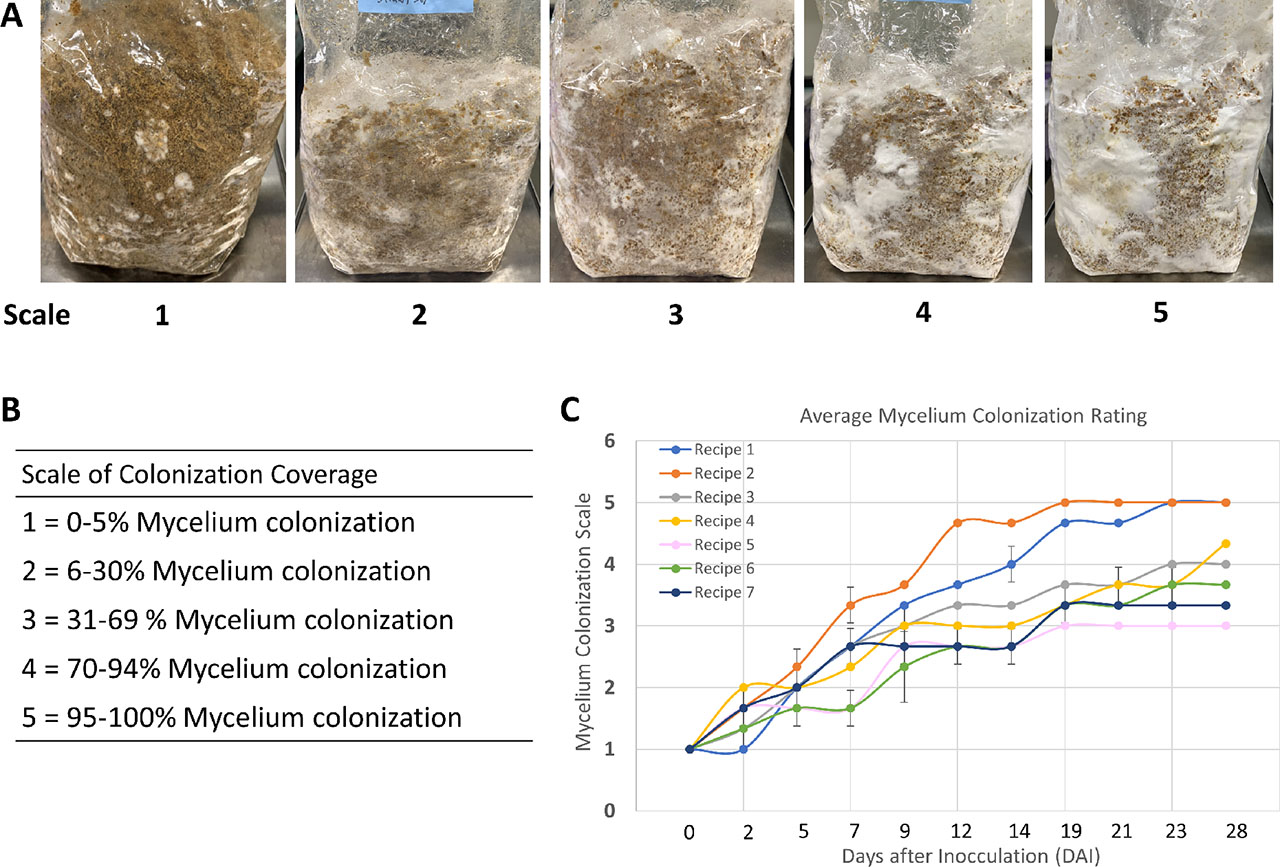
Figure 3.
(A) Examples of the colonization rating scale of SPX mycelium during the spawn run on wheat and soy pellets (control). (B) Detailed characteristics of the colonization coverage scale. (C) Graph of the average mycelium colonization scale for all seven substrate recipes in all three replicates. Error bars represent the standard deviation across the three replicates. Detailed colonization ratings can be found in the Supplementary Data.
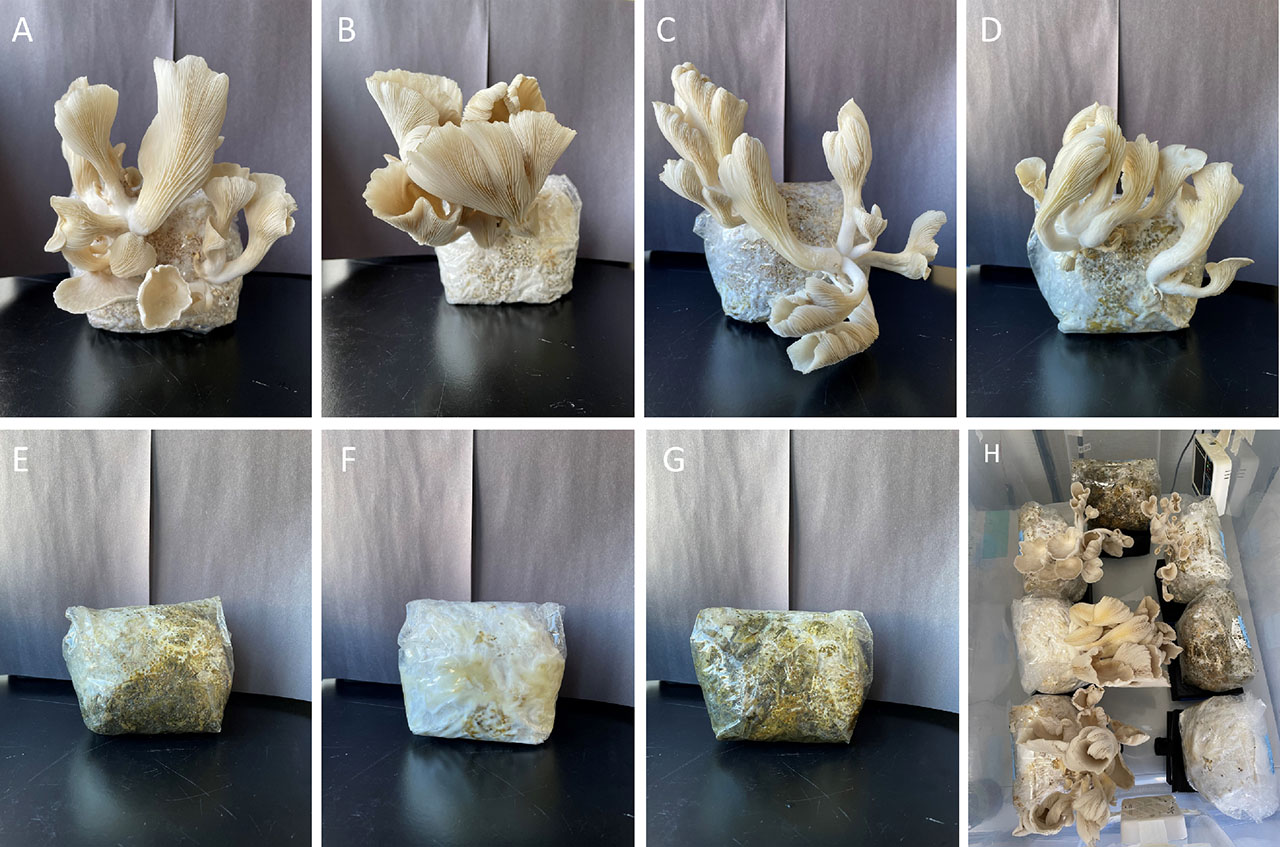
Figure 4.
Fruiting representation on day of harvest for Rep 1. (A) Recipe 1. (B) Recipe 2. (C) Recipe 3. (D) Recipe 4. (E) Recipe 5. (F) Recipe 6. (G) Recipe 7. (H) Aerial view of mushroom grow bags inside the cultivation chamber prior to harvest.
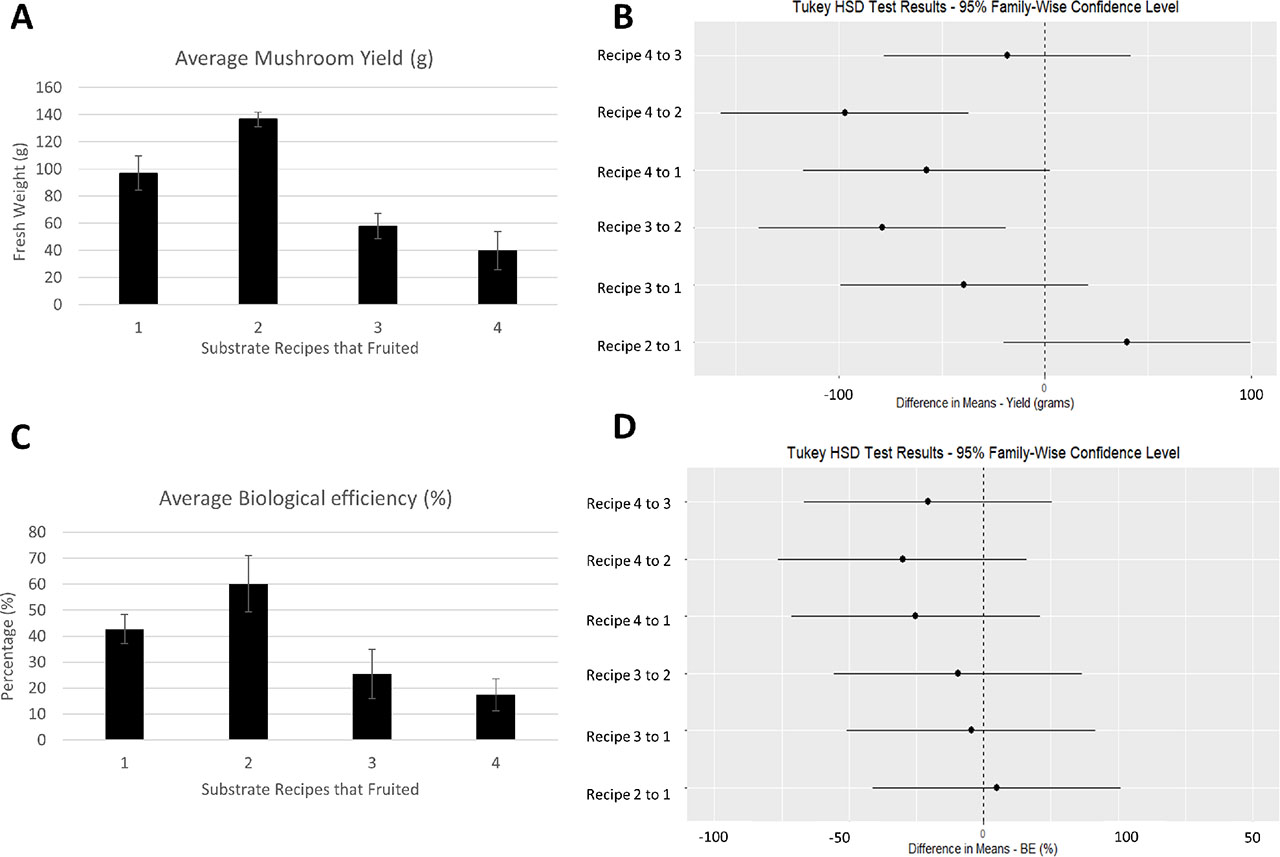
Figure 5:
Comparative yield of mushrooms and biological efficiency from various waste substrates. (A) Graphical representation of the average fresh weight (g) harvested from each substrate recipe that fruited. Error bars indicate the standard deviation from all three replicates. (B) One-way ANOVA with Tukey’s correction for the average fresh weights from recipes 1 to 4. (C) Graphical representation of the average biological efficiency percentage from each substrate recipe that fruited. Error bars indicate the standard deviation from all three trials. (D) One-way ANOVA with Tukey’s correction for the calculated biological efficiency from recipes 1 to 4.
Table 2.
First signs of primordia growth for each recipe in terms of days after fruiting initiation (DAI) and time in days for primordia from each recipe to develop prior to uniform harvest date (total number of days for fruiting: Rep 1 = 15 days; Reps 2 and 3 = 13 days).
| Rep/Recipe | First sign of fruiting (DAI) | Time allowed to fruit (days) | Total days from fruiting to harvesting | ||||||
|---|---|---|---|---|---|---|---|---|---|
| 1 | 2 | 3 | 1 | 2 | 3 | 1 | 2 | 3 | |
| 1 | 10 | 3 | 3 | 5 | 10 | 10 | 15 | 13 | 13 |
| 2 | 9 | 6 | 6 | 6 | 7 | 7 | 15 | 13 | 13 |
| 3 | 12 | 9 | 9 | 3 | 4 | 4 | 15 | 13 | 13 |
| 4 | 13 | 9 | 4 | 2 | 4 | 9 | 15 | 13 | 13 |
| 5 | - | - | - | - | - | - | - | - | - |
| 6 | - | - | - | - | - | - | - | - | - |
| 7 | - | - | - | - | - | - | - | - | - |
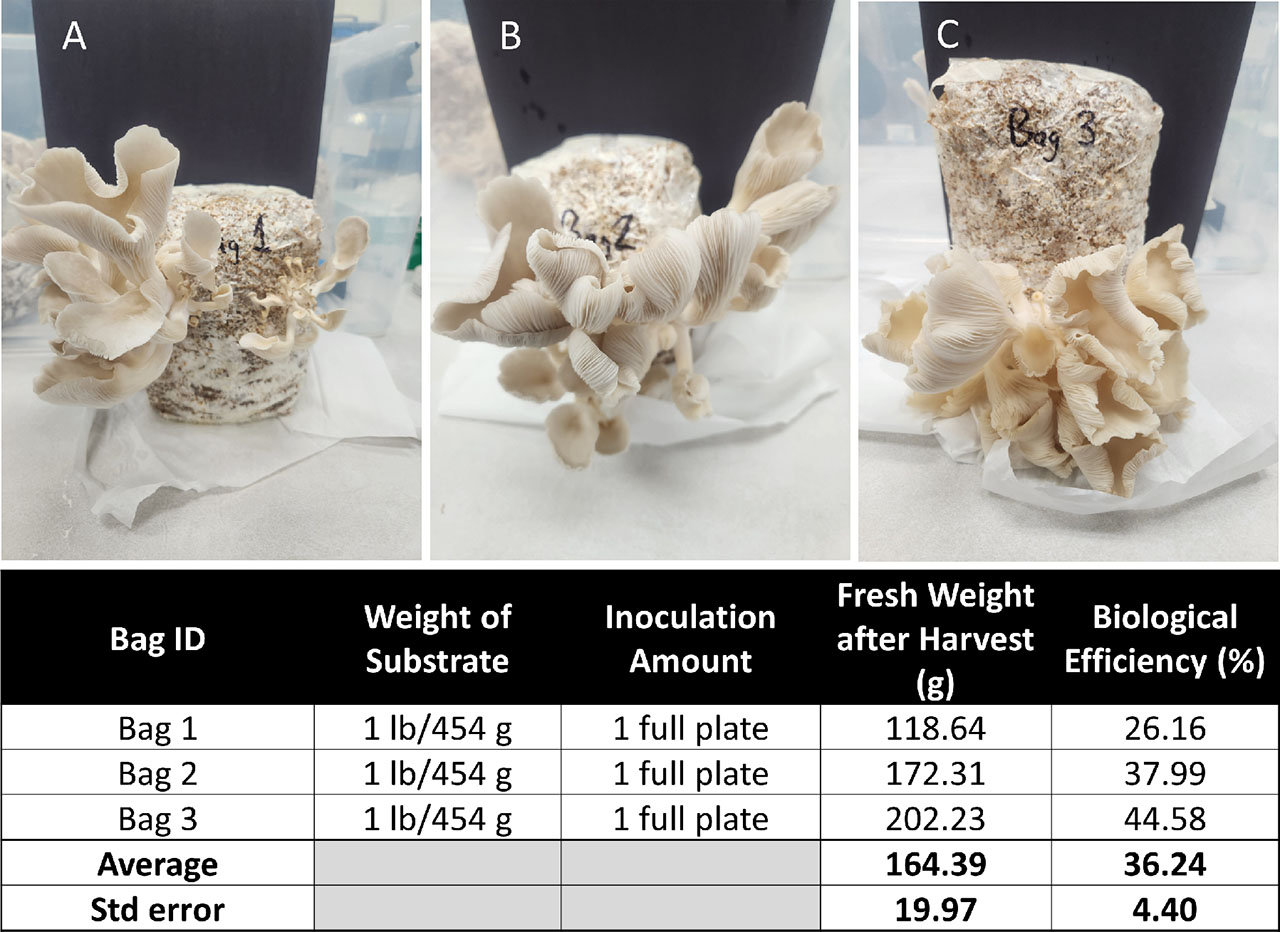
Figure 6.
Comparative yield analysis of SPX on 70/30 Straw/Soy 1lb substrate bags when inoculated with mycelium from a single layer of fully colonized standard PDA plates.
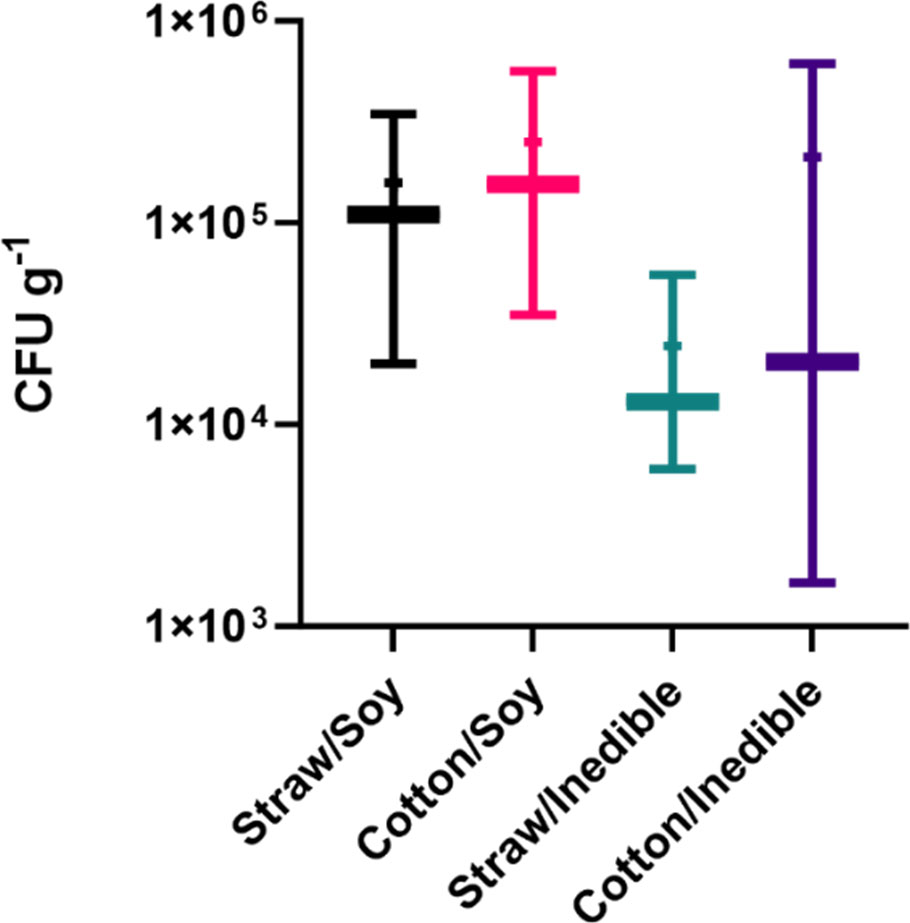
Figure 7.
Bacterial APC on TSA from mushrooms grown on four different substrates. Substrates were mixed 70/30 for each combination (recipes 1–4). Bars represent minimum and maximum values. Mean is shown by +, n = 3.
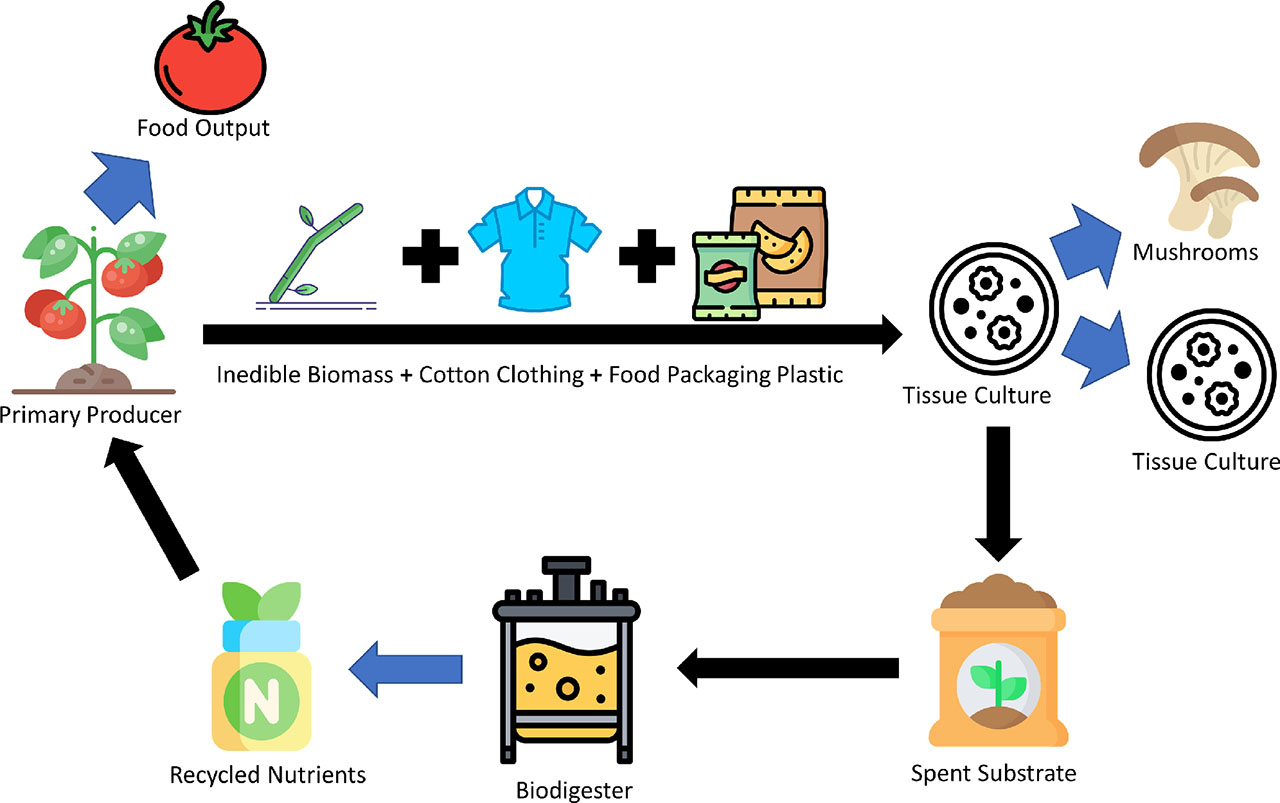
Figure 8.
Conceptual system-level diagrams of the ideal nutrient cycle of plants and mushrooms for BLiSS.
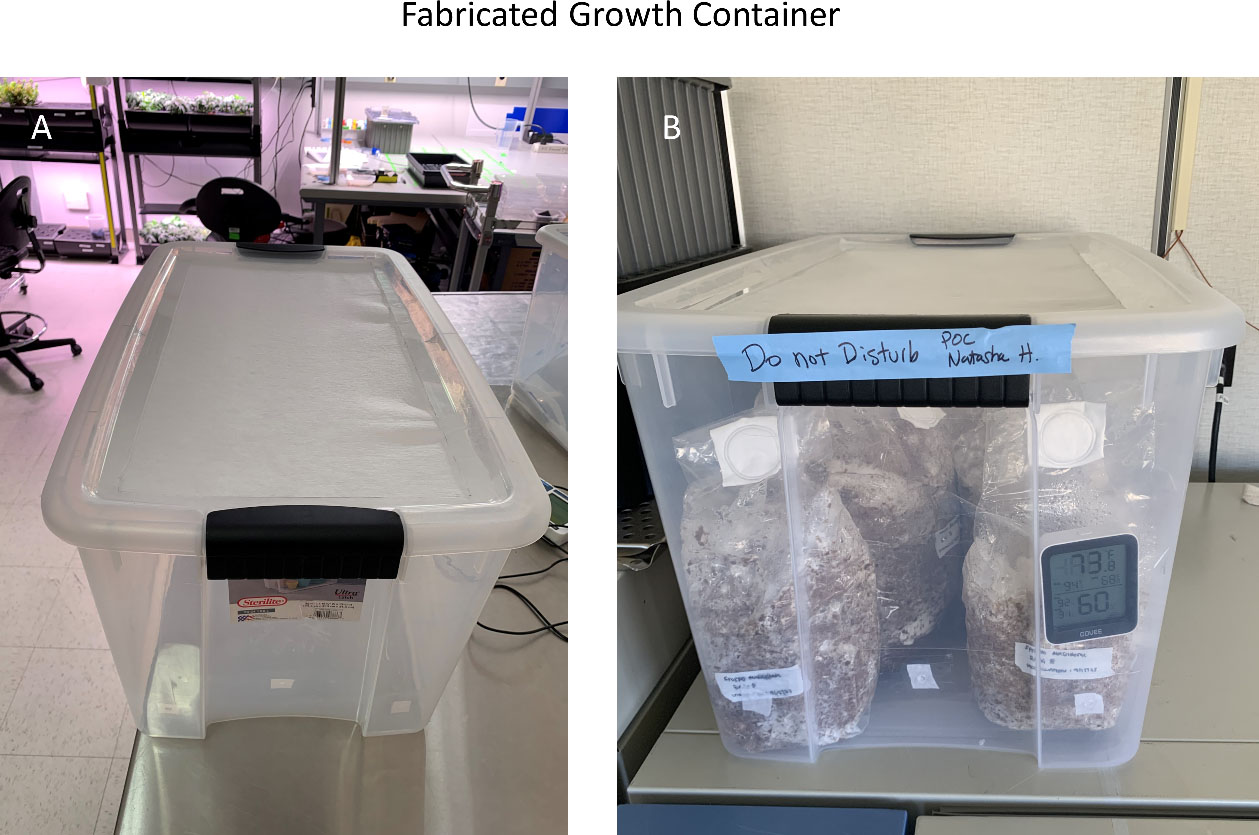
Supplementary Figure 1.
(A) Customized cultivation chamber made from a 70 Qt transparent storage container [Model # 19888604, Sterilite, Townsend, MA, USA], equipped with a MERV 13 air filter [ASIN # B087G5BY6G, All-Filters, Inc., Carson City, NV, USA] adhered to a hollow cut lid to ensure confinement of potential spores and allow sufficient gas exchange. (B) Customized cultivation chamber with colonized mushroom grow bags inside.
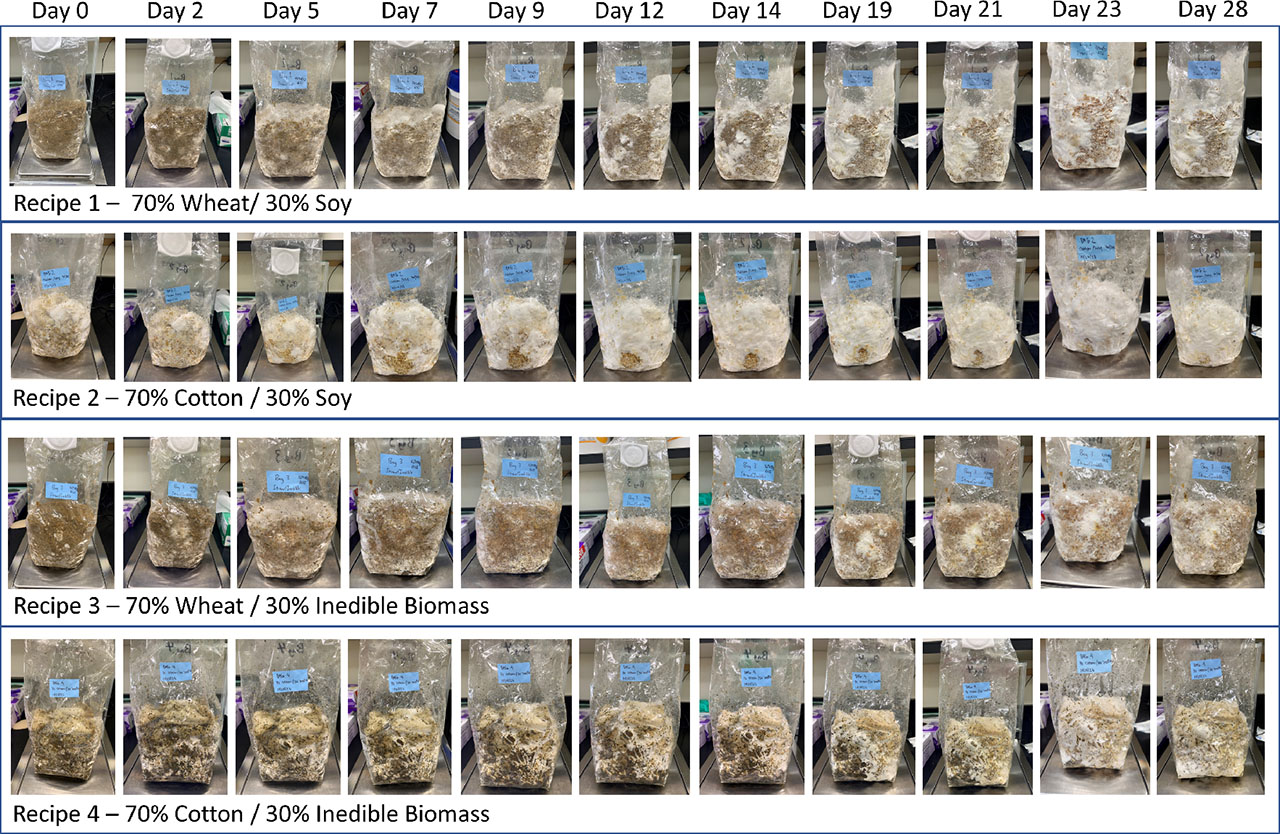
Supplementary Figure 2.
Time lapse of spawn run for recipes 1–4 in Rep 1. The colonization of substrates in recipes 1–4 from day 0 to day 28.
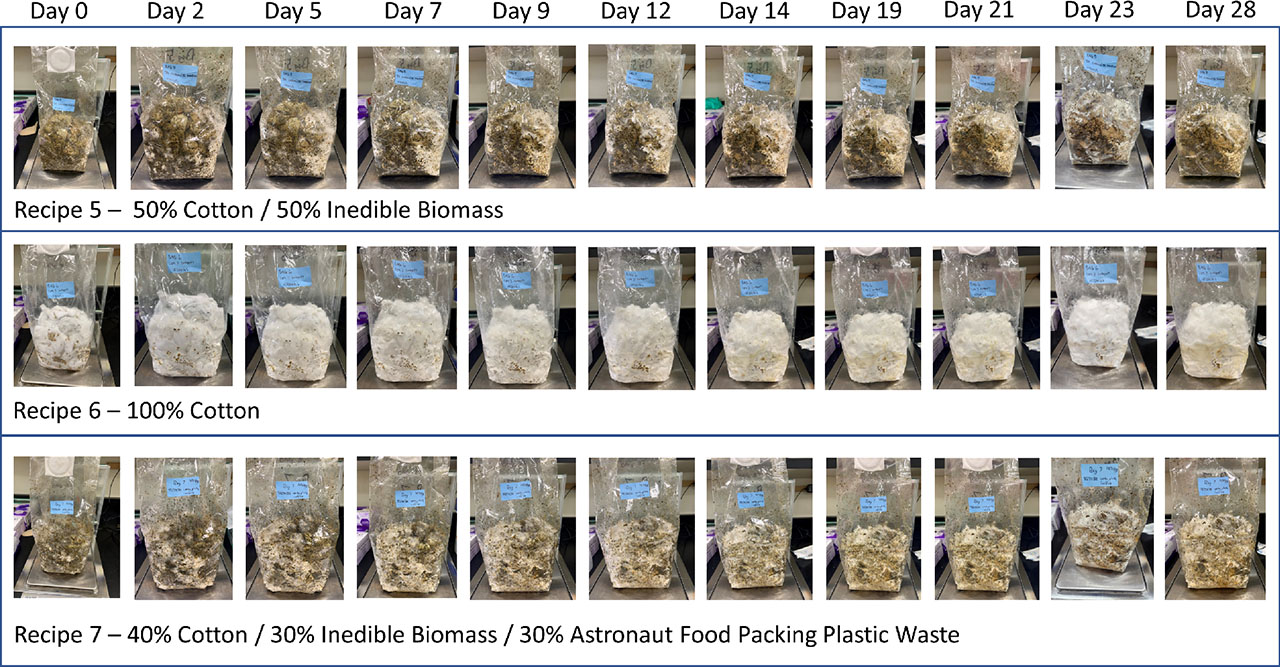
Supplementary Figure 3.
Time lapse of spawn run for recipes 5–7 in Rep 1. The colonization of substrates in recipes 5–7 from day 0 to day 28.
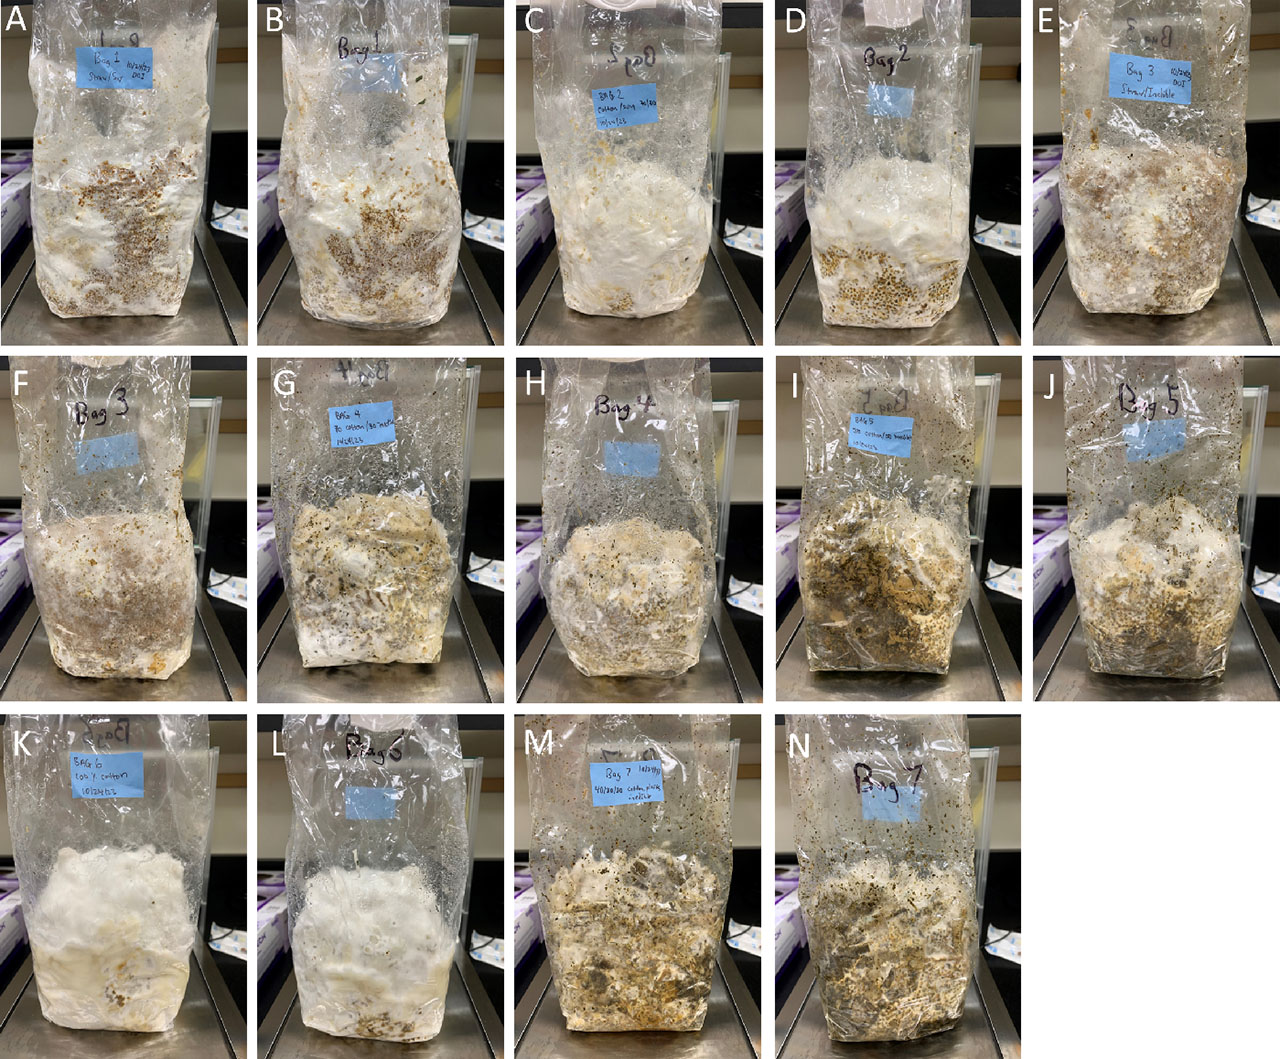
Supplementary Figure 4.
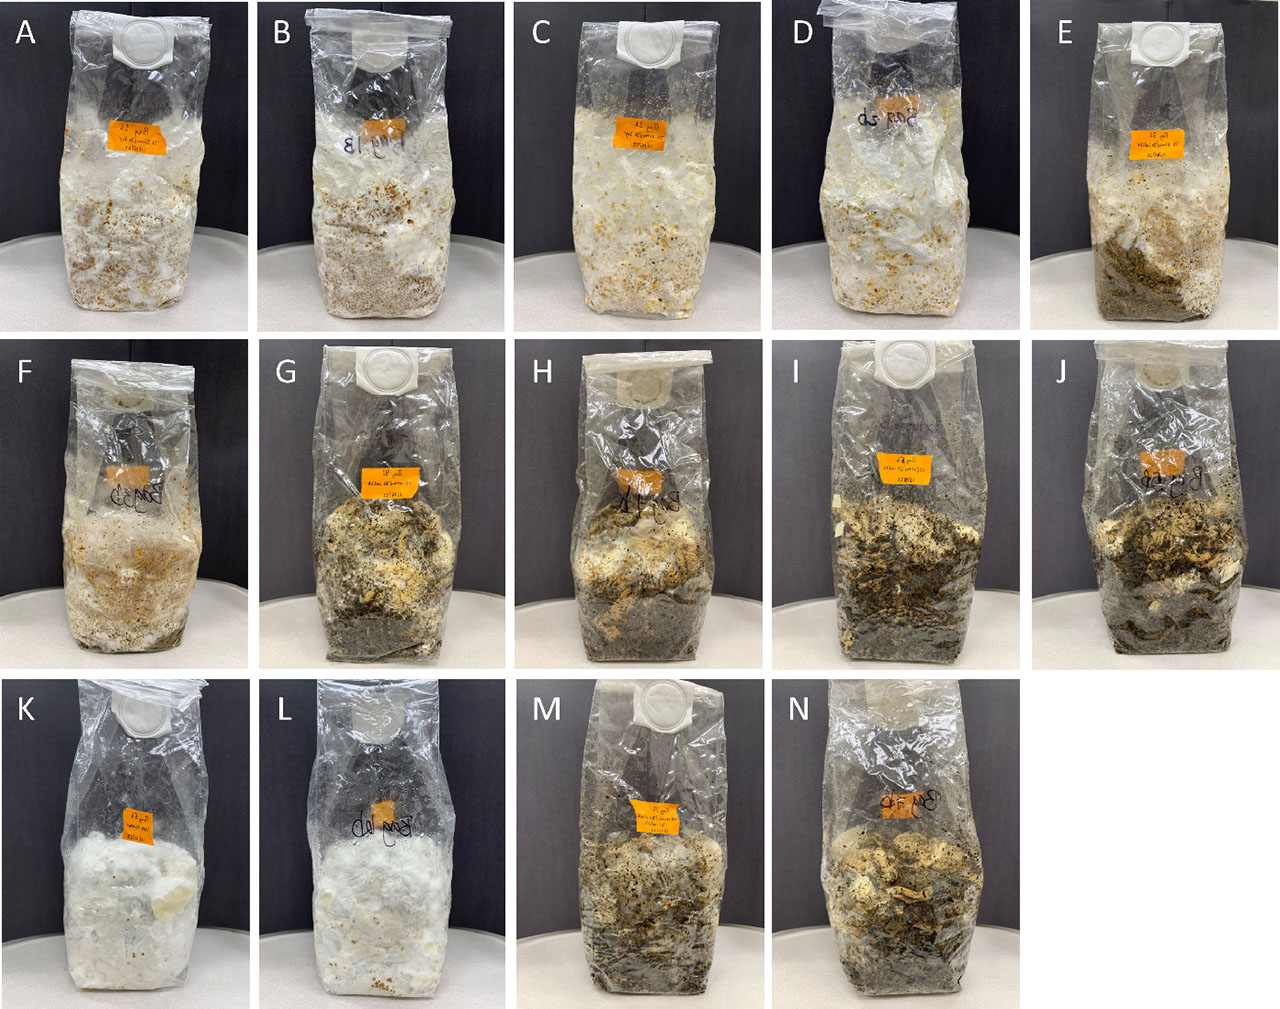
Front and back photographs of the colonized bags (1–7) on day 28 for Rep 1. (A and B) Recipe 1, (C and D) recipe 2, (E and F) recipe 3, (G and H) recipe 4, (I and J) recipe 5, (K and L) recipe 6, and (M and N) recipe 7.
Supplementary Figure 5.
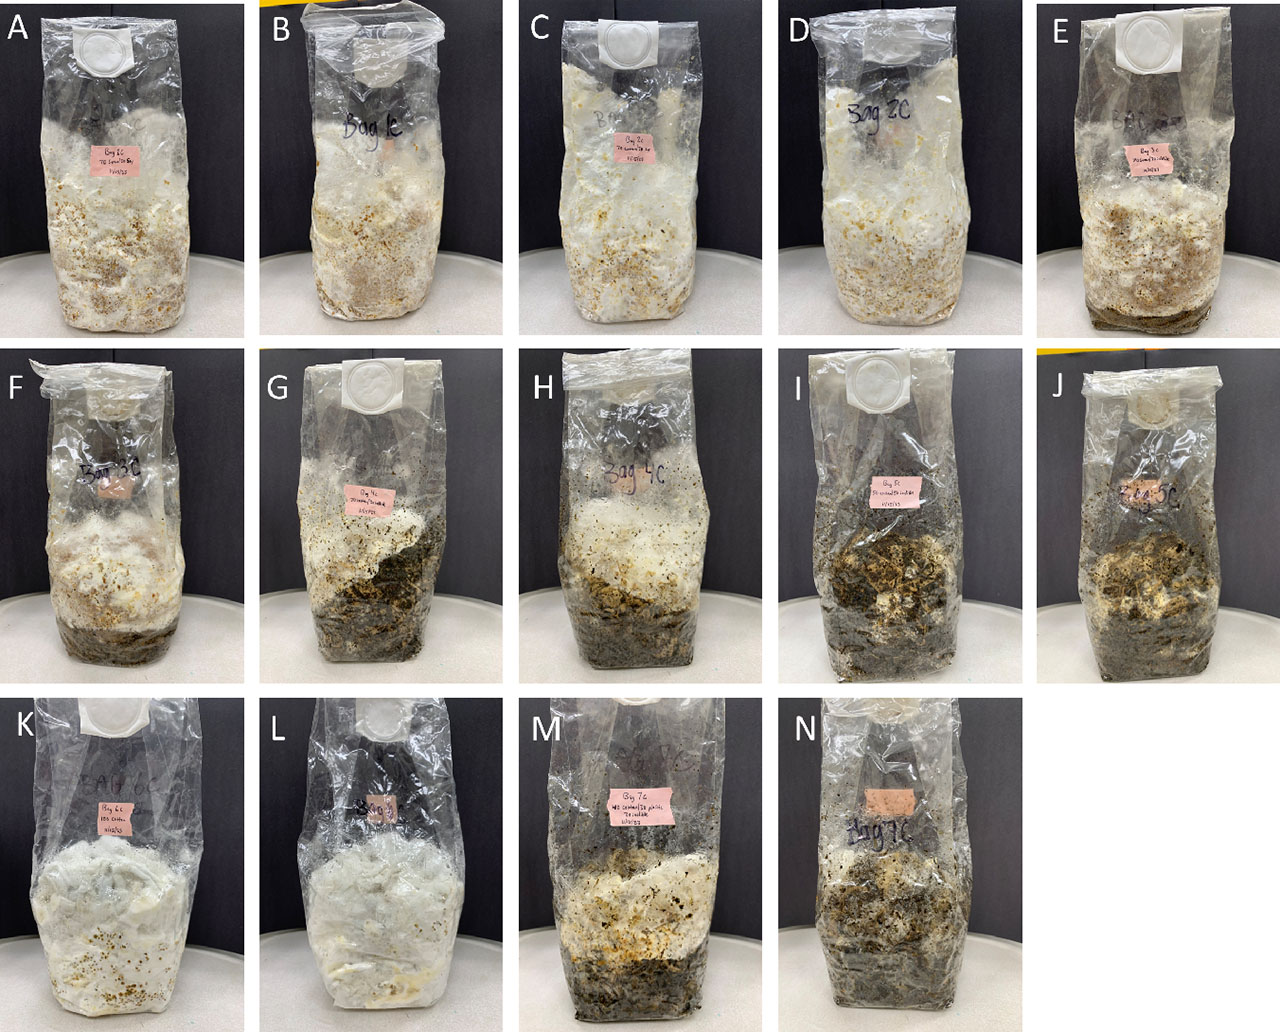
Front and back photographs of the colonized bags (1–7) on day 28 for Rep 2. (A and B) Recipe 1, (C and D) recipe 2, (E and F) recipe 3, (G and H) recipe 4, (I and J) recipe 5, (K and L) recipe 6, and (M and N) recipe 7.
Supplementary Figure 6.
Front and back photographs of the colonized bags (1–7) on day 28 for Rep 3. (A and B) Recipe 1, (C and D) recipe 2, (E and F) recipe 3, (G and H) recipe 4, (I and J) recipe 5, (K and L) recipe 6, and (M and N) recipe 7.
Supplementary Figure 7.
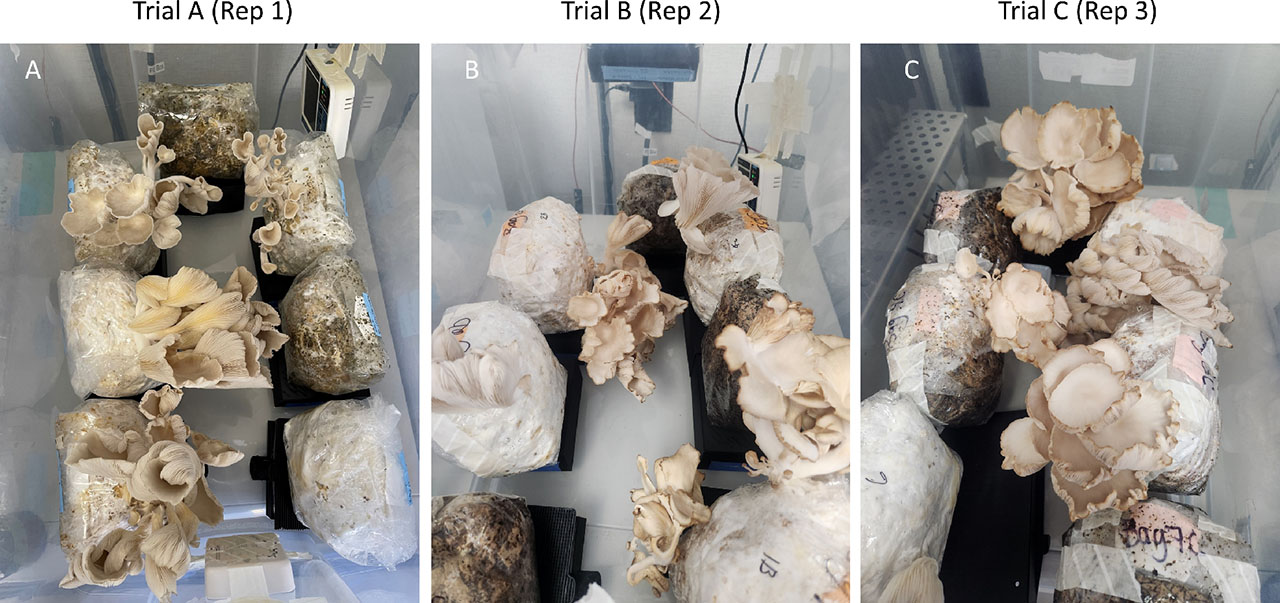
Aerial view of mushroom grow bags in cultivation containers prior to harvest for each Rep.