
Table 1
Tests of germination rate and percentage of different varieties of Raphanus sativus from sources (1 and 2) shown below.
| Germination | |||
|---|---|---|---|
| Fast (1 day) | Slow (3 days) | None | |
| Organic Sparkler White top Radish1 | 23% | 23% | 53% |
| Organic Purple Plum Radish1 | 57% | 0% | 43% |
| Organic German Giant Radish1 | 63% | 10% | 27% |
| Organic Champion Radish1 | 97% | 0% | 3% |
| Cherry Belle Radish1 | 97% | 0% | 3% |
| Roxanne F1 Hybrid Round Radish2 | 70% | 13% | 17% |
| Sora OG, Round Radish2 | 87% | 7% | 7% |
| Rudolph OG, Round Radish2 | 67% | 23% | 10% |
| Rover F1, Hybrid Round Radish2 | 90% | 10% | 0% |
Table 2
Seed sanitation* and percentage of germination of Raphanus sativus var. “Cherry Belle” after 1 day and 3 days.
| Treatment | 1 day | 3 days | None |
|---|---|---|---|
| Bleach (10 min), EtOH (5 min) | 33% | 0% | 67% |
| Bleach (7 min), +24 h, EtOH (3 min) | 43% | 0% | 57% |
| Bleach (7 min), +48 h, EtOH (3 min) | 43% | 40% | 17% |
| Bleach (5 min) | 100% | 0% | 0% |
| Bleach (7 min) | 100% | 0% | 0% |
| Bleach (10 min) | 93% | 0% | 7% |
| EtOH (10 s) | 87% | 0% | 13% |
| EtOH (30 s) | 97% | 3% | 0% |
| EtOH (1 min) | 93% | 7% | 0% |
| EtOH (3 min) | 90% | 7% | 3% |
| EtOH (5 min) | 83% | 7% | 10% |
| Bleach, (5 min) and EtOH (1 min) | 91% | 8% | 0% |
| EtOH (1 min) and Bleach (5 min) | 93% | 3% | 3% |
Table 3
MS medium with* and without chloride (MS-Cl).
| Components | mg/L | mM | |||
|---|---|---|---|---|---|
| MS* | MS-Cl | Ion | MS | MS-Cl | |
| Ammonium nitrate | 1650 | 1450 | NH4 | 20.6147 | 18.1170 |
| NO3 | 39.4080 | 39.8741 | |||
| Boric acid | 6.2 | 6.2 | B | 0.1003 | 0.1003 |
| Calcium chloride anhydrous | 332.2 | – | Ca | 2.9933 | 2.9648 |
| Ca(NO3)2 × 4H2O | – | 700 | K | 20.0474 | 20.0474 |
| Cobalt sulfate × 7H2O | – | 0.028 | Co | 0.0001 | 0.0001 |
| Cupric sulfate × 5H2O | 0.025 | 0.025 | Cu | 0.0001 | 0.0001 |
| Na2-EDTA | 37.26 | 37.26 | Na | 0.2002 | 0.2002 |
| Ferrous sulfate × 7H2O | 27.8 | 27.8 | Fe | 0.1000 | 0.1000 |
| Magnesium sulfate anhydrous | 180.7 | 180.7 | Mg | 1.5012 | 1.5012 |
| Manganese sulfate × H2O | 16.9 | 16.9 | Mn | 0.1000 | 0.1000 |
| Molybdic acid (NH4 salt) × 4H2O | – | 1.25 | Mo | 0.0010 | 0.0010 |
| Potassium iodide | 0.83 | 0.83 | I | 0.0050 | 0.0050 |
| Potassium nitrate | 1900 | 1900 | P | 1.2491 | 1.2491 |
| Potassium phosphate monobasic | 170 | 170 | Zn | 0.0299 | 0.0299 |
| Zinc sulfate × 7H2O | 8.6 | 8.6 | SO4 | 1.7312 | 1.7313 |
| Cl− | 2.9934 | 0.0000 | |||
| Grams of salts to prepare 1 L | 4.3 | 4.5 | |||
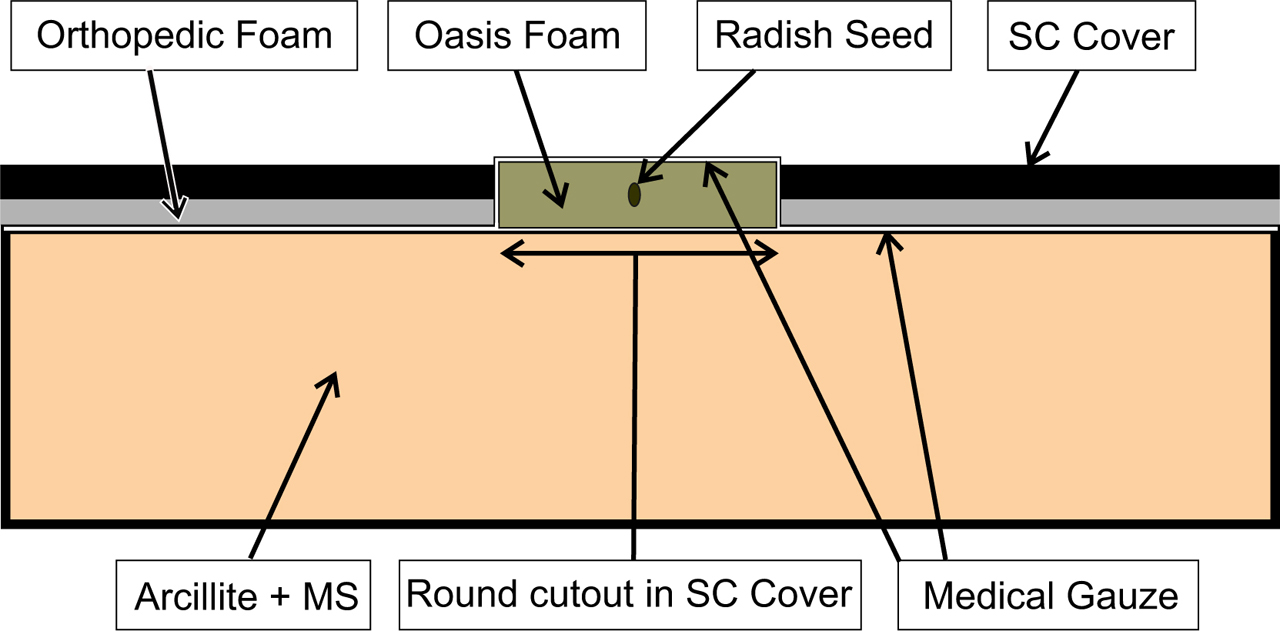
Figure 1
Cross sectional view of a packed SC. Not shown are porous tubes and moisture sensors embedded in the arcillite. The orthopedic foam was used to secure (slightly compress) the arcillite to prevent shifting during manipulations and eventual launch vibrations. SC, science carrier.
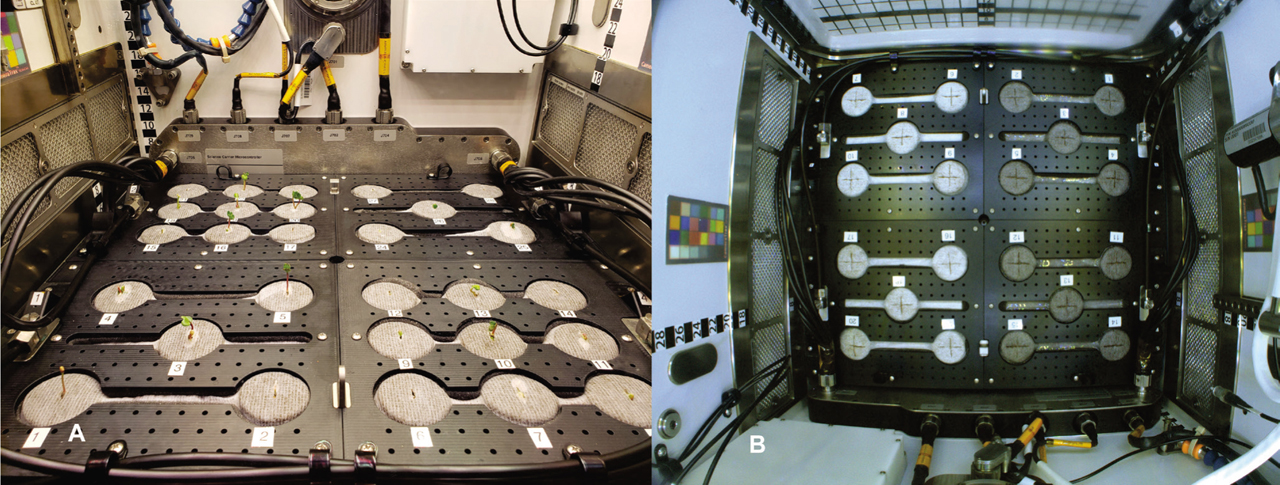
Figure 2
The SC quadrants with two five and nine planting positions (A). The individual planting positions show gauze covering OASIS (floral) foam. Darkening of the gauze is useful for assessing proper water dispensation into each quadrant (B). SC, science carrier.
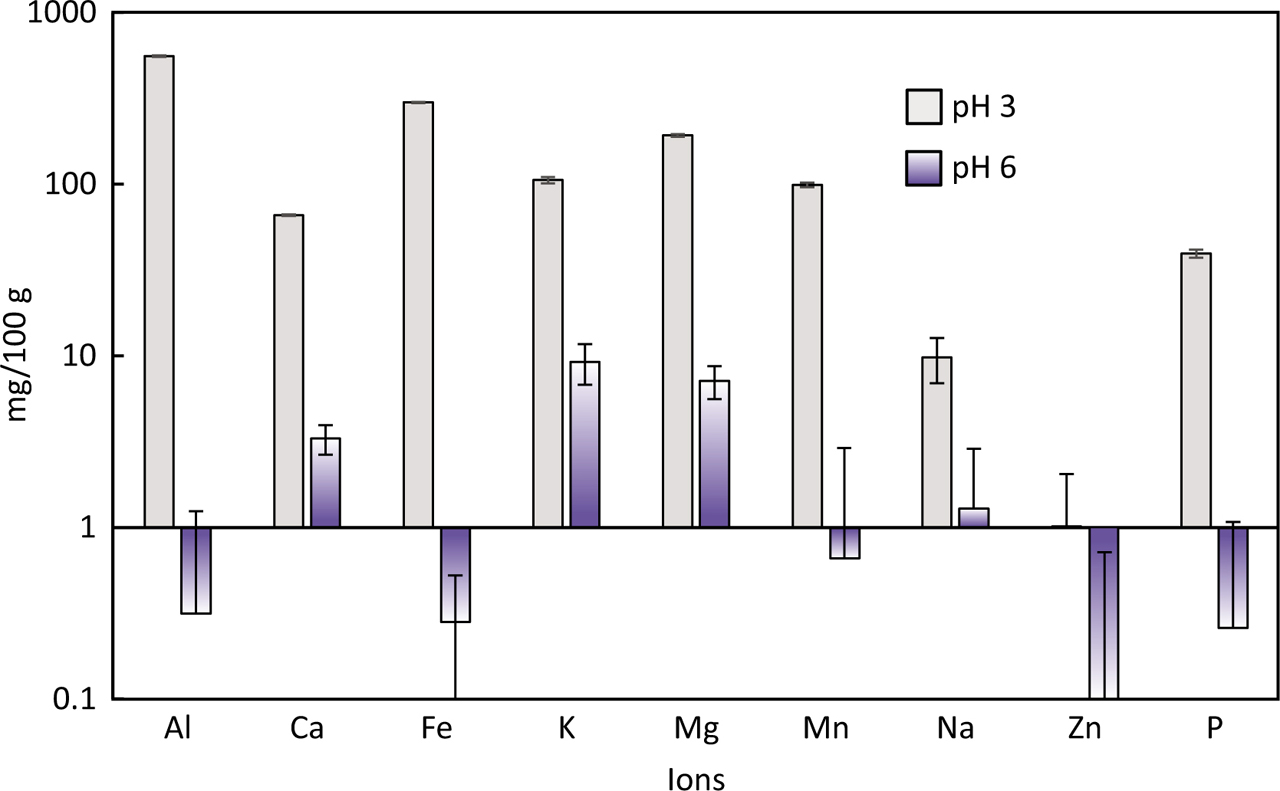
Figure 3
ICP-OES measurements of raw arcillite (no added fertilizer) after extraction with HCL (pH 3) and with 10 mM Tris/HCL buffer (pH 6). Large quantities are released under acid conditions but absent in at pH 6. Soluble ions were less than 1/10 of the acid extract.
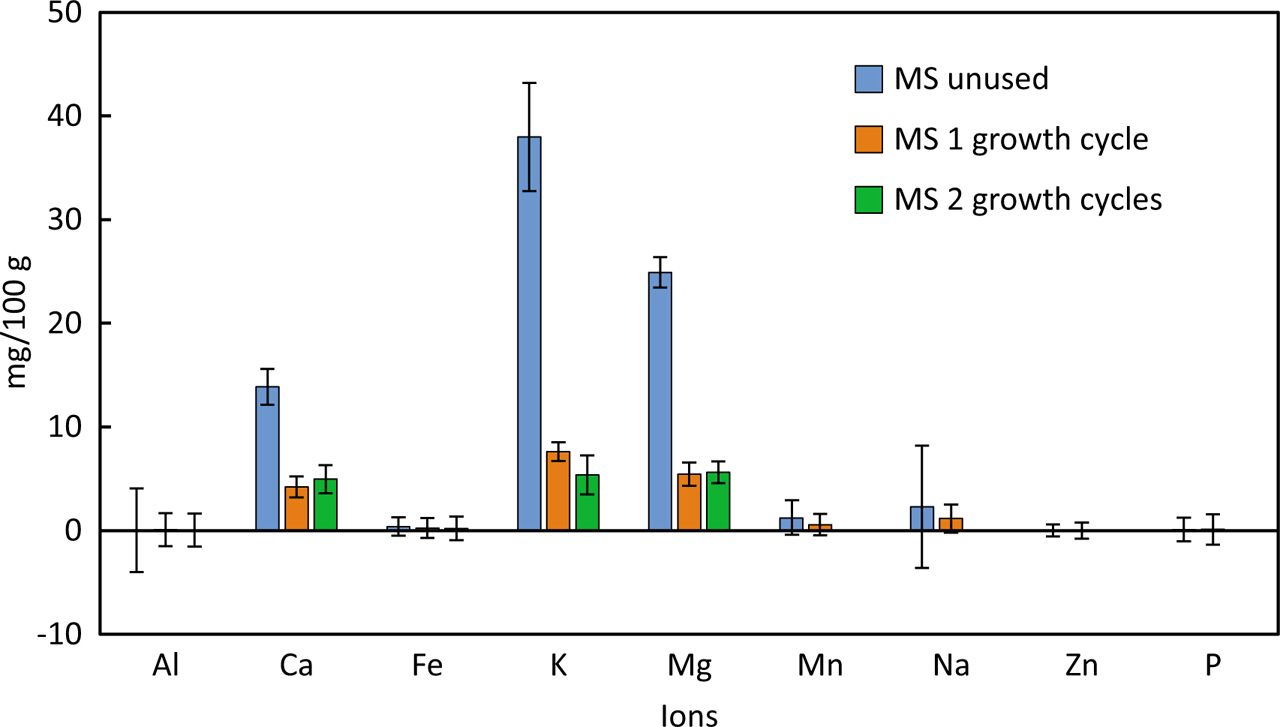
Figure 4
Mineral availability of arcillite infused with MS medium (un-used) and after the first and second growth cycles of radishes. MS, Murashige-Skoog.
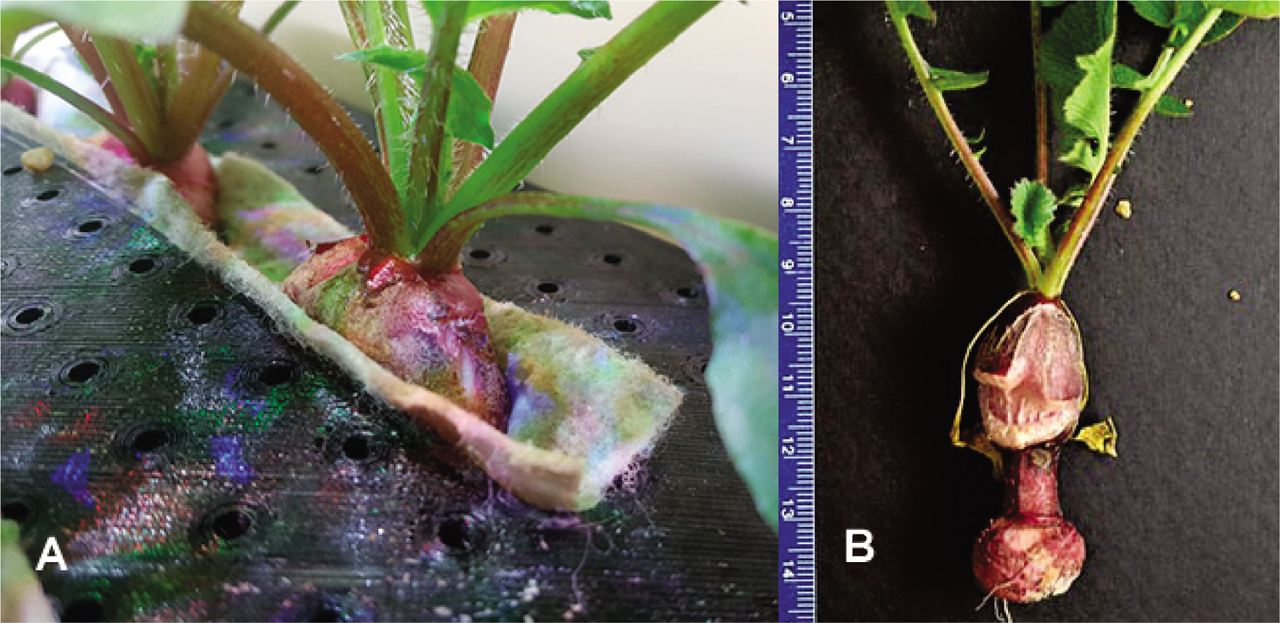
Figure 5
Radish seedlings grown on the SC quadrant with lid containing slits and lined with “Capillary Matting “Cap-Mat” (A). The Cap-Mat resulted in restricted radish bulb development (B). SC, science carrier.
Table 4
Biomass and leaf area per SC quadrant containing five or nine radish plants (averages ± SE).
| Total Mass, g | Radish, g | Leaf, g | Leaf area, cm2 | |
|---|---|---|---|---|
| N = 5 | 23.4±4.6 | 12.5±2.3 | 13.9±1.5 | 271.3±28.3 |
| N = 9 | 12.5±3.1 | 5.8±2.0 | 7.4±1.3 | 135.9±22.0 |
[i] SC, science carrier.
Table 5
Mineral content of radish leaves and storage tissue (bulbs) in mg/g fresh weight ± SD. The numbers in brackets indicate the number of plants per SC quadrant for the respective tissue.
| Al | K | Mg | Ca | Fe | Na | Si | P | |
|---|---|---|---|---|---|---|---|---|
| Bulb [5] | 1.07±0.01 | 295.6±8.7 | 23.4±0.3 | 18.8±0.2 | 0.66±0.07 | 17.0±0.6 | 1.02±0.04 | 15.6±0.4 |
| Leaves [5] | 1.05±0.01 | 460.4±12 | 169.5±4.6 | 149.6±3.3 | 0.94±0.02 | 21.9±0.6 | 2.38±0.05 | 23.2±0.5 |
| Bulb [9] | 0.97±0.01 | 295.4±7.3 | 30.3±0.4 | 18.9±0.3 | 0.32±0.03 | 13.6±0.4 | 0.73±0.03 | 11.7±0.3 |
| Leaves [9] | 1.04±0.01 | 336.7±7.8 | 182.2±4.2 | 168.4±3.7 | 0.65±0.02 | 18.8±0.5 | 2.04±0.05 | 17.8±0.4 |
[i] SC, science carrier.
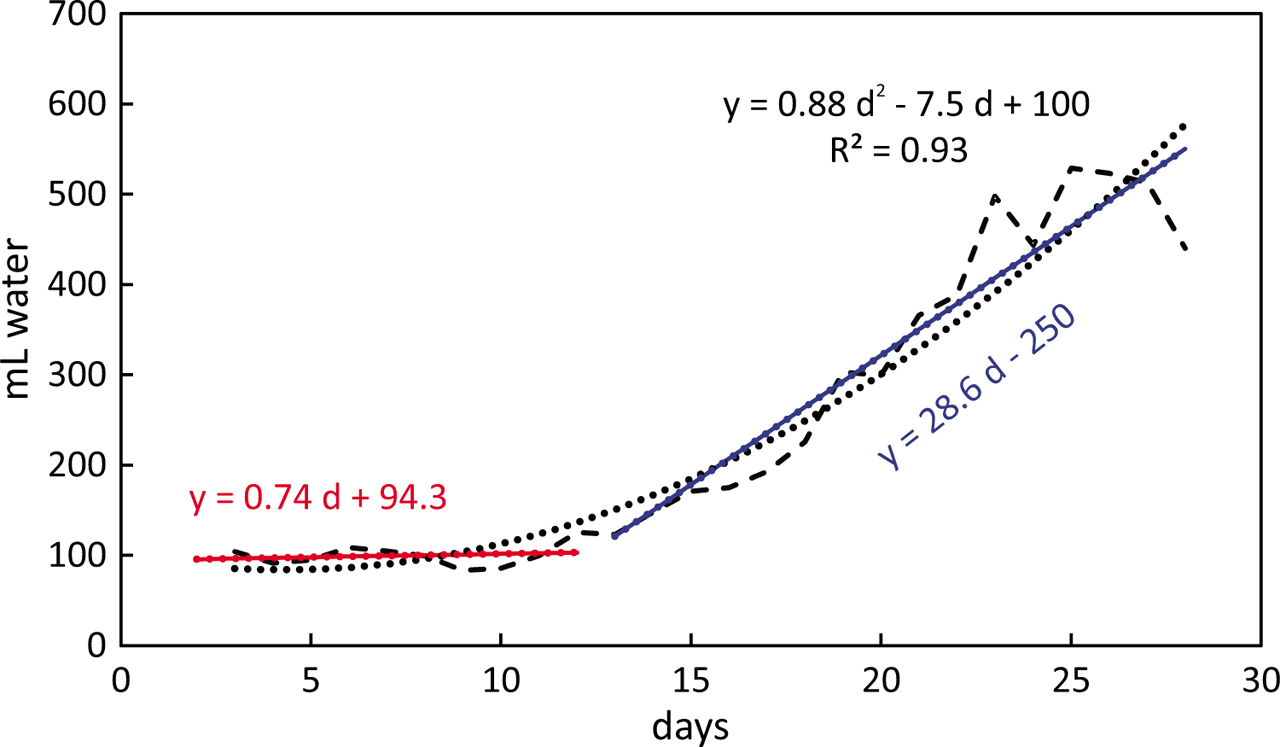
Figure 6
The bi-phasic water consumption of radishes cultivated in arcillite. The average of three representative experiments with five plants each growing in the same volume as a SC quadrant (dashed line). The water loss experienced by the plants and substrate remains constant during the first 10 days (red line); then plant-based enhanced transpiration increases (blue line). The dotted line approximates water consumption as a binomial function. SC, science carrier.
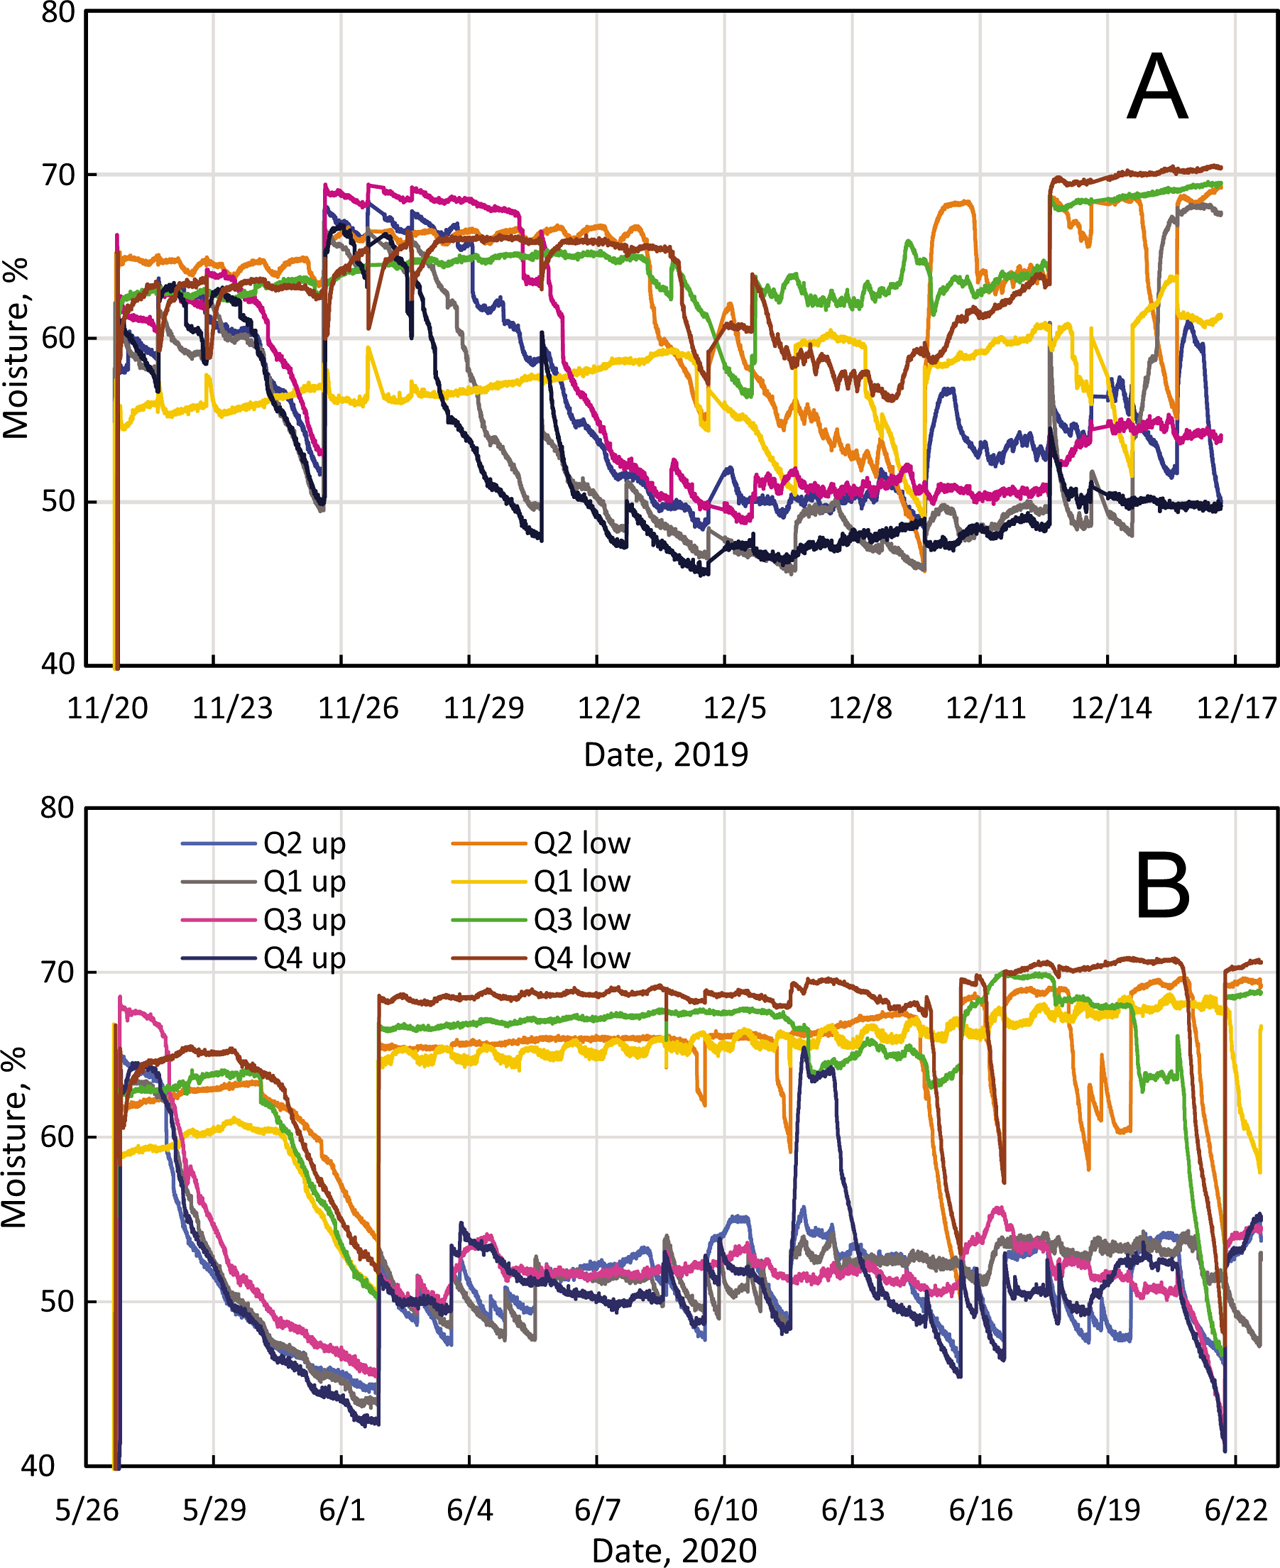
Figure 7
Moisture readings from the EVT, (A) and a second EVT (B). The tracings show higher moisture readings for the lower sensors in all four quadrants. The more uniform tracings in (B) indicate better hardware performance than in (A). However, greater water demand toward the end of the culture time shows larger fluctuations, especially in (A). A strong drop in moisture readings especially for the lower sensors indicated plant water stress. The legend applies to A and B and describes the measurements of the moisture sensors in the SC quadrants 1 to 4 (Q) of the upper (up) and lower (low) sensor, respectively. EVT, experimental verification test; SC, science carrier.
Table 6
Lighting schedules used in different ground control tests and the resultant radish biomass*.
| Experiment | White [4100 K] | Blue [455 nm] | Green [530 nm] | Red [627 nm] | Far Red [735 nm] | Avg. Radish mass, g |
|---|---|---|---|---|---|---|
| SVT (5/16/19–6/13/19) | 490 | 0 | 70 | 220 | 0 | 9.1 |
| ΔSVT (10/3/19–10/30/19) | 490 | 0 | 70 | 220 | 0 | 9.8 |
| EVT (11/20/19–12/16/19) | 460 | 30 | 50 | 220 | 20 | 4.4 |
| ΔEVT (5/26/20–6/22/20) | 335 | 310 | 60 | 20 | 0 | 13.9 |
[i] Light values are shown as μmol · m−2 · s−1.
[ii] EVT, experimental verification test; SVT, science verification tests.
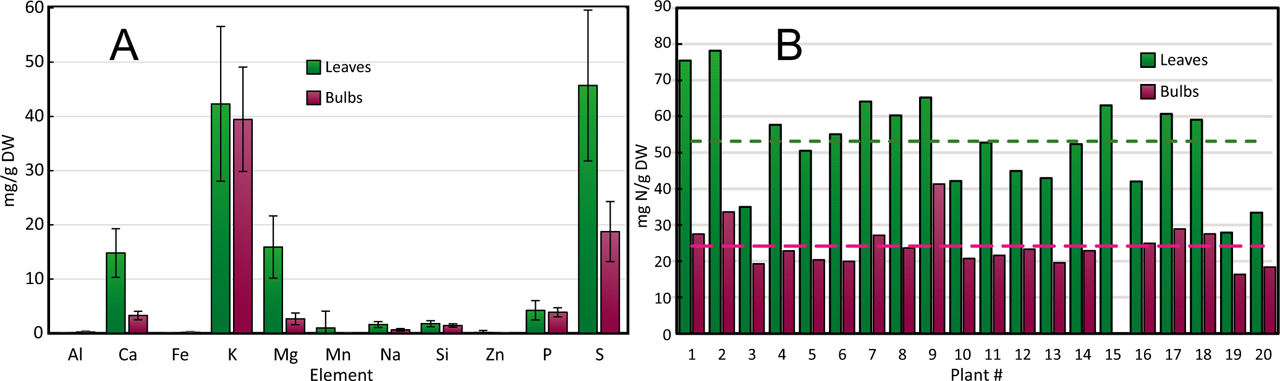
Figure 8
Mineral (A) and nitrogen contents (B) from radish leaves and bulbs. Importantly, the higher mineral and nitrogen content of leaves than bulbs suggest that leaves be used as food source. The average nitrogen content (dashed lines in B) is about twice as high in leaves than in bulbs.