
Table 1
Average IOP values by sex, side, and time.
| Time (days) | YM Cohort | YF Cohort | Cross-sectional Sex Comparisons (Female–Male) | |||
|---|---|---|---|---|---|---|
| Left Eye (95% CI) | Right Eye (95% CI) | Left Eye (95% CI) | Right Eye (95% CI) | Difference (95% CI) | p-value (p-FDR) | |
| 0 | 17.9 (16.9, 18.9) | 18.1 (17.1, 19.1) | 19.1 (18.2, 19.9) | 19.3 (18.4, 20.1) | 1.15 (−0.08, 2.39) | 0.067 (0.091) |
| 7 | 19.4 (18.5, 20.3) | 19.6 (18.7, 20.5) | 19.7 (18.9, 20.5) | 19.9 (19.1, 20.7) | 0.31 (−0.80, 1.43) | 0.582 (0.644) |
| 14 | 20.8 (19.9, 21.7) | 21.0 (20.1, 21.9) | 20.3 (19.5, 21.2) | 20.5 (19.7, 21.4) | −0.48 (−1.65, 0.68) | 0.411 (0.486) |
| 28 | 23.2 (22.0, 24.3) | 23.4 (22.2, 24.5) | 21.4 (20.4, 22.5) | 21.7 (20.6, 22.7) | −1.73 (−3.24, −0.22) | 0.025 (0.036) |
| 45 | 24.5 (23.2, 25.9) | 24.7 (23.4, 26.1) | 22.4 (21.2, 23.6) | 22.6 (21.4, 23.8) | −2.16 (−3.90, −0.42) | 0.015 (0.023) |
| 90 | 21.1 (20.1, 22.1) | 21.3 (20.3, 22.3) | 22.6 (21.7, 23.5) | 22.8 (21.9, 23.7) | 1.51 (0.18, 2.83) | 0.026 (0.037) |
| 97 | 20.8 (19.8, 21.9) | 21.1 (20.0, 22.1) | 22.6 (21.7, 23.6) | 22.8 (21.9, 23.8) | 1.77 (0.42, 3.13) | 0.011 (0.016) |
| 104 | 20.8 (19.8, 21.9) | 21.1 (20.0, 22.1) | 22.7 (21.7, 23.6) | 22.9 (21.9, 23.9) | 1.84 (0.46, 3.21) | 0.009 (0.014) |
| 180 | 26.2 (23.9, 28.4) | 26.4 (24.1, 28.7) | 24.2 (21.8, 26.7) | 24.4 (22.0, 26.9) | −1.94 (−5.27, 1.40) | 0.254 (0.307) |
[i] Baseline and hindlimb suspended (HS)-induced IOP changes by sex group (male, female), side (left, right) and time (0–180). All estimates are based on a linear-mixed effects model (assuming the random-effect = 0). For example, the average IOP within the young male cohort at baseline (day 0) was 17.9 mmHg (95% CI:16.9–18.9) [left eye]. The similar value within the young female cohort was 19.1 (18.2 – 19.9). The difference (female-male) in these average values was 1.15 (−0.08–2.39). Given side was modeled as a main-effect only, the cross-sectional sex differences are the same for the left and right eye (e.g., 19.1–17.9=1.2 [day 0; left], 19.3–18.1=1.2 [day 0; right]; slight differences due to rounding).
Table 2
HS-induced IOP temporal changes by sex cohort.
| Temporal Comparison (days) | YM Cohort | YF Cohort | Change Comparisons by Sex Group (Female–Male) | |||
|---|---|---|---|---|---|---|
| Estimate (95% CI) | p-value (p-FDR) | Estimate (95% CI) | p-value (p-FDR) | Difference (95% CI) | p-value (p-FDR) | |
| 7 vs. 0 | 1.49 (1.15, 1.83) | <0.001 (<0.001) | 0.64 (0.34, 0.95) | <0.001 (<0.001) | −0.84 (−1.30, −0.39) | <0.001 (0.001) |
| 14 vs. 0 | 2.91 (2.25, 3.57) | <0.001 (<0.001) | 1.27 (0.67, 1.87) | <0.001 (<0.001) | −1.64 (−2.53, −0.75) | <0.001 (0.001) |
| 28 vs. 0 | 5.27 (4.08, 6.46) | <0.001 (<0.001) | 2.39 (1.31, 3.47) | <0.001 (<0.001) | −2.89 (−4.49, −1.28) | <0.001 (0.001) |
| 45 vs. 0 | 6.62 (5.15, 8.10) | <0.001 (<0.001) | 3.31 (1.97, 4.65) | <0.001 (<0.001) | −3.31 (−5.31, −1.32) | 0.001 (0.002) |
| 90 vs. 0 | 3.19 (2.03, 4.34) | <0.001 (<0.001) | 3.54 (2.51, 4.57) | <0.001 (<0.001) | 0.35 (−1.20, 1.90) | 0.656 (0.700) |
| 97 vs. 90 | −3.68 (−5.15, −2.22) | <0.001 (<0.001) | 0.25 (−1.09, 1.59) | 0.714 (0.742) | 3.93 (1.95, 5.92) | <0.001 (<0.001) |
| 104 vs. 90 | −3.68 (−5.21, −2.16) | <0.001 (<0.001) | 0.31 (−1.08, 1.71) | 0.659 (0.700) | 4.00 (1.93, 6.07) | <0.001 (<0.001) |
| 180 vs. 90 | 1.64 (−0.76, 4.04) | 0.180 (0.223) | 1.86 (−0.70, 4.42) | 0.155 (0.201) | 0.22 (−3.29, 3.73) | 0.902 (0.902) |
[i] Hindlimb suspended (HS)-induced IOP changes compared to baseline (time – 0 days) or during the normal posture recovery period compared to the end of HS (time - 90 days) measurement as well as rates of change comparison by sex cohort (female-male). All estimates are based on a linear-mixed effects model (assuming the random-effect = 0). For example, the average IOP change within the young male cohort between day 7 and day 0 was 1.49 mmHg (95% CI: 1.15 – 1.83) after adjusting for side (left/right). The analogous value within the young female cohort was 0.64 (0.34–0.95). The difference (female-male) in these rates of change was −0.84 (−1.30 – −0.39).
Table 3
Average IOP values by age, side, and time.
| Time (days) | YM Cohort | OM Cohort | Cross-sectional Age Comparisons (Old–Young) | |||
|---|---|---|---|---|---|---|
| Left Eye (95% CI) | Right Eye (95% CI) | Left Eye (95% CI) | Right Eye (95% CI) | Difference (95% CI) | p-value (p-FDR) | |
| 0 | 18.0 (16.9, 19.0) | 18.1 (17.0, 19.1) | 19.1 (17.7, 20.6) | 19.3 (17.8, 20.7) | 1.19 (−0.51, 2.89) | 0.168 (0.213) |
| 45 | 24.6 (23.2, 26.0) | 24.7 (23.3, 26.1) | 22.0 (20.6, 23.3) | 22.1 (20.7, 23.4) | −2.62 (−4.51, −0.72) | 0.007 (0.011) |
| 90 | 21.1 (20.0, 22.3) | 21.2 (20.1, 22.4) | 24.2 (22.9, 25.5) | 24.3 (23.0, 25.6) | 3.03 (1.40, 4.65) | <0.001 (0.001) |
| 135 | 22.7 (21.4, 24.0) | 22.8 (21.5, 24.1) | 22.0 (20.5, 23.5) | 22.1 (20.6, 23.6) | −0.69 (−2.61, 1.24) | 0.482 (0.557) |
| 180 | 26.2 (23.8, 28.7) | 26.3 (23.9, 28.8) | 18.7 (15.9, 21.5) | 18.8 (16.0, 21.6) | −7.53 (−11.17, −3.88) | <0.001 (<0.001) |
[i] Baseline and hindlimb suspended (HS)-induced IOP changes by age group (young, old), side (left, right) and time (0–180). All estimates are based on a linear-mixed effects model (assuming the random-effect = 0). For example, the average IOP within the young male cohort at baseline (day 0) was 18.0 mmHg (95% CI:16.9–19.0) [left eye]. The similar value within old male cohort was 19.1 (17.7 – 20.6). The difference (old-young) in these average values was 1.19 (−0.51–2.89). Given side was modeled as a main-effect only, the cross-sectional age group differences are the same for the left and right eye (e.g., 19.1–18.0=1.1 [day 0; left], 19.3–18.1=1.2 [day 0; right]; slight differences due to rounding).
Table 4
HS-induced IOP temporal changes by age cohort.
| Temporal Comparison (days) | YM Cohort | OM Cohort | Change Comparisons by Age Group (Old–Young) | |||
|---|---|---|---|---|---|---|
| Estimate (95% CI) | p-value (p-FDR) | Estimate (95% CI) | p-value (p-FDR) | Difference (95% CI) | p-value (p-FDR) | |
| 45 vs. 0 | 6.62 (5.05, 8.20) | <0.001 (<0.001) | 2.82 (1.17, 4.46) | 0.001 (0.002) | −3.81 (−6.08, −1.53) | 0.001 (0.002) |
| 90 vs. 0 | 3.19 (1.96, 4.41) | <0.001 (<0.001) | 5.02 (3.43, 6.61) | <0.001 (<0.001) | 1.83 (−0.17, 3.84) | 0.073 (0.098) |
| 135 vs. 90 | 1.54 (0.43, 2.65) | 0.007 (0.011) | −2.17 (−3.44, −0.91) | 0.001 (0.002) | −3.71 (−5.40, −2.03) | <0.001 (<0.001) |
| 180 vs. 90 | 5.08 (2.47, 7.69) | <0.001 (<0.001) | −5.48 (−8.46, −2.49) | <0.001 (0.001) | −10.55 (−14.52, −6.59) | <0.001 (<0.001) |
[i] Hindlimb suspended (HS)-induced IOP changes compared to baseline (time – 0 days) or during the normal posture recovery period compared to the end of HS (time - 90 days) measurement as well as rates of change comparison by age group (old-young). All estimates are based on a linear-mixed effects model (assuming the random-effect = 0). For example, the average IOP change within the young male cohort between day 45 and day 0 was 6.62 mmHg (95% CI: 5.05, 8.20) after adjusting for side (left/right). The analogous value within the old male cohort was 2.82 (1.17–4.46). The difference (old-young) in these rates of change was −3.81 (−6.08 – −1.53).
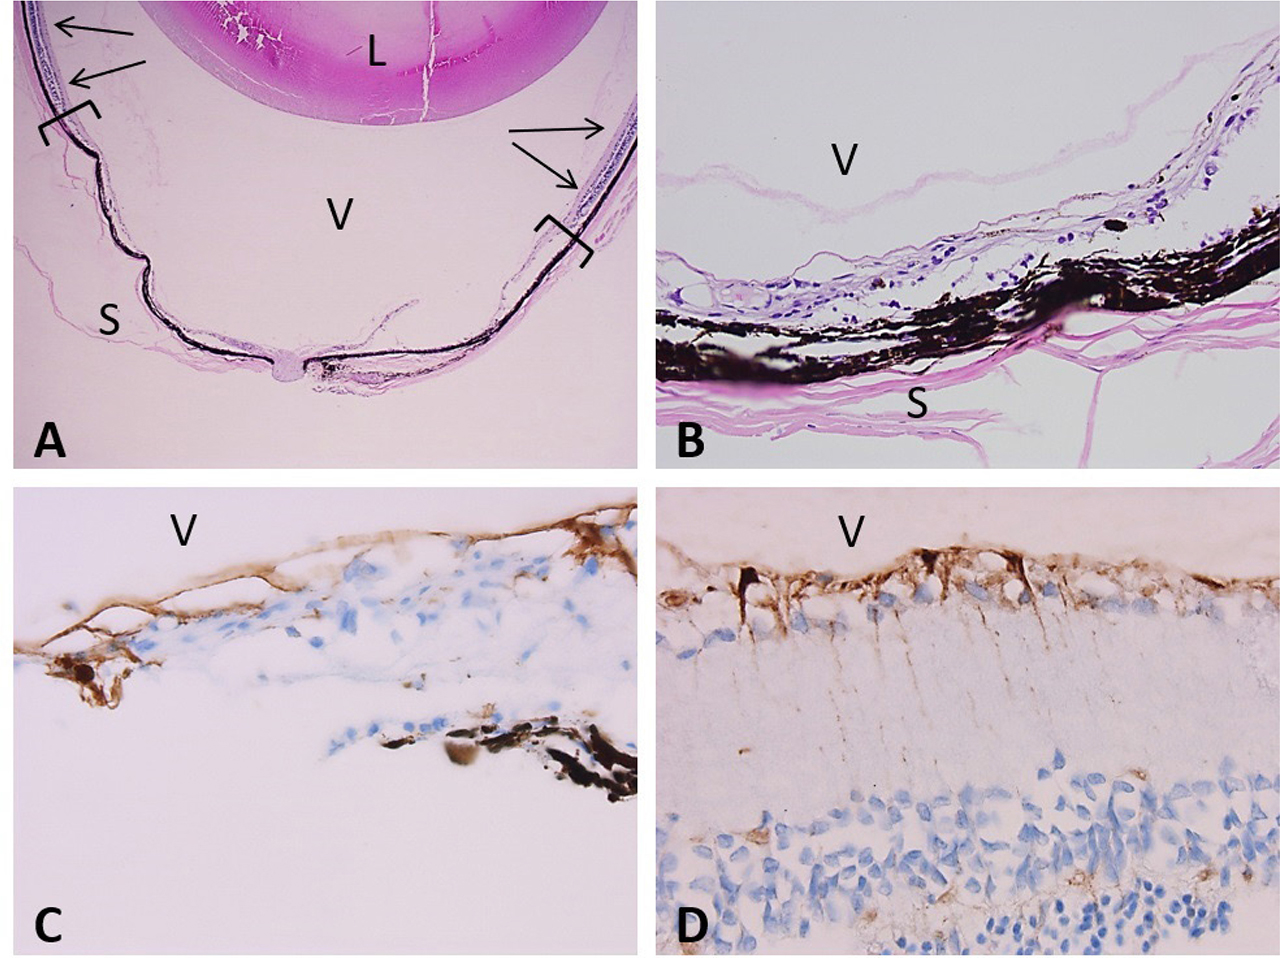
Figure 1
Histological examination of young female rat HS + 90 days recovery eye sections. (A) Low power magnification (2X) H&E stain shows residual peripheral normal retina (arrows) with a posterior thin retina forming the chorioretinal scar. The lens (L), vitreous (V) and sclera (S) are unremarkable. (B) High magnification (20X) H&E stain of a chorioretinal scar. (C) 40X magnification view of the retina in the scar immunostained with anti-GFAP antibody shows the irregular proliferation of glial cells in the inner layers (facing vitreous (V)). Immunohistochemistry, DAB chromogen, Glial fibrillary acidic protein antibody. (D) 40X magnification of the edge of the retinal scar immunostained with vimentin highlights the proliferating and activated Müller cells. Vitreous (V). Immunohistochemistry, DAB chromogen, vimentin antibody.
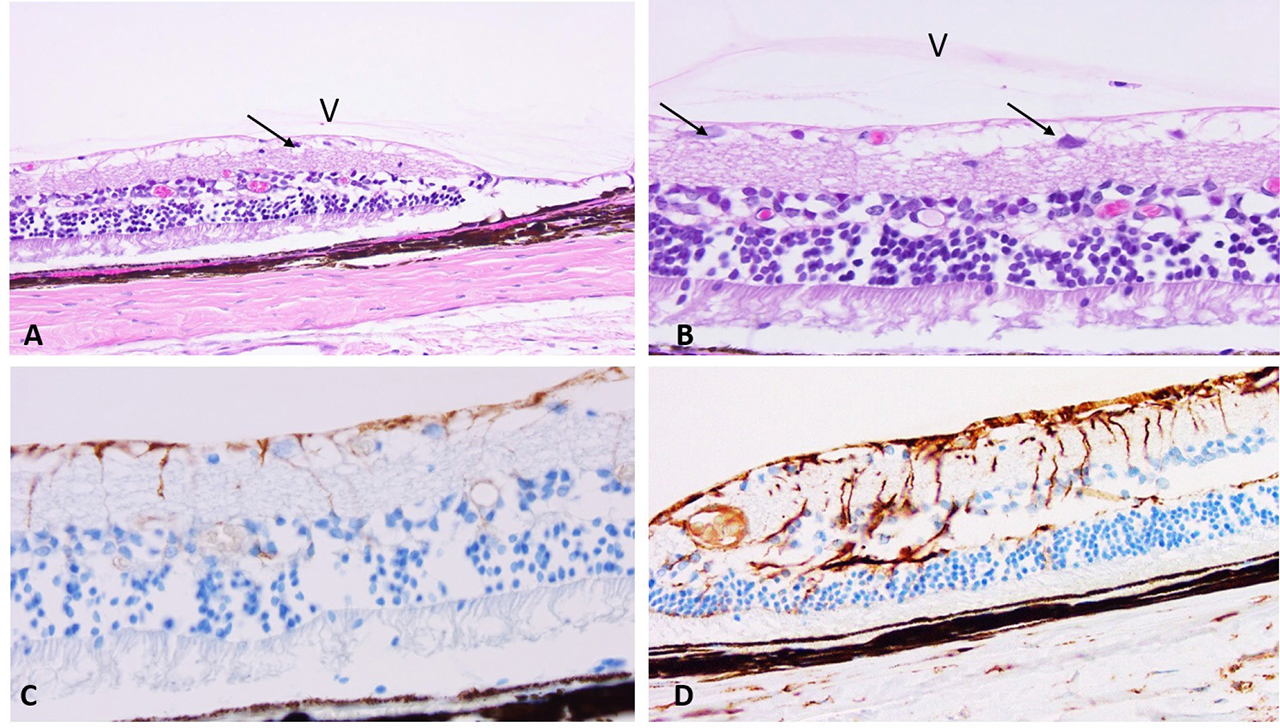
Figure 2
Histologic effects of HS in the rat retina of young male and female rats. (A) H&E staining at 20X magnification of peripheral retina showing few inner layer ganglion cells (arrow) and some condensation of vitreous (V). (B) Images of retina from YM at 180 days at equator is thicker but also shows some drop in ganglion cells (arrow) and condensed band of vitreous (V). H&E, original magnification 20X. (C) Immunohistochemistry example of GFAP staining of the glial and Muller cells in equatorial retina a male hind limb suspended (HS + 14 days recovery). Immunohistochemistry, DAB chromogen, GFAP antibody, 40X magnification. (D) Immunohistochemistry example of vimentin staining of Muller cells in the peripheral retina of a male hind limb suspended (HS+90 days recovery). Immunohistochemistry, DAB chromogen, vimentin antibody, 40X magnification.
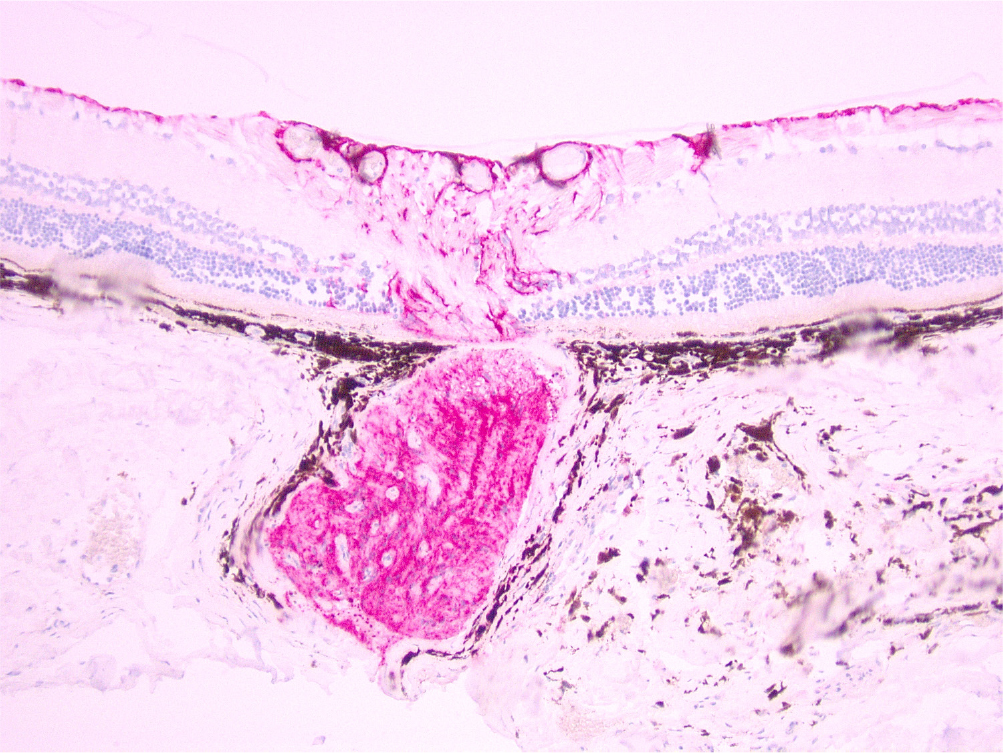
Figure 3
Histologic effects of HS in the rat optic nerve. (A) Image of a young male rat at 14 days HS at 40X magnification showing the posterior retina surrounding the optic nerve with intense immunoreactivity to GFAP antibody in the head of the nerve. Immunohistochemistry, Permanent Red chromogen, GFAP antibody.
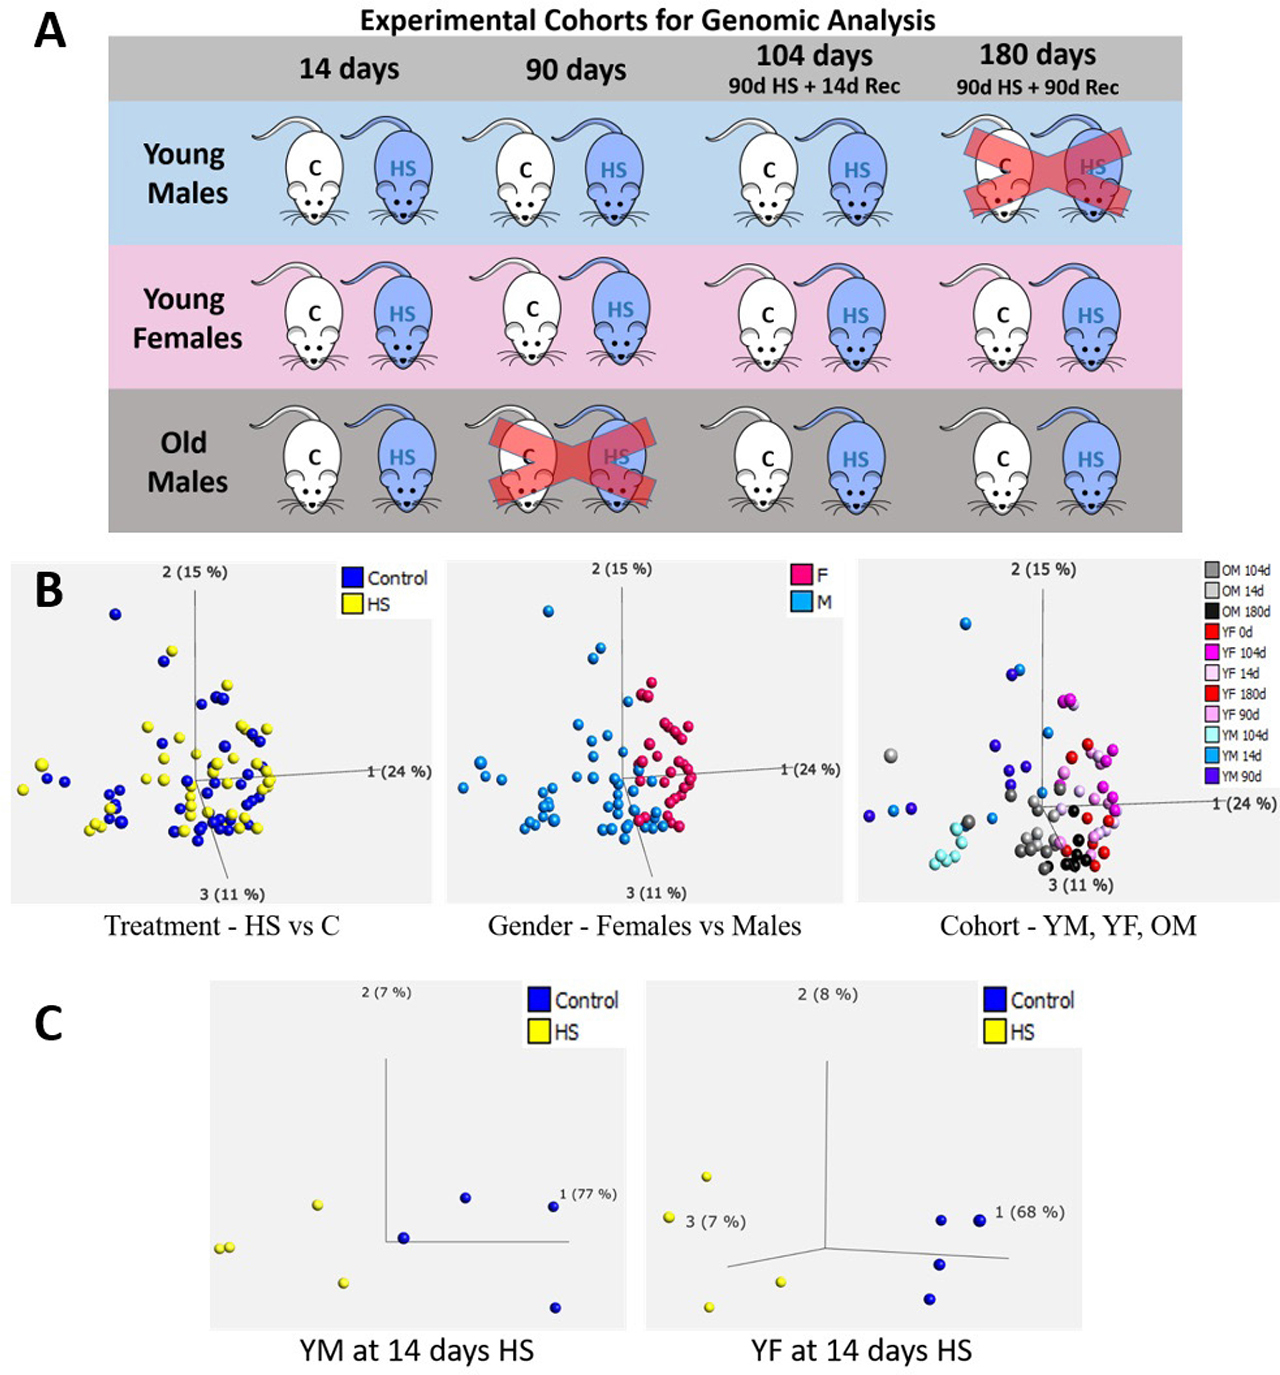
Figure 4
Microarray analysis of rat experimental cohorts. (A) Experimental groups represented in the microarray analysis. Groups for which no retinas were available are marked with a red X. (B) Principal component analysis (PCA) of gene expression in all experimental groups shown in A. Left, color coded for treatment; middle, color coded for gender; right, color coded by cohort (YM, YF, OM). (C) PCA showing clustering by treatment of YM and YF at 14 days of treatment.
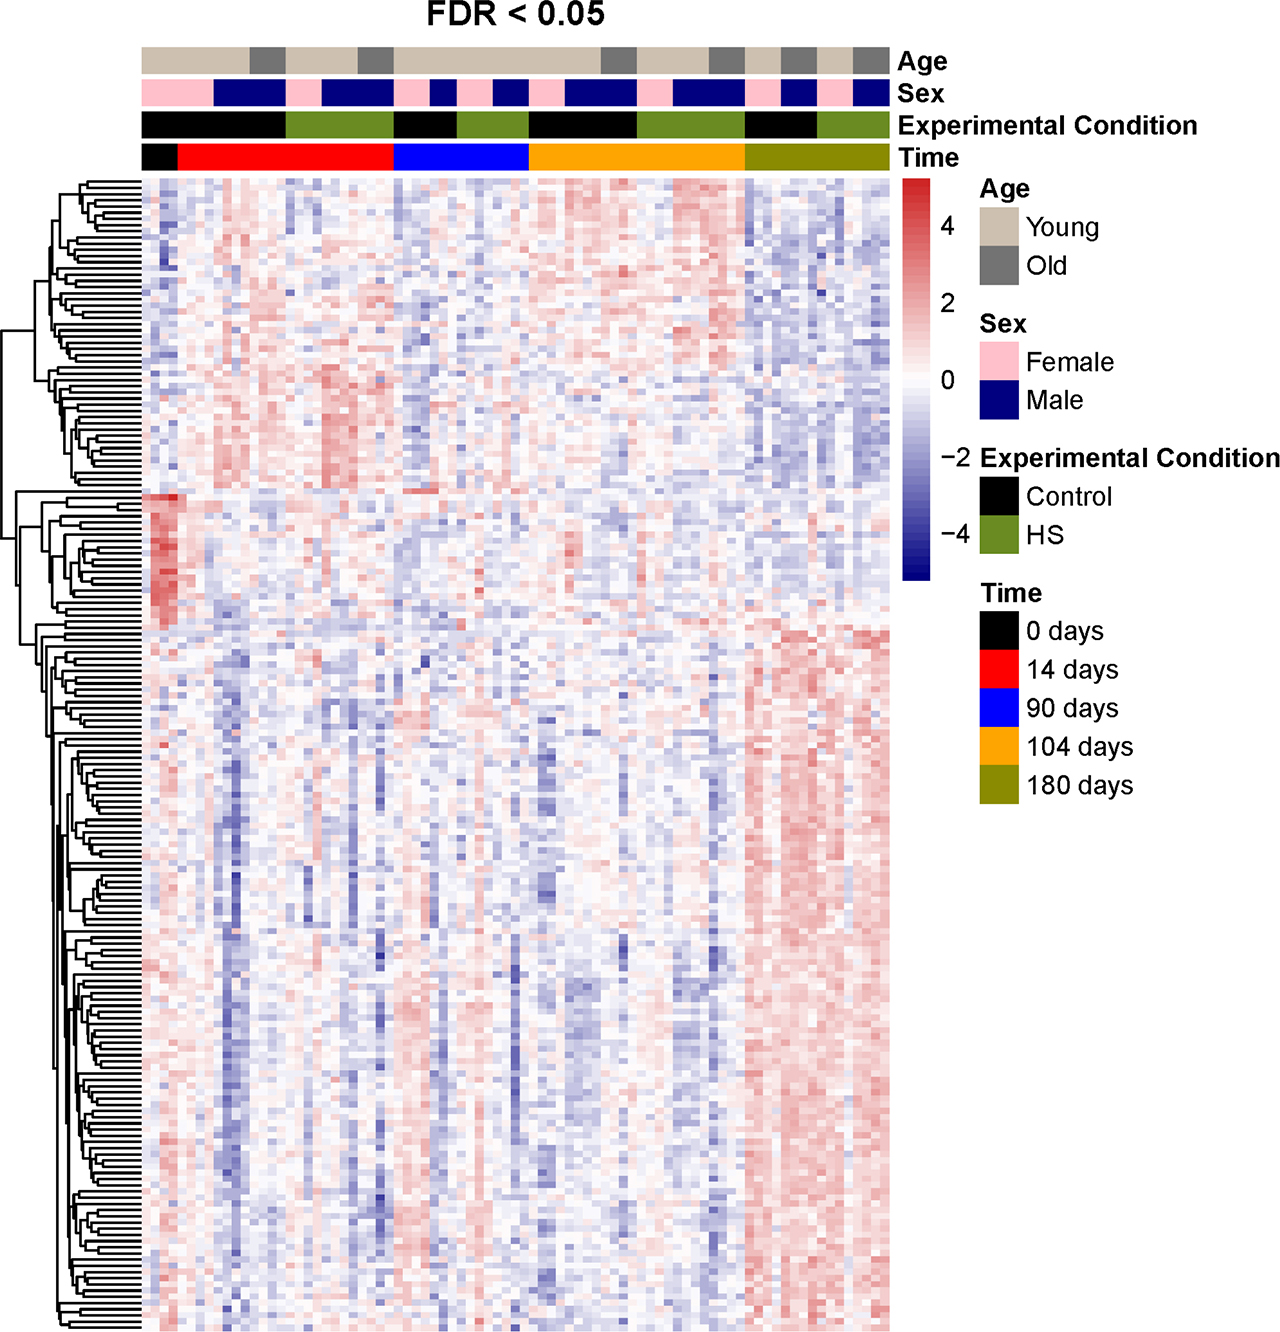
Figure 5
Heatmap of the significantly regulated genes (FDR < 0.05). Euclidean clustering was used for clustering the genes.
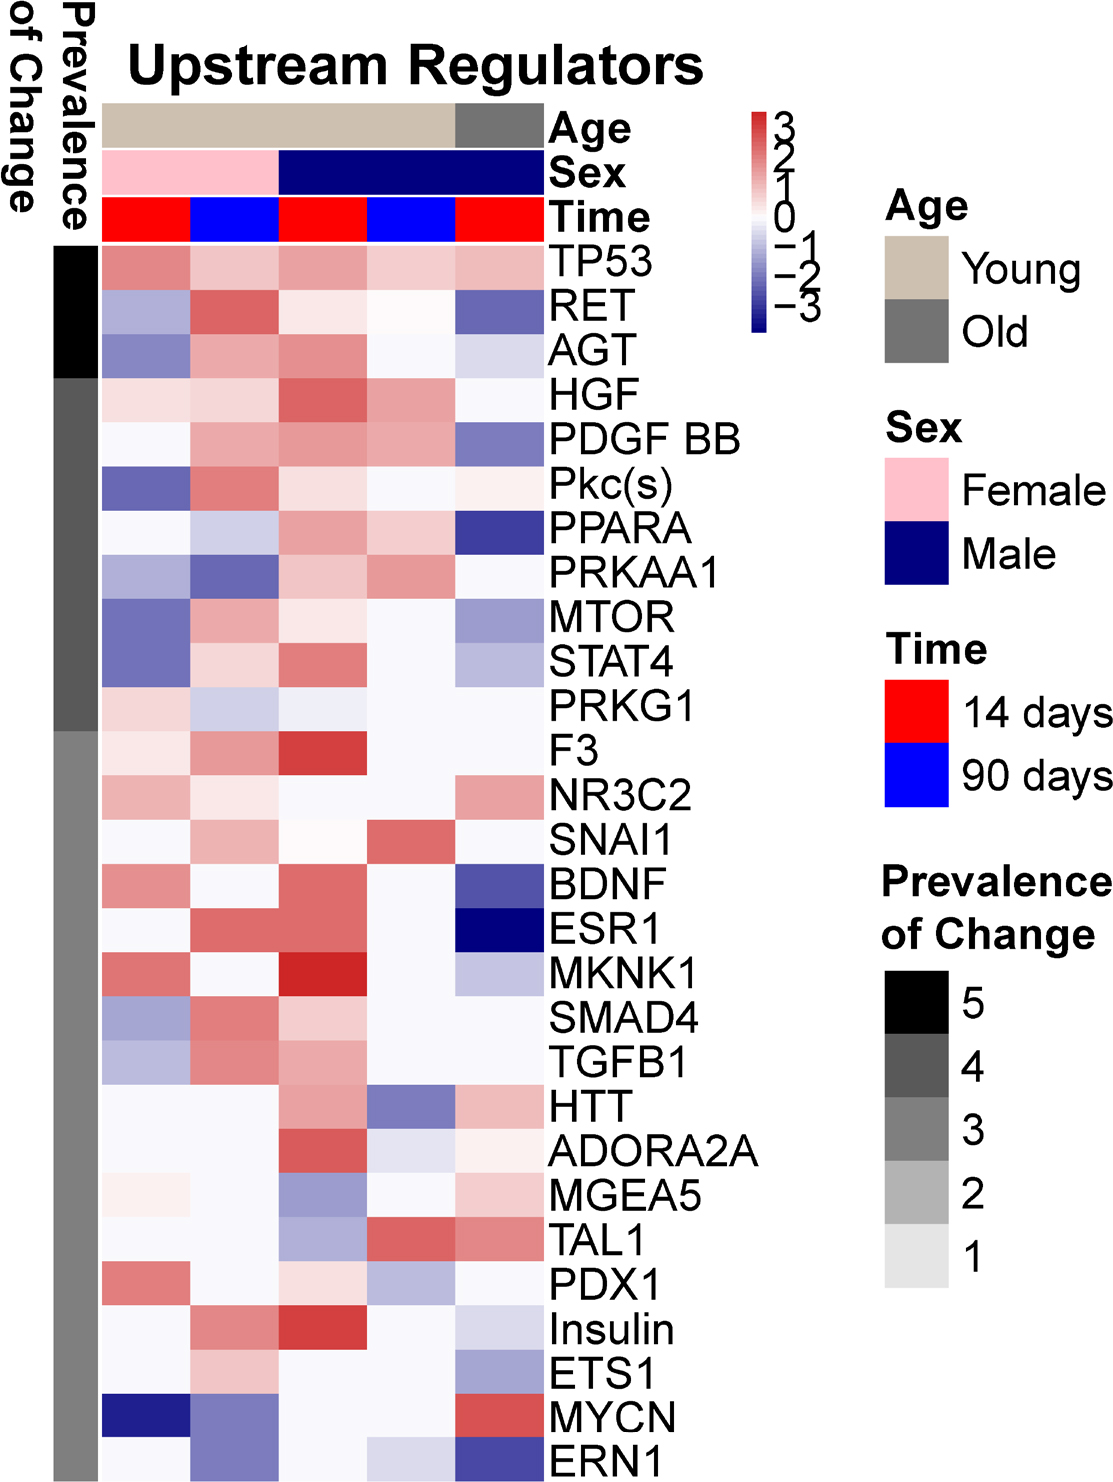
Figure 6
Upstream regulator analysis utilizing Ingenuity Pathway Analysis (IPA) on the significantly regulated genes (FDR < 0.05). The results are shown only for the common upstream regulators across 14 and 90 days as a heatmap of the activated z-scores.
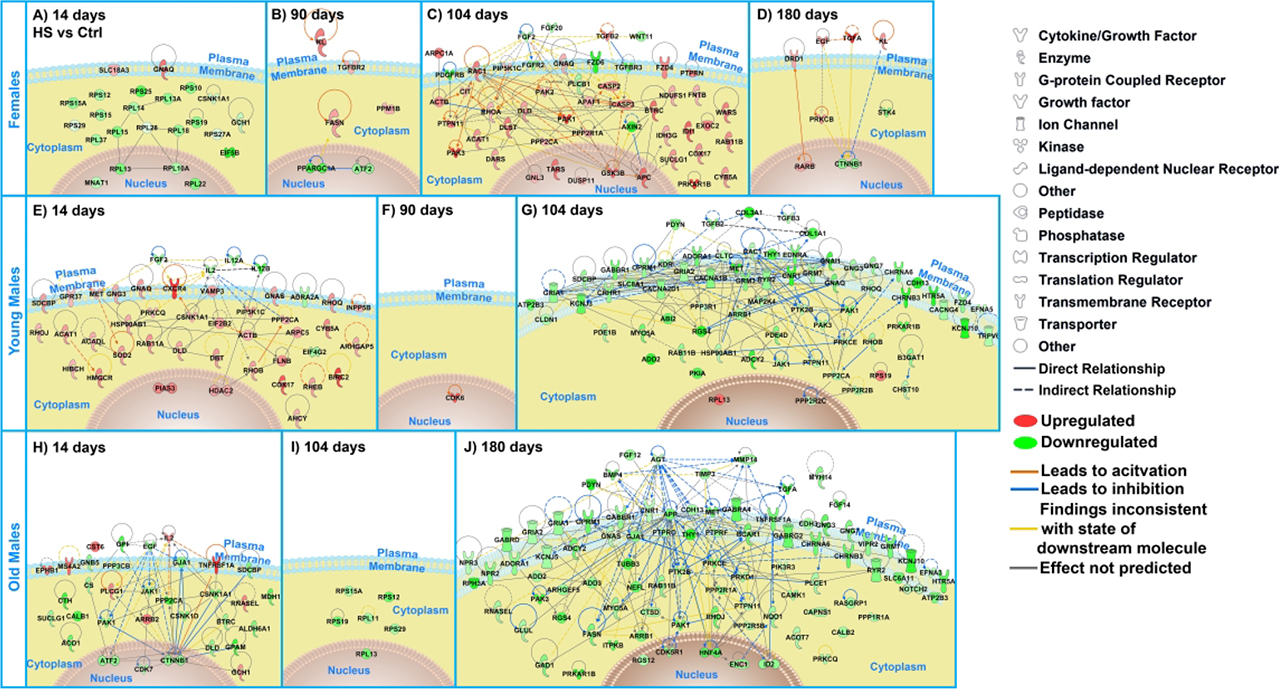
Figure 7
Network diagram of “Key Genes” comparing HS vs controls for females for (A) 14 days, (B) 90 days, (C) 104 days, and (D) 180 days. For young males for (E) 14 days, (F) 90 days, and (G) 104 days. For old males for (H) 14 days, (I) 104 days, and (J) 180 days. Transcriptionally upregulated genes in red, downregulated genes in green and connectivity with predicted relationships between these key genes are displayed using Ingenuity Pathway Analysis software. The figure legend indicates the line relationship with solid lines representing known direct relationships between the genes and dash lines representing the known indirect relationships. The arrows in the networks represent which direction the genes are acting on each other.
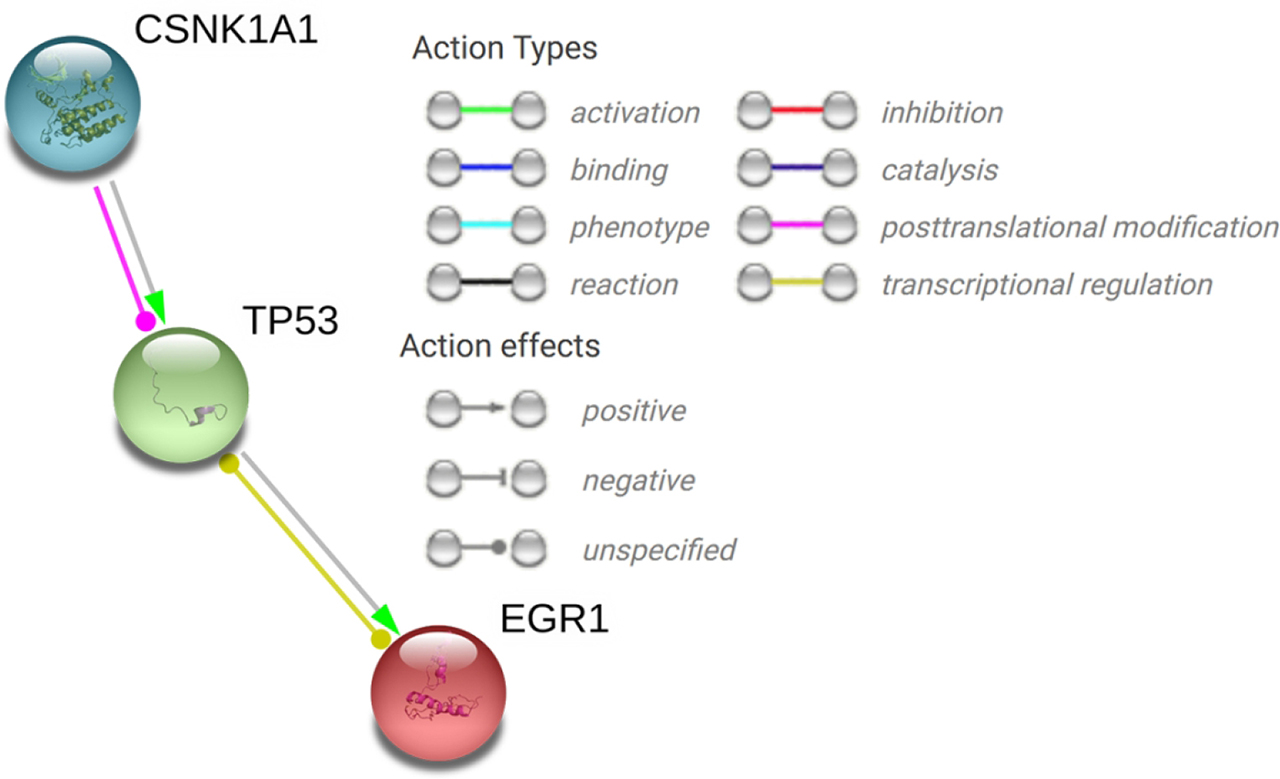
Figure 8
The network view of the key related genes CSNK1A1, TP53, and EGR1 interaction predicted using STRING. The figure legend displays the meaning of the line colors and symbols.