
Table 1
Key characteristics of the seed stocks of the nine ecotypes used in these studies.
| Name | Code | Latitude | Altitude (m) | Mean temperature (°C) Spring/Fall | Origin | Source | Stock # |
|---|---|---|---|---|---|---|---|
| Tenela | Te-0 | N63° | 1–100 | 0–2/7–8 | Finland | ABRC | CS1550 |
| Sweden | SW | N62° | NA | NA | Sweden | MSU | ** |
| Osthammar | Ost-1 | N61° | 1–100 | 0–2/5–6 | Sweden | ABRC | CS1430 |
| Columbia | Col-0 | N52° | 1–100 | 15–16/21–22 | Poland | MSU | ** |
| Dresden | Dr-0 | N51° | 100–200 | 7–8/9–10 | Germany | ABRC | CS1114 |
| Italy | IT | N42° | NA | NA | Italy | MSU | ** |
| Coimbra | Co-2 | N40° | 100–200 | 11–12/17–18 | Portugal | ABRC | CS1086 |
| Martuba | Mt-0 | N28° | 100–200 | 15–16/15–16 | Libya | ABRC | CS22642 |
| Cape Verde Is | Cvi-0 | N16° | 1200 | NA | Cape Verde | ABRC | CS8580 |
[i] ABRC, Arabidopsis Biological Resource Center (https://abrc.osu.edu/); MSU, Michigan State University (see Materials and Methods section).
Table 2
Number of seedlings grown from each ecotype and used for the temperature experiments.
| Seed code | Growth temperature | ||||
|---|---|---|---|---|---|
| 11 °C | 15 °C | 25 °C | 30 °C | 35 °C | |
| Te-0 | nt | 36 | 24 | nt | 37 |
| SW | 48 | 36 | 36 | 48 | 36 |
| Ost-1 | nt | 24 | 24 | nt | 20 |
| Col-0 | 48 | 36 | 36 | 48 | 36 |
| Dr-0 | nt | 36 | 24 | nt | 36 |
| IT | 48 | 36 | 33 | 48 | 37 |
| Co-2 | nt | 27 | 24 | nt | 24 |
| Mt-0 | 23 | 36 | 36 | 25 | 36 |
| Cvi-0 | nt | 33 | 24 | nt | 36 |
[i] “nt” = not tested because of limited seed stock.
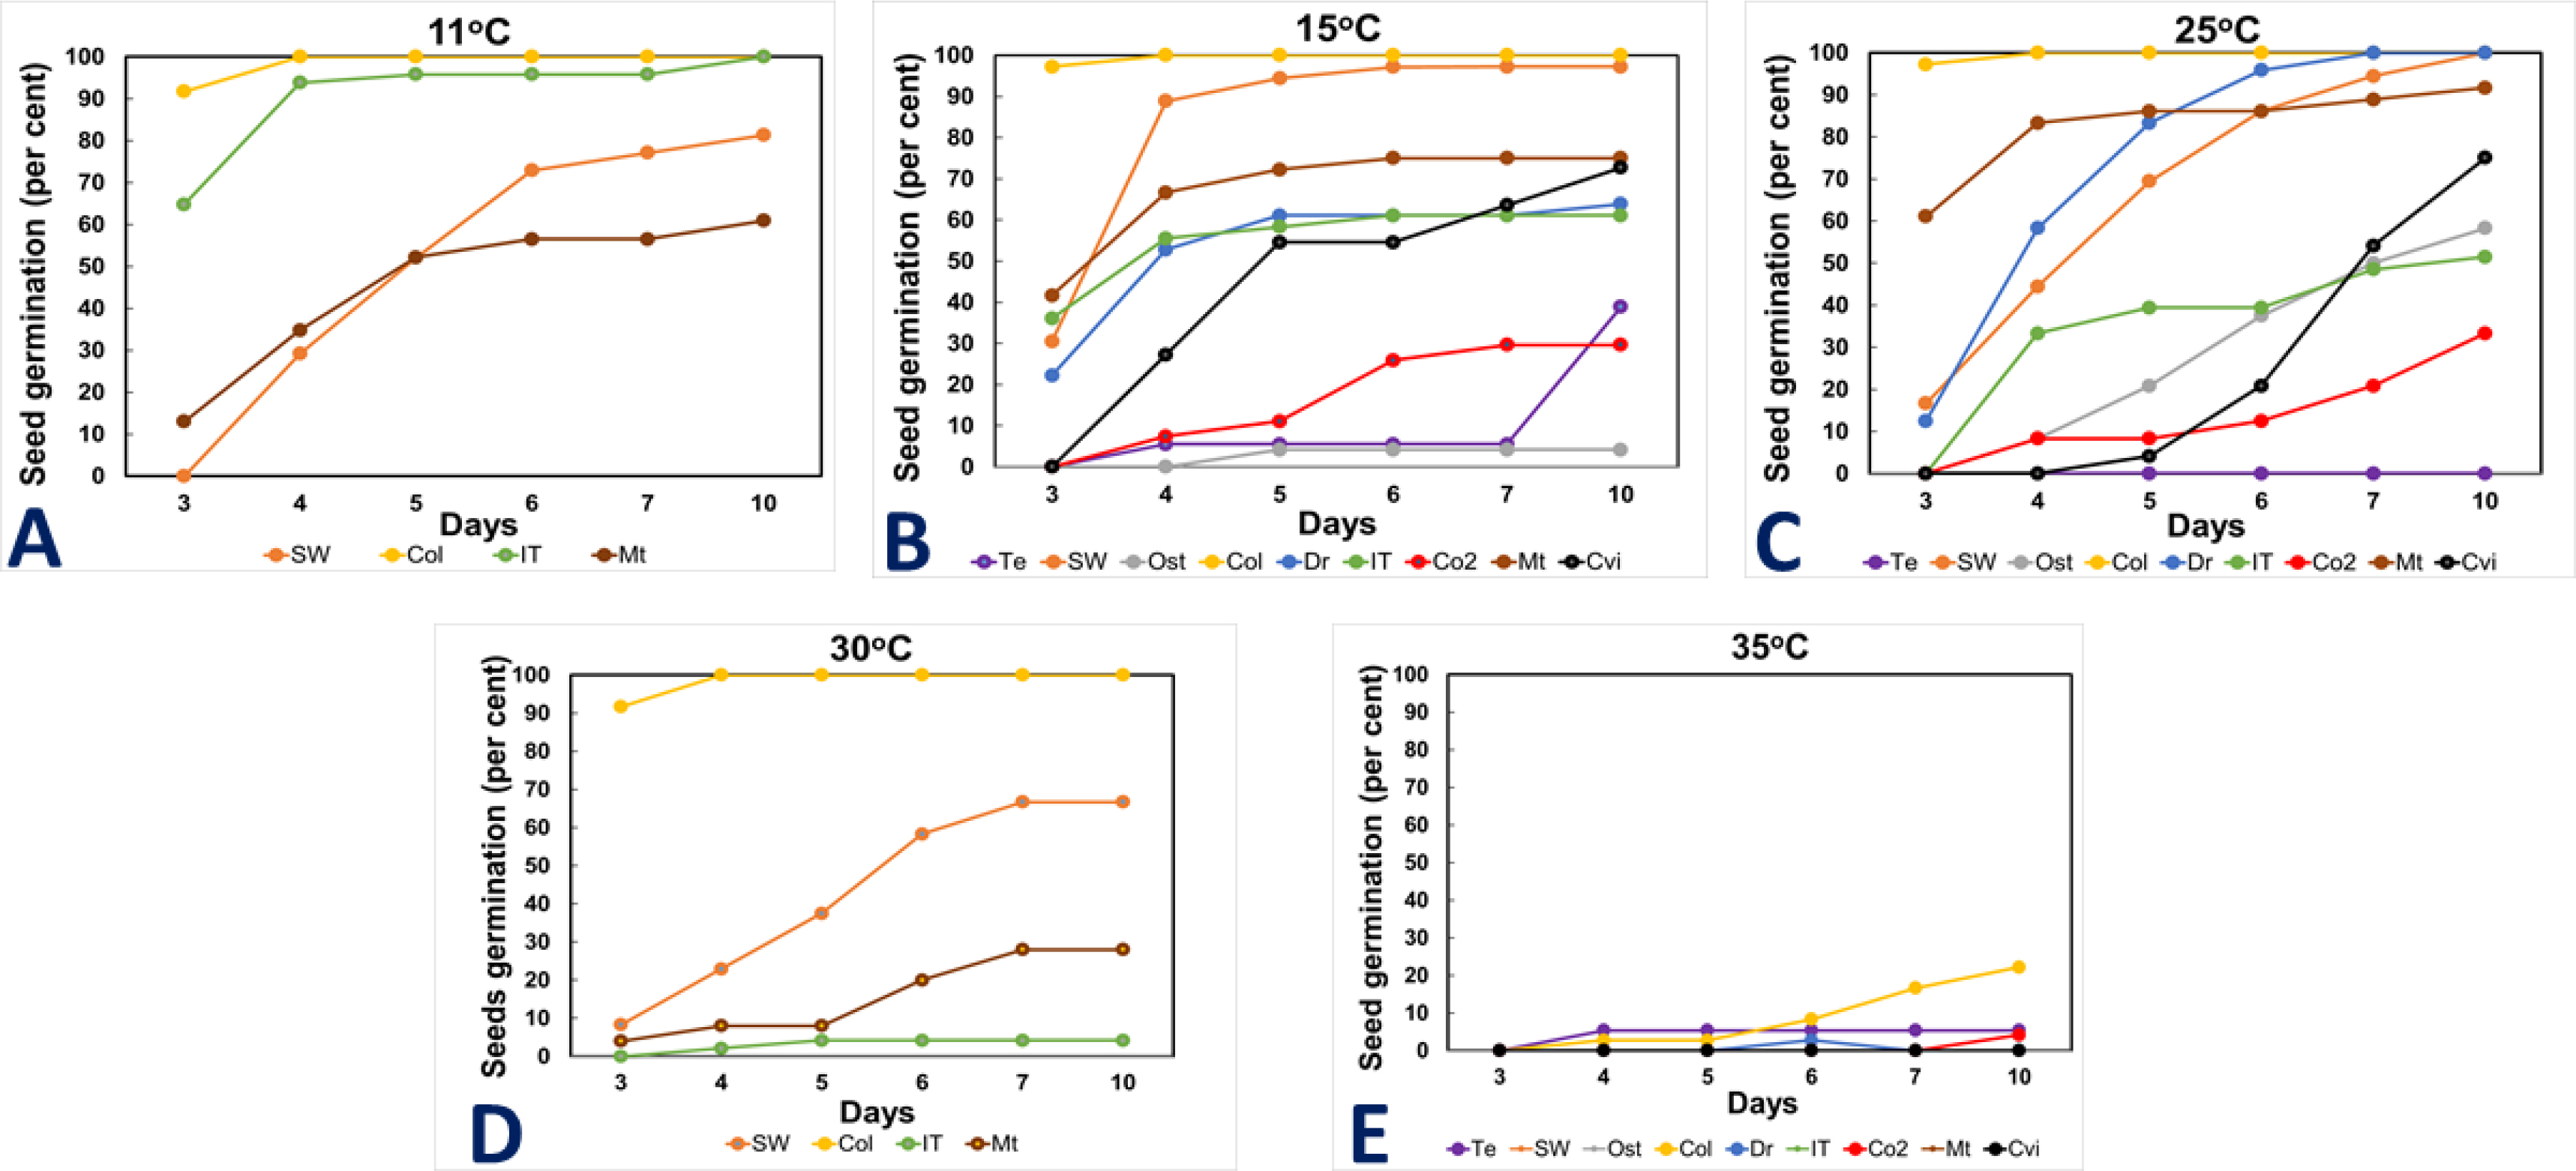
Figure 1
Studies of seed germination of various ecotypes of Arabidopsis thaliana from different latitudes. Ecotypes are listed from north (63°N) to south (16°N) at the bottom of each plot. Seeds were incubated at the indicated temperatures in continuous illumination, and seed germination was assayed at days 3–10 after the start of the experiment. Note that the Col-0 ecotype had the highest germination under all conditions studied and nearly 100% in the temperature range of 11–30 °C. The sample sizes are provided in Table 2.
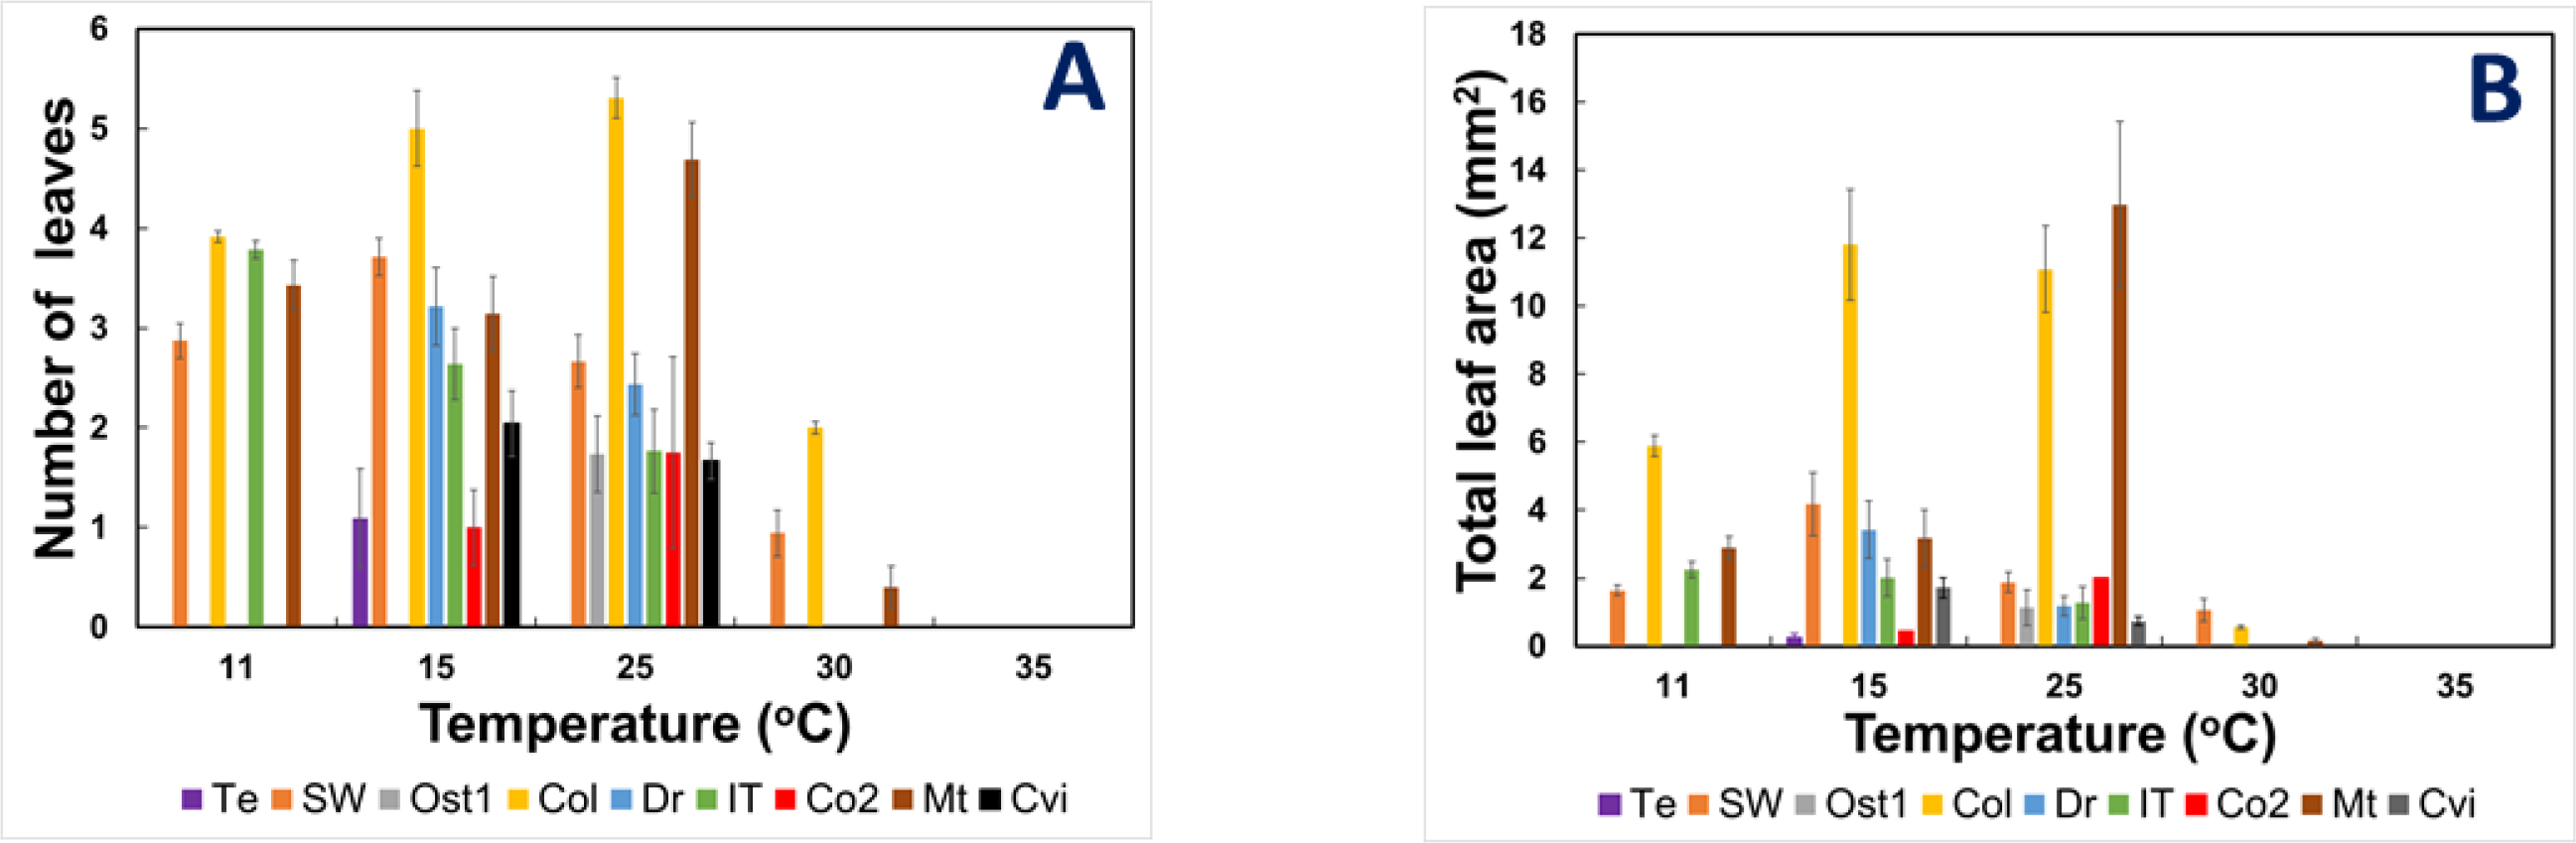
Figure 2
Leaf development assayed by the (A) number of leaves and (B) total area of the leaves in the seedlings at the indicated temperatures in continuous illumination. In terms of the number of leaves (A), the Col-0 ecotype had the greatest number of leaves for all temperatures tested. As indicated by leaf area (B), Col-0 had the largest area when the data were taken together from 11 to 25 °C while the Mt ecotype was an overall second in this latter criterion. The sample sizes are provided in Table 2. Bars indicate SE.
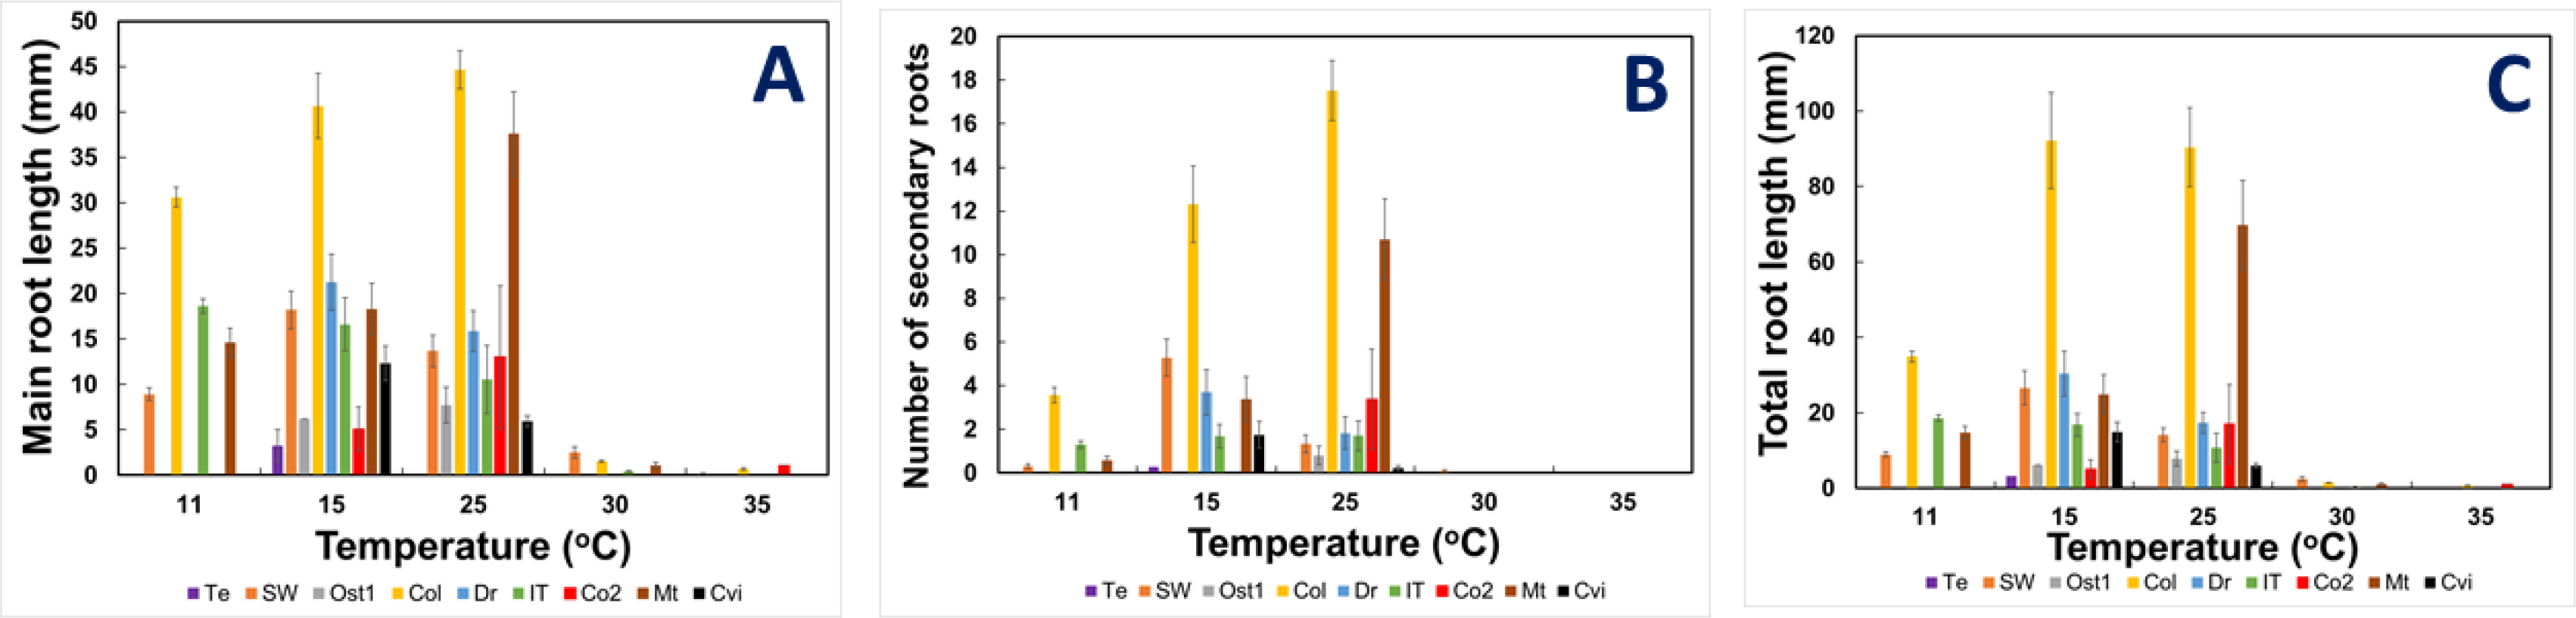
Figure 3
Root development as determined by the (A) main root length, (B) number of secondary roots, and (C) length of the total root network of the seedlings at the indicated temperatures in continuous illumination. Based on these criteria, Col-0 exhibited the most robust growth from 11 to 25 °C. The sample sizes are provided in Table 2. Bars indicate SE.
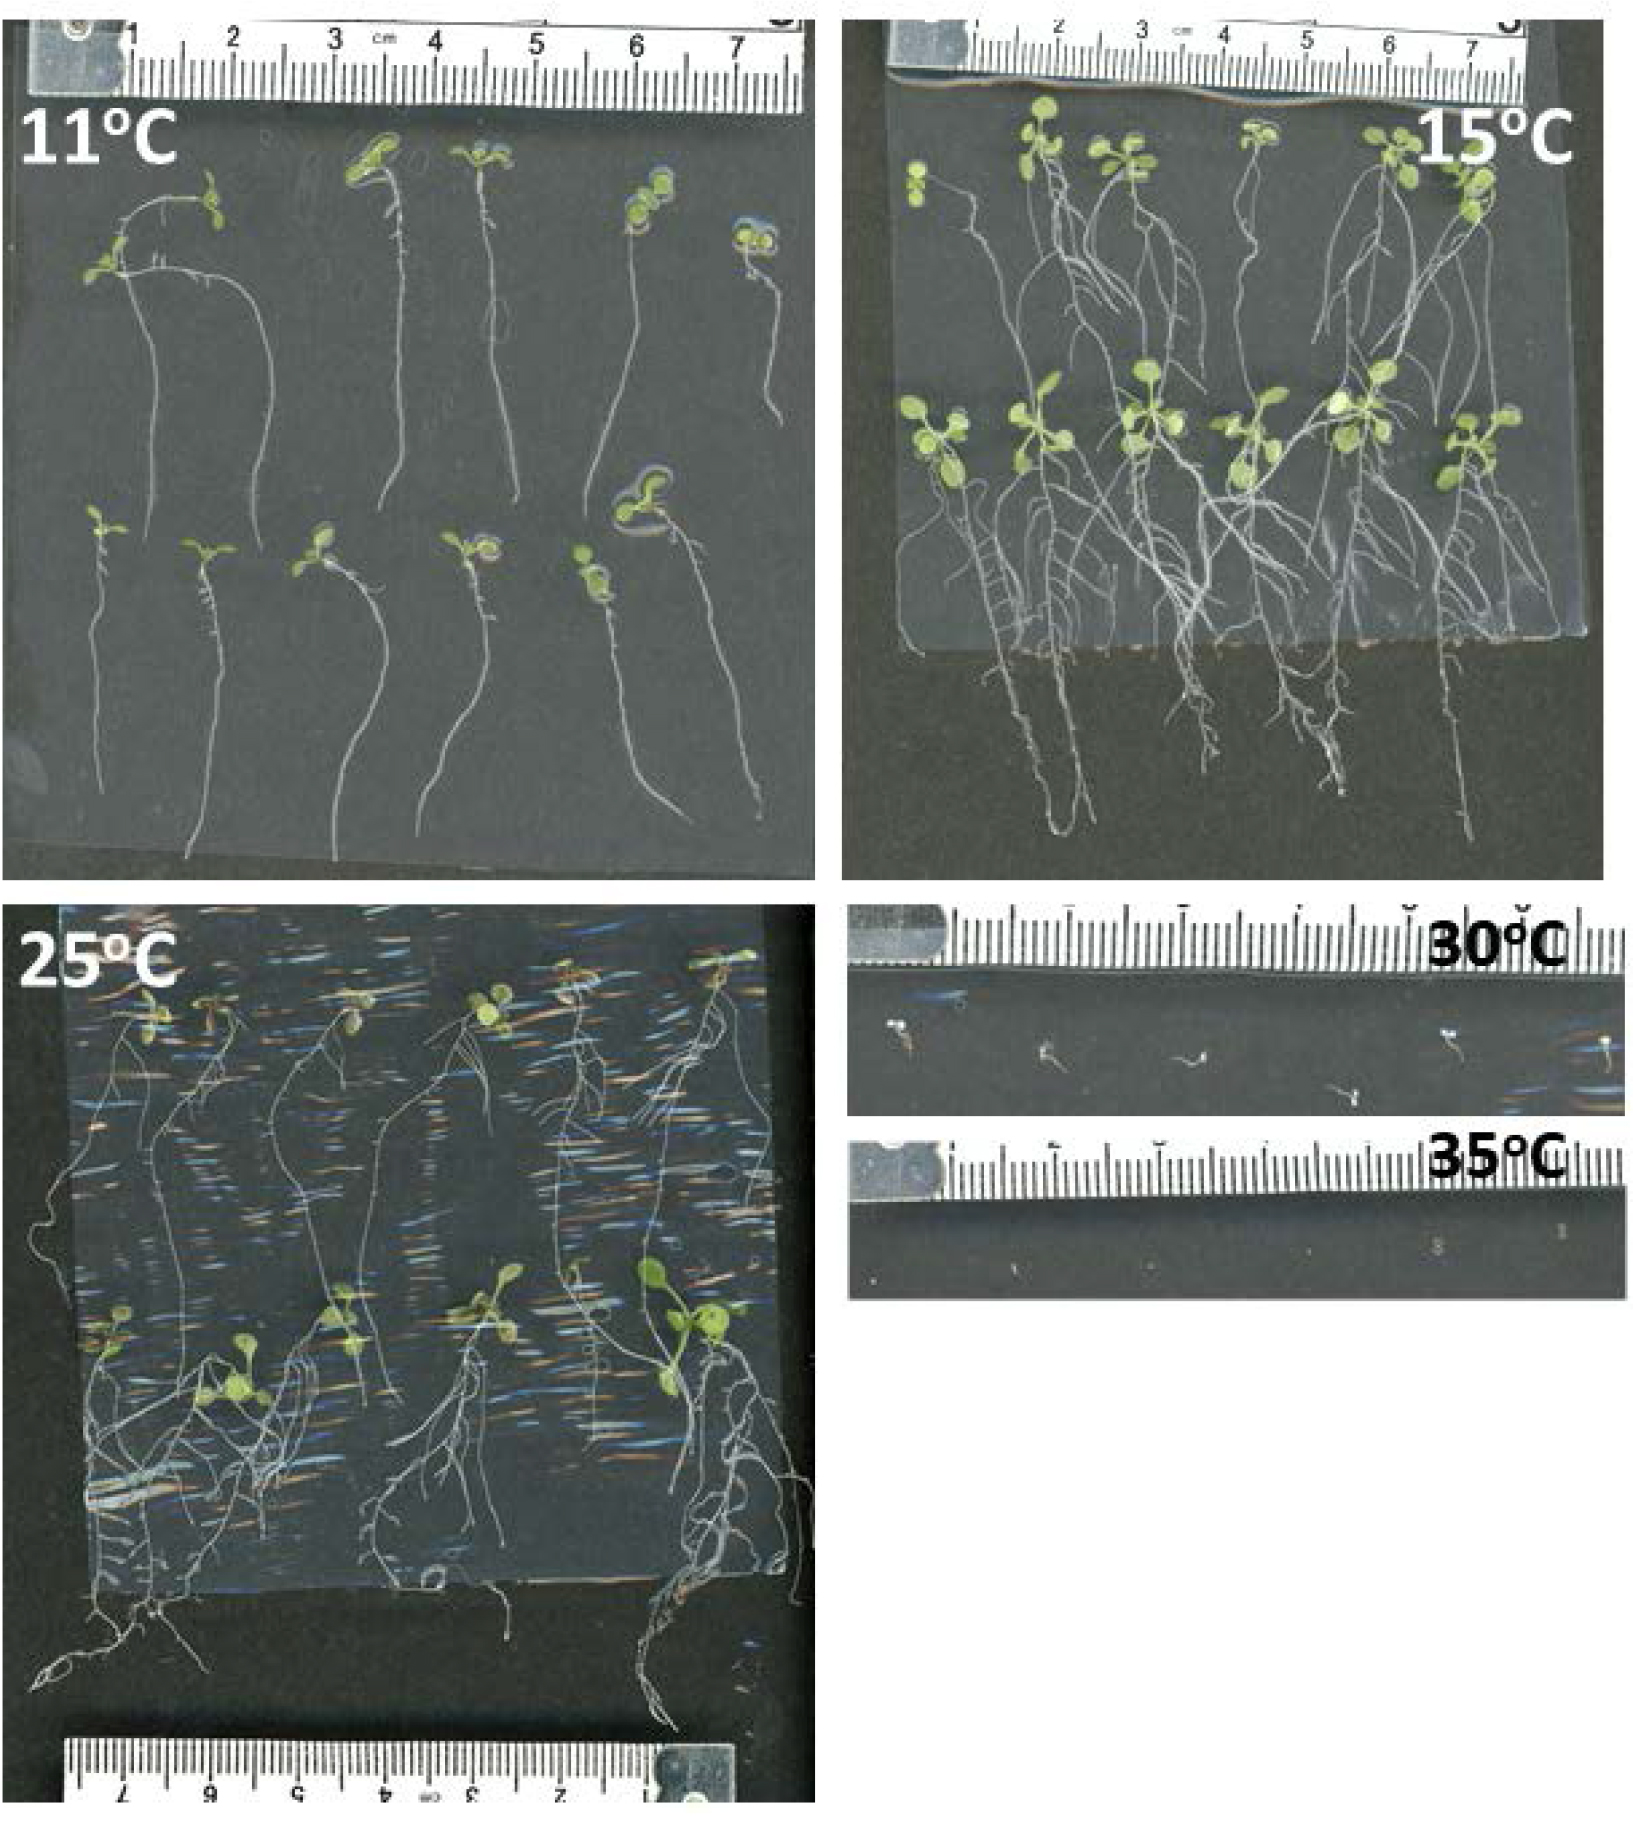
Figure 4
Images of seedlings of the Col-0 ecotype of Arabidopsis thaliana after 10 days at 11, 15, 25, 30, and 35 °C. While there was good growth at 11 °C, the most robust plants were at incubation at 15–25 °C, and plants at these temperatures had a very extensive secondary root system. There was minimal growth at 30 °C and limited germination at 35 °C. Overall, this ecotype had the most robust growth at a wide temperature range. Note that in some images, there were reflections from the plastic Petri dishes. The large units on the scale reference are in centimeters.
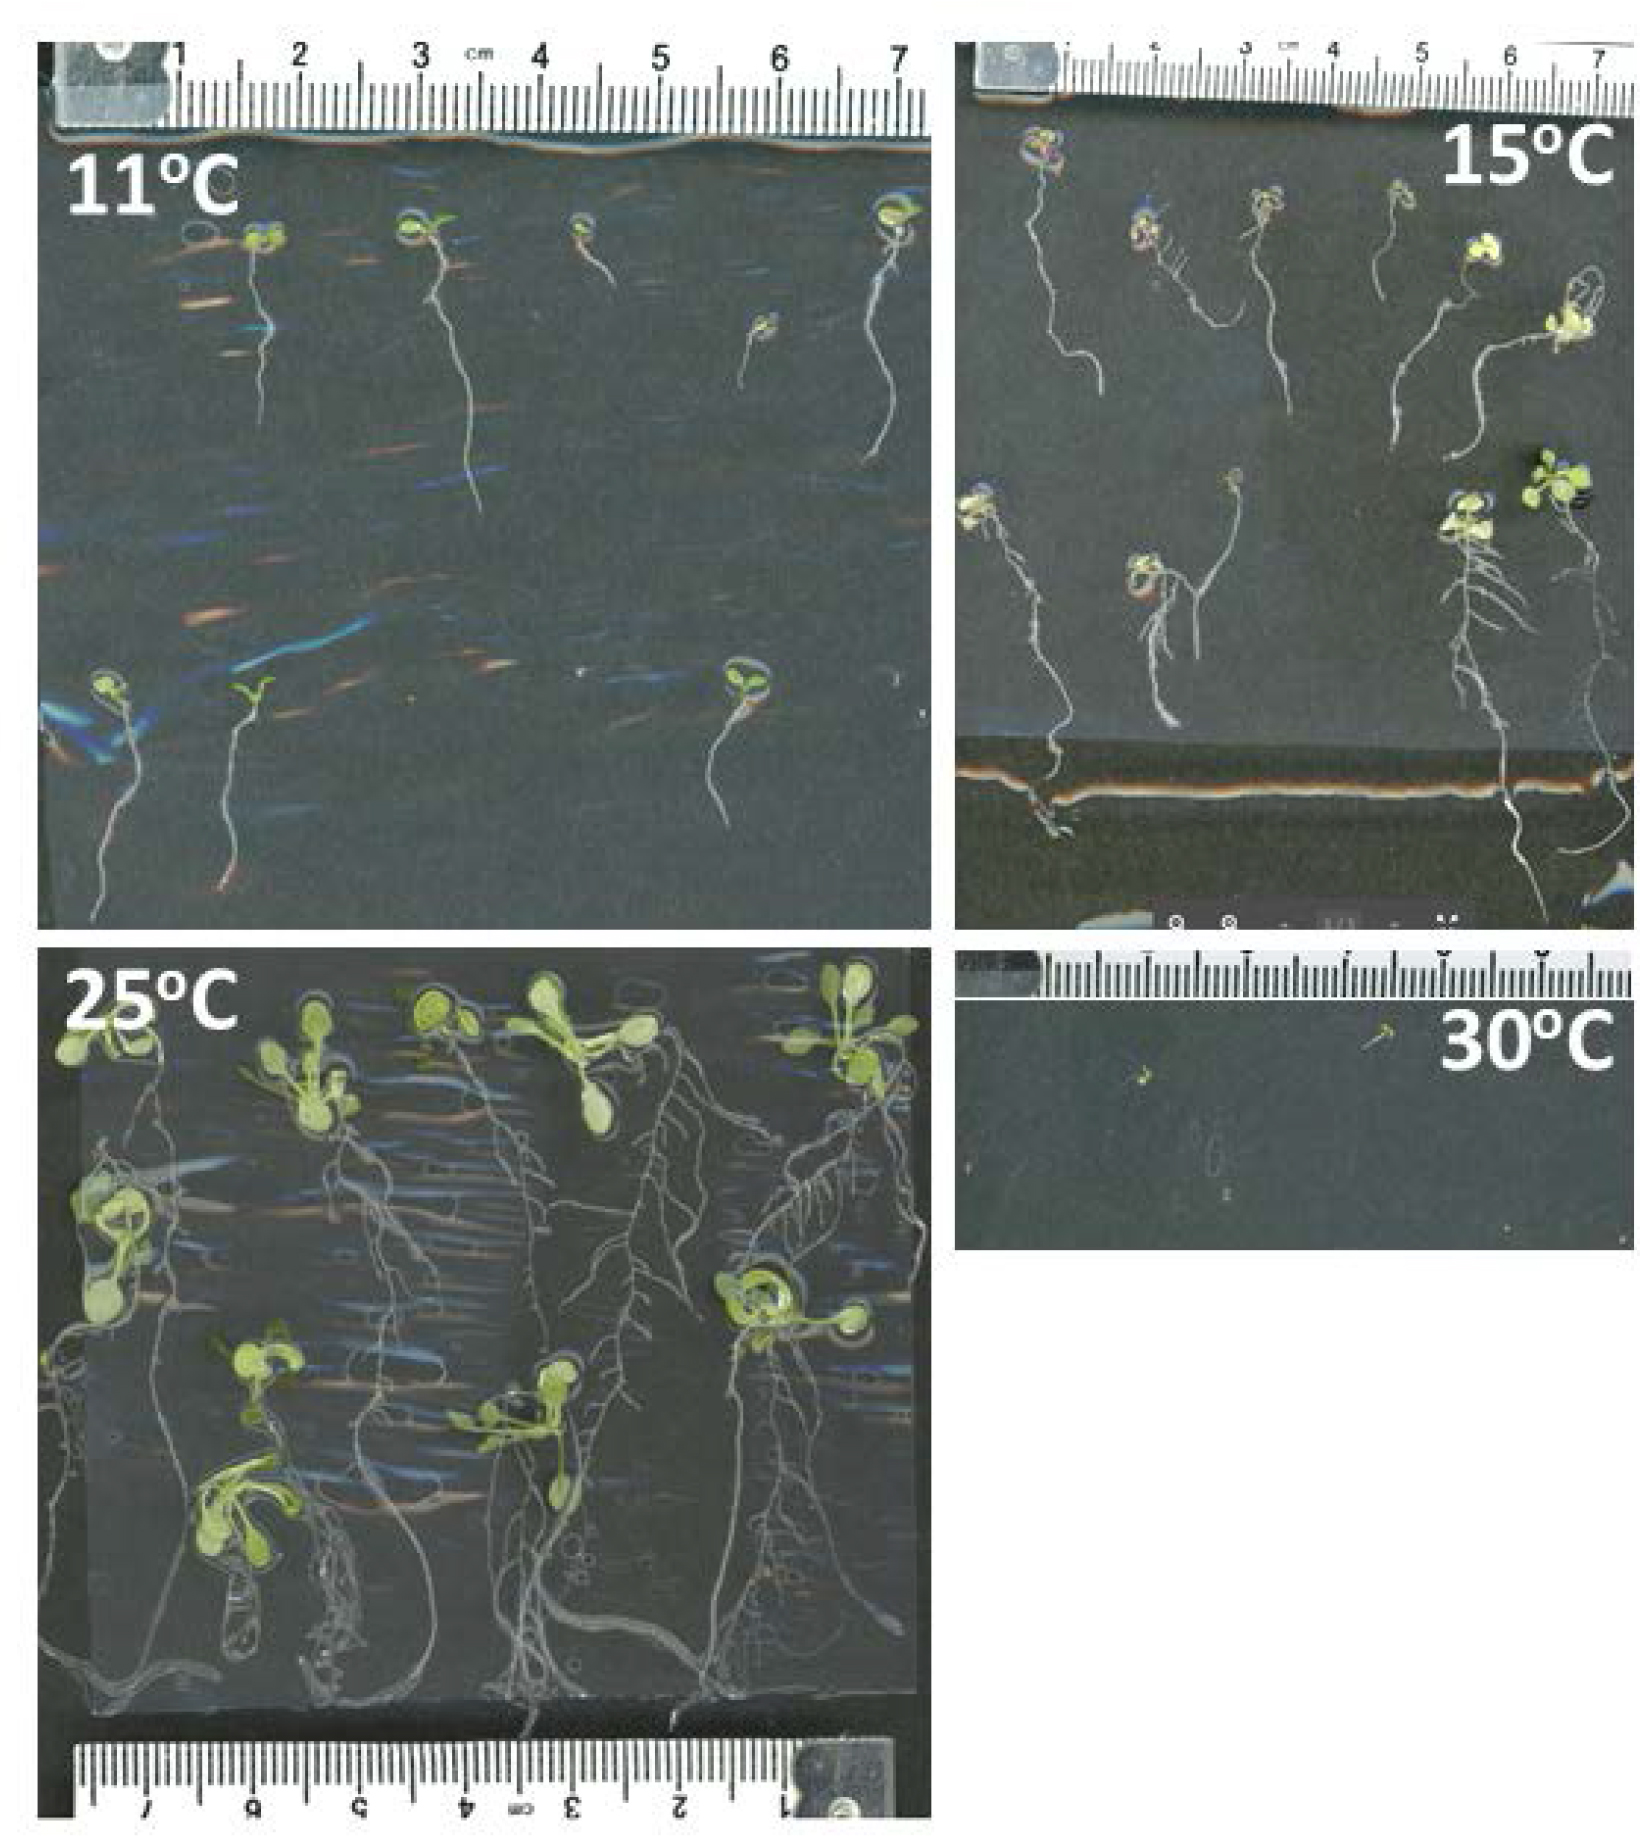
Figure 5
Images of seedlings of the Mt ecotype of Arabidopsis thaliana after 10 days at 11, 15, 25, 30, and 30 °C. This ecotype was the second-best in overall growth characteristics and did particularly well at 25 °C. There was minimal growth at 30 °C and no germination or growth at 35 °C. Note that in some images, there were reflections from the plastic Petri dishes. The large units on the scale reference are in centimeters.