
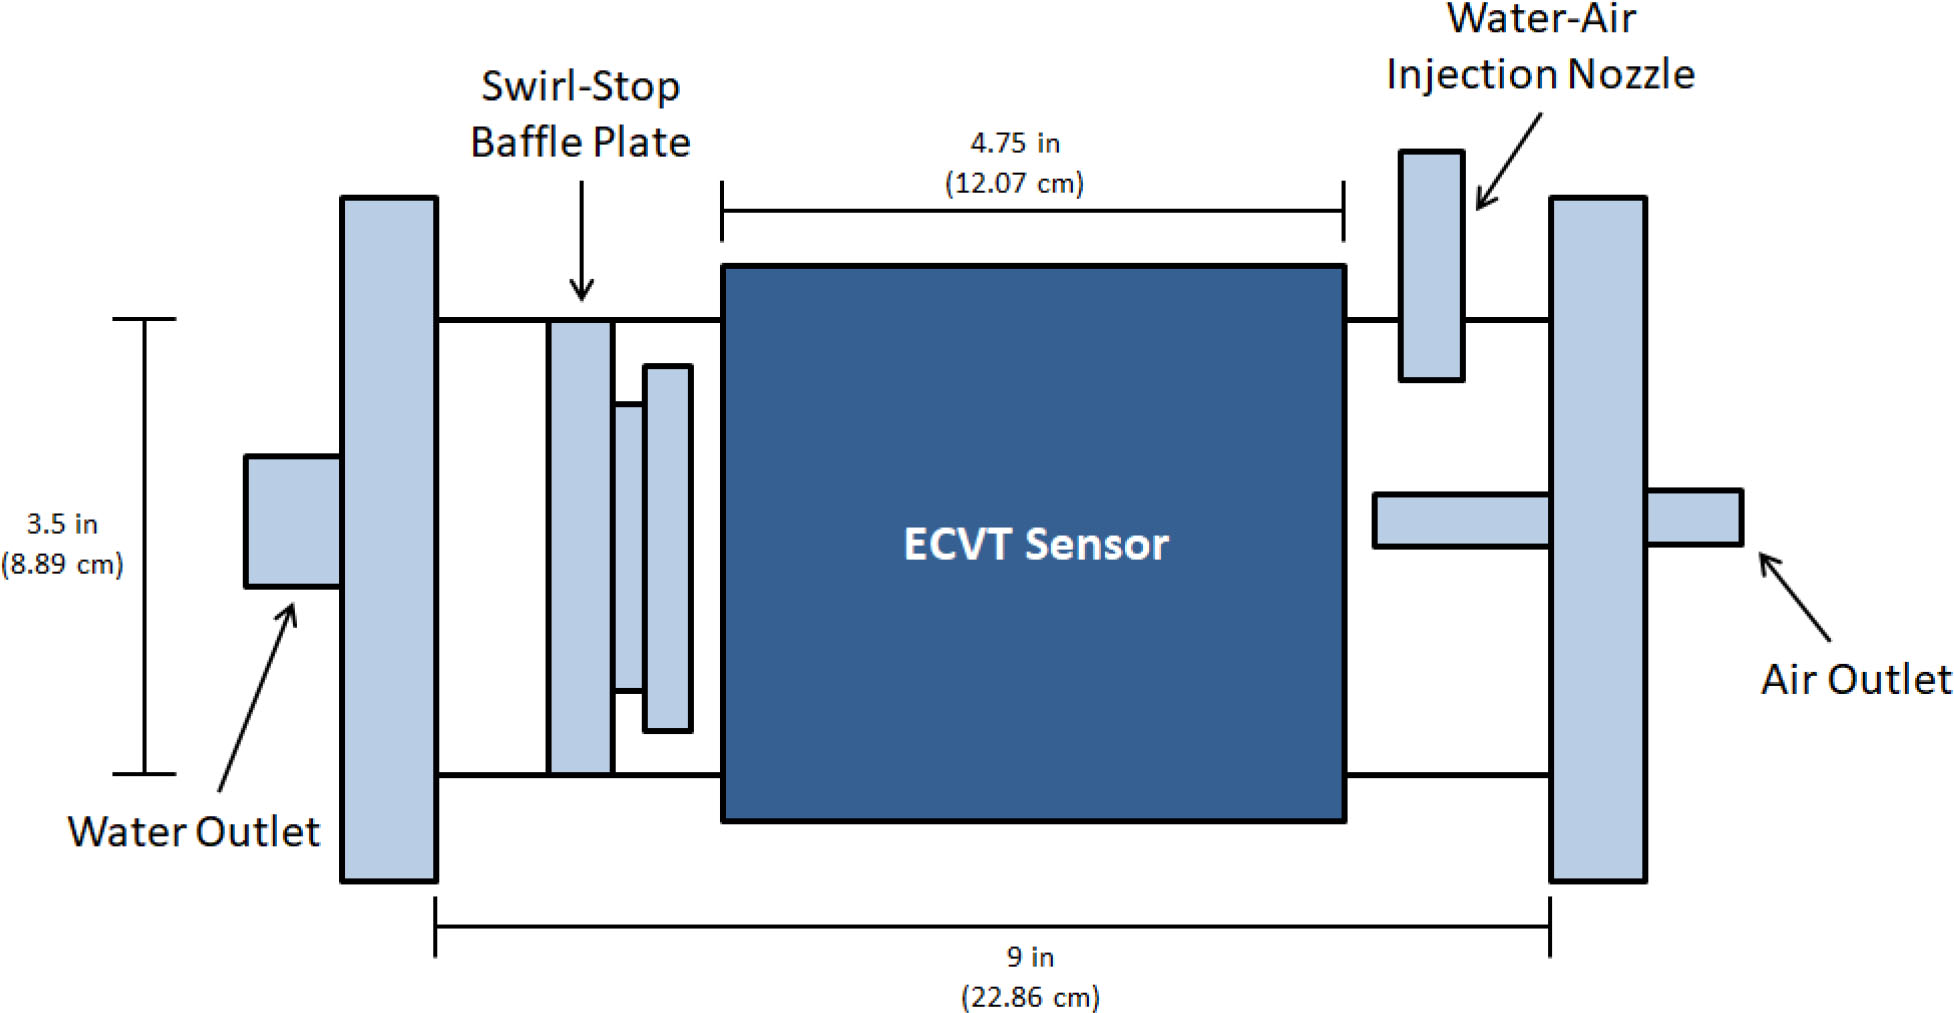
Figure 1
Diagram of test passive cyclonic gas-liquid separators with an electrical capacitance phase tomography (ECVT) sensor placed around it. The ECVT sensor is placed such that almost the entire gas core is within the sensing region.
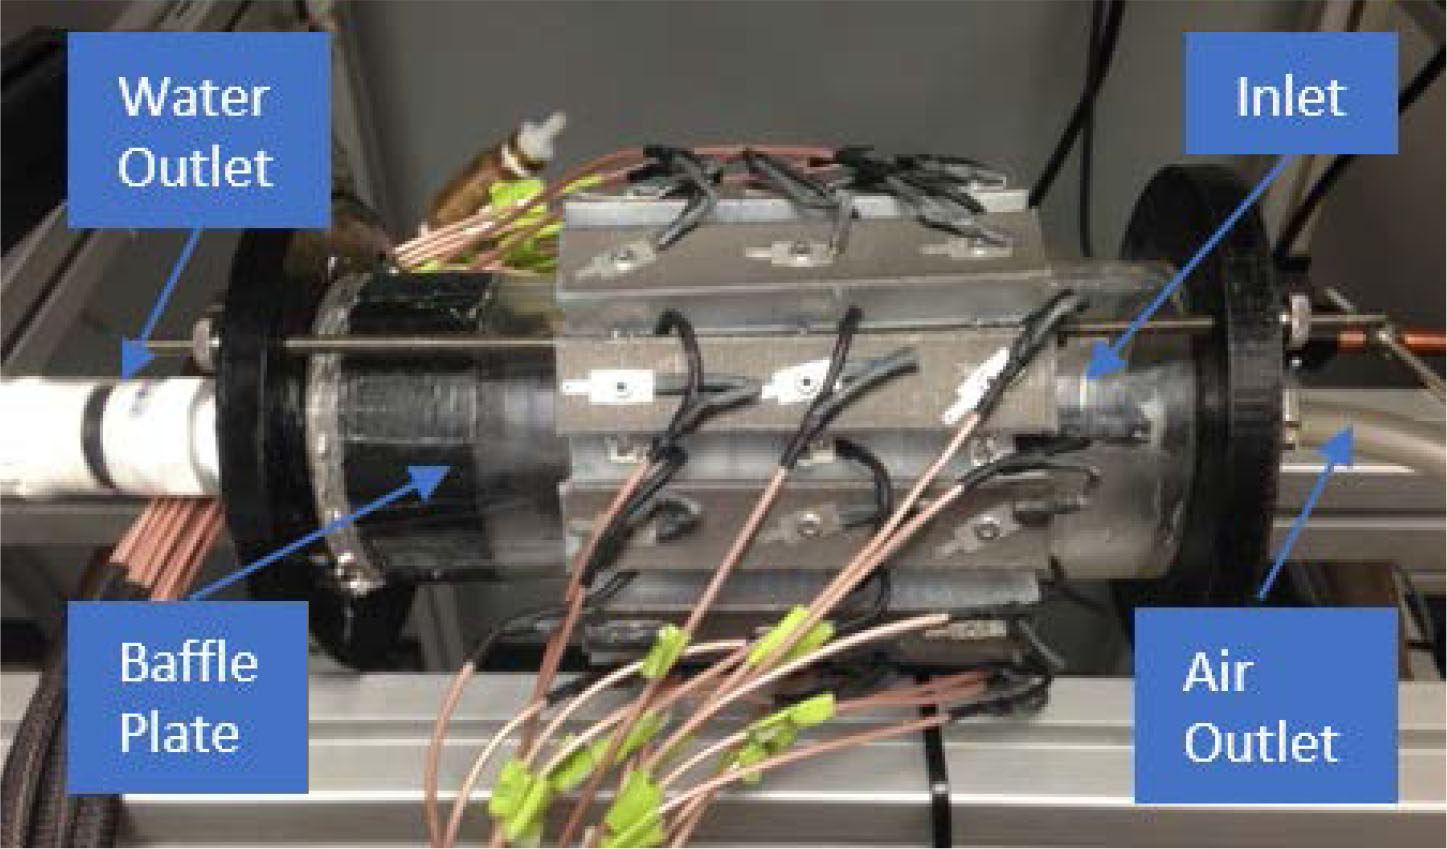
Figure 2
Photograph of the passive cyclonic gas-liquid separators with the electrical capacitance phase tomography sensor placed around it. The cables coming out of the sensor connect each capacitor plate to the data acquisition system.
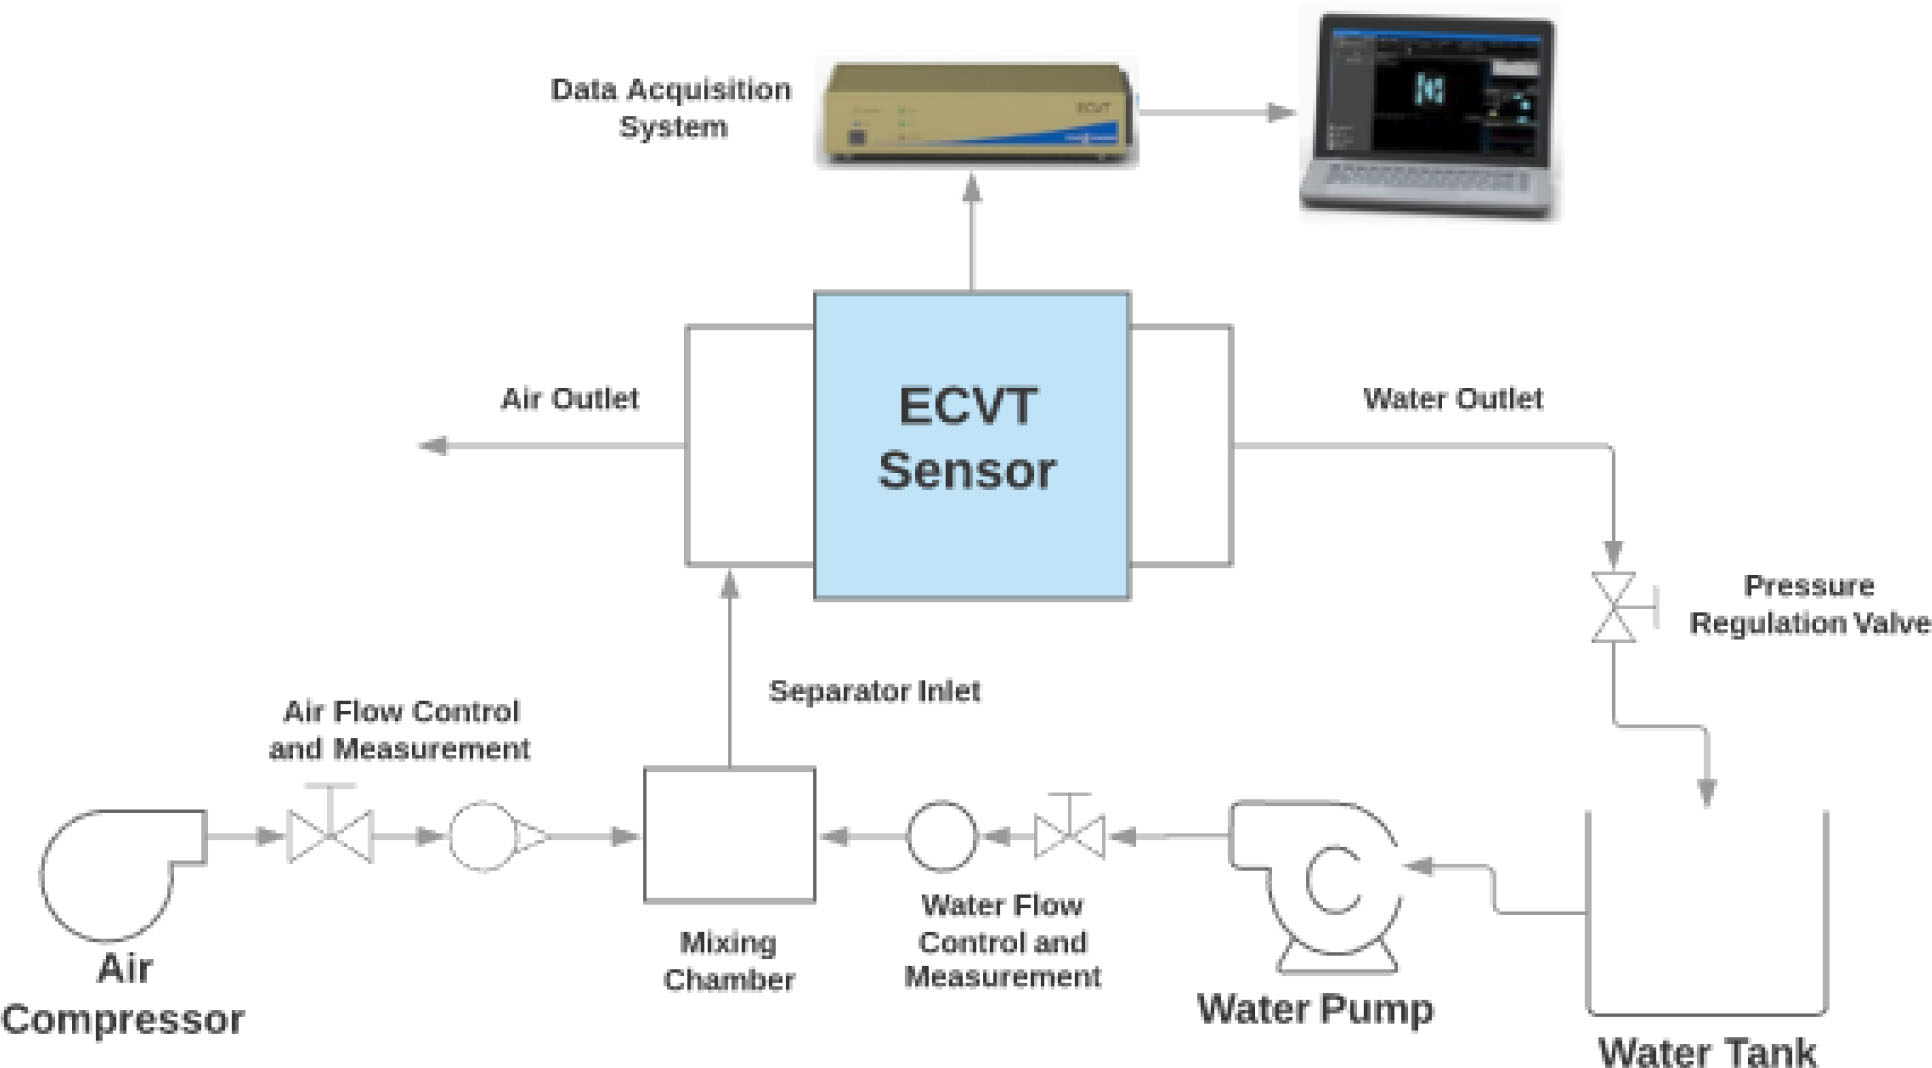
Figure 3
Passive cyclonic gas-liquid separators (PCGLS) flow loop diagram. An air compressor supplies the air flow and a water pump supplies the water flow. The two phases are mixed in a mixing chamber before being injected into the PCGLS.
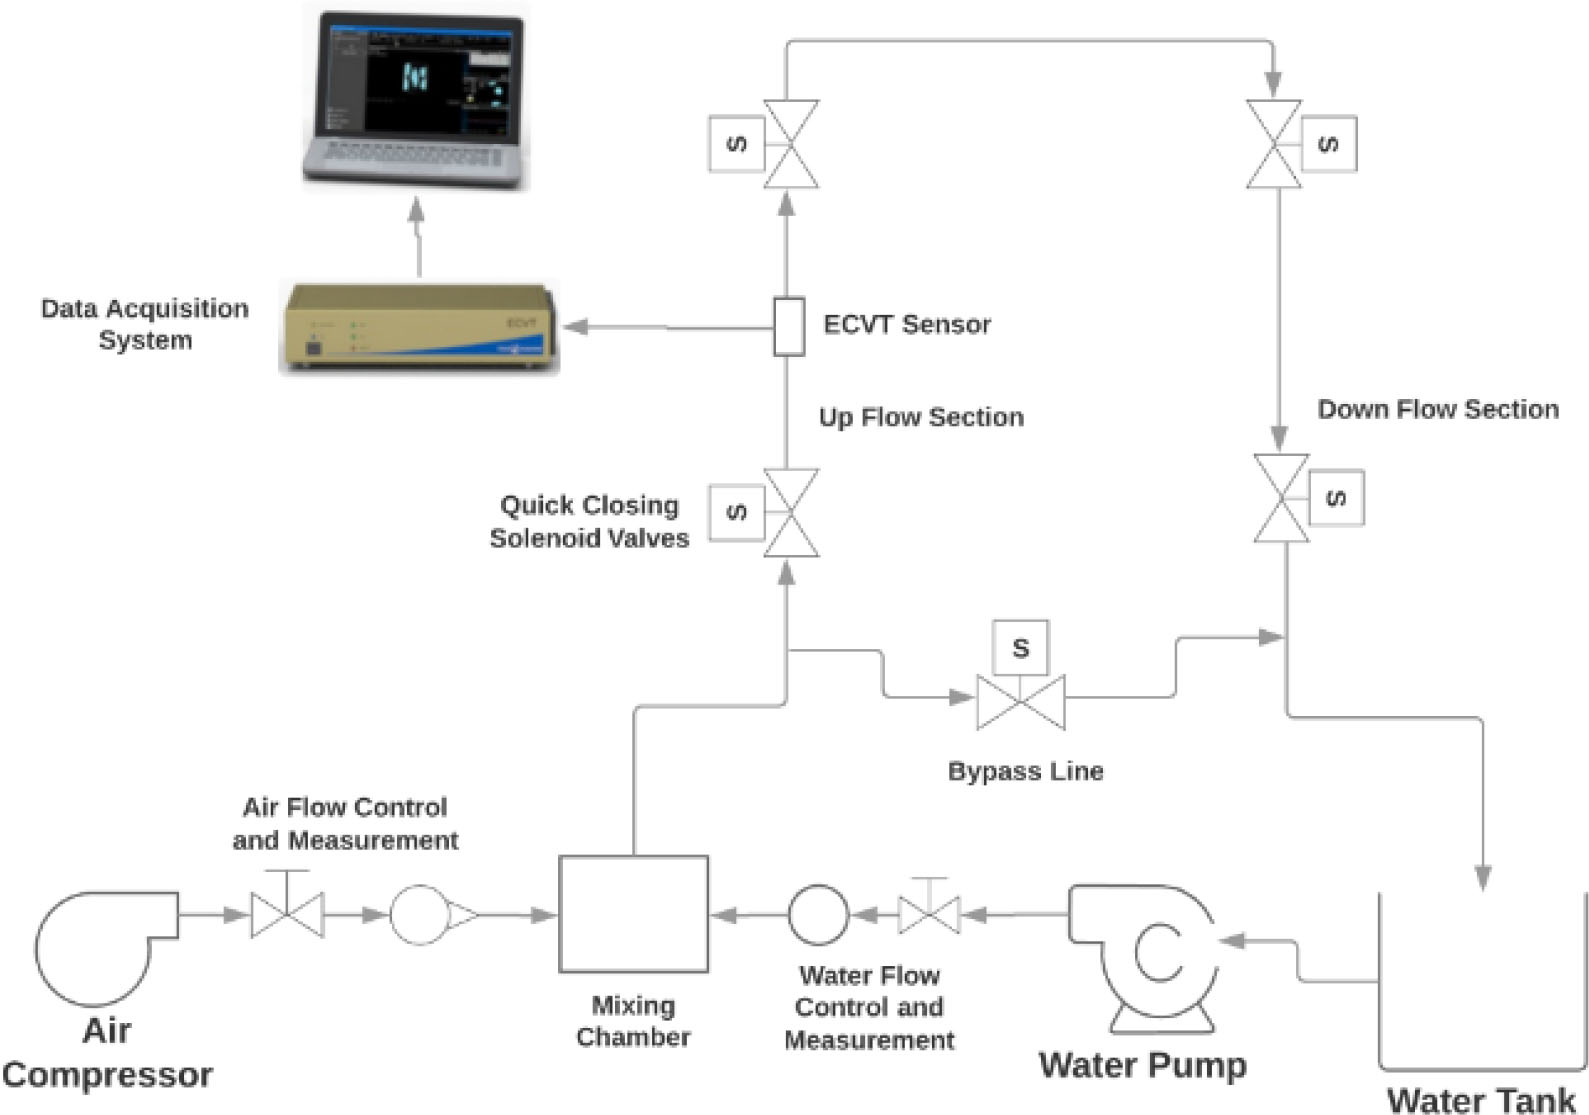
Figure 4
Air-water test flow loop diagram. The test section is oriented vertically to negate the effects of gravity on the flow. Quick close valves are used to stop the flow and measure the amount of water that settled, allowing for the calculation of the average liquid holdup.
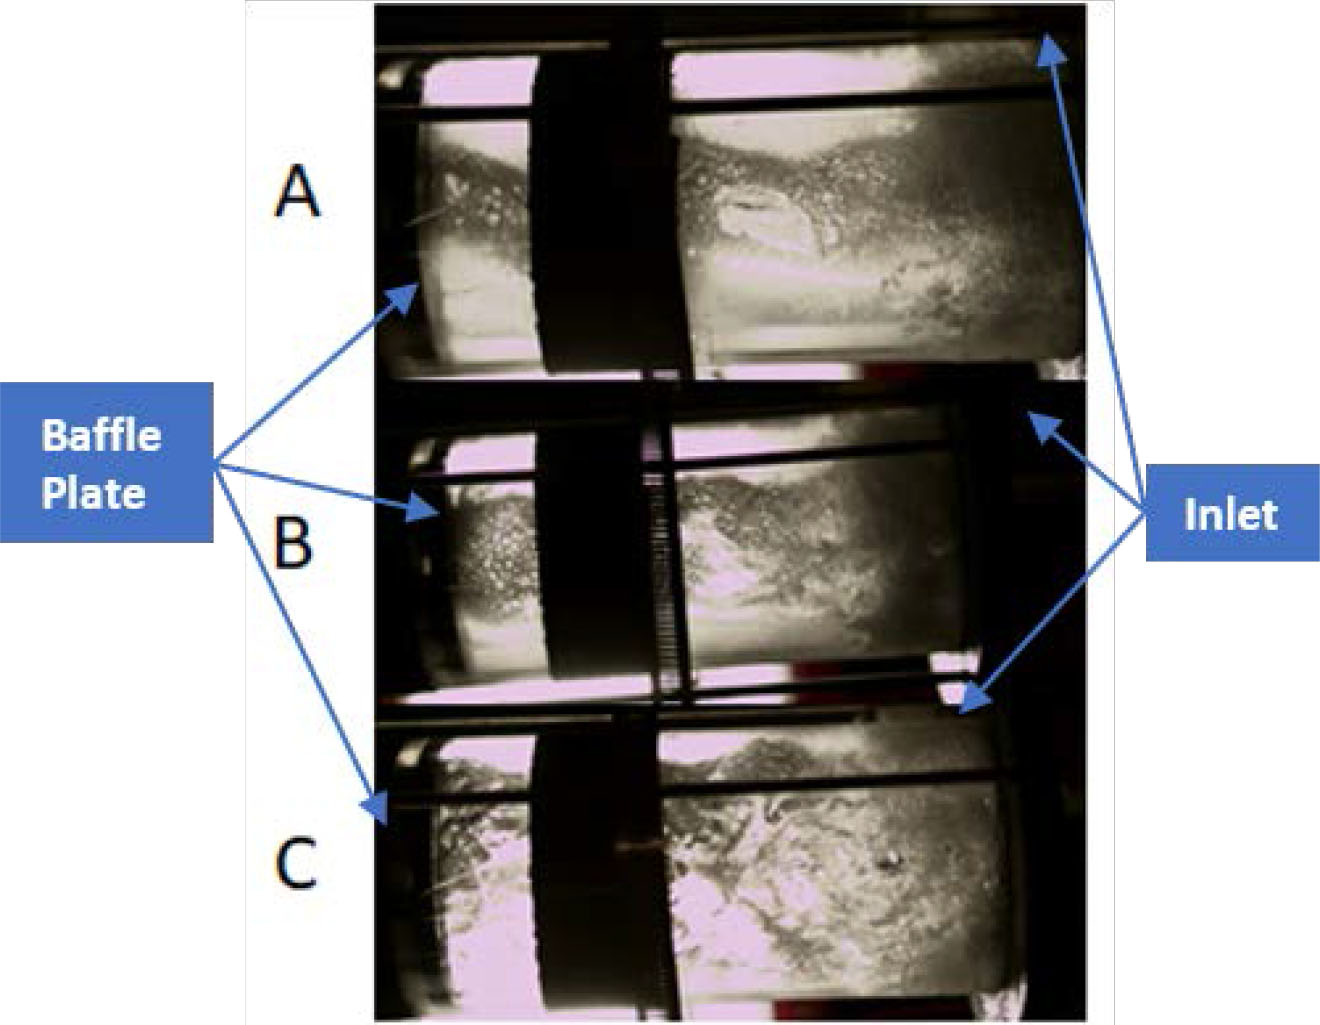
Figure 5
Photographs of three air cores corresponding to a water flow rate of 18.95 LPM and air flow rates of (A) 4.72 SLPM, (B) 9.44 SLPM, and (C) 14.15 SLPM.
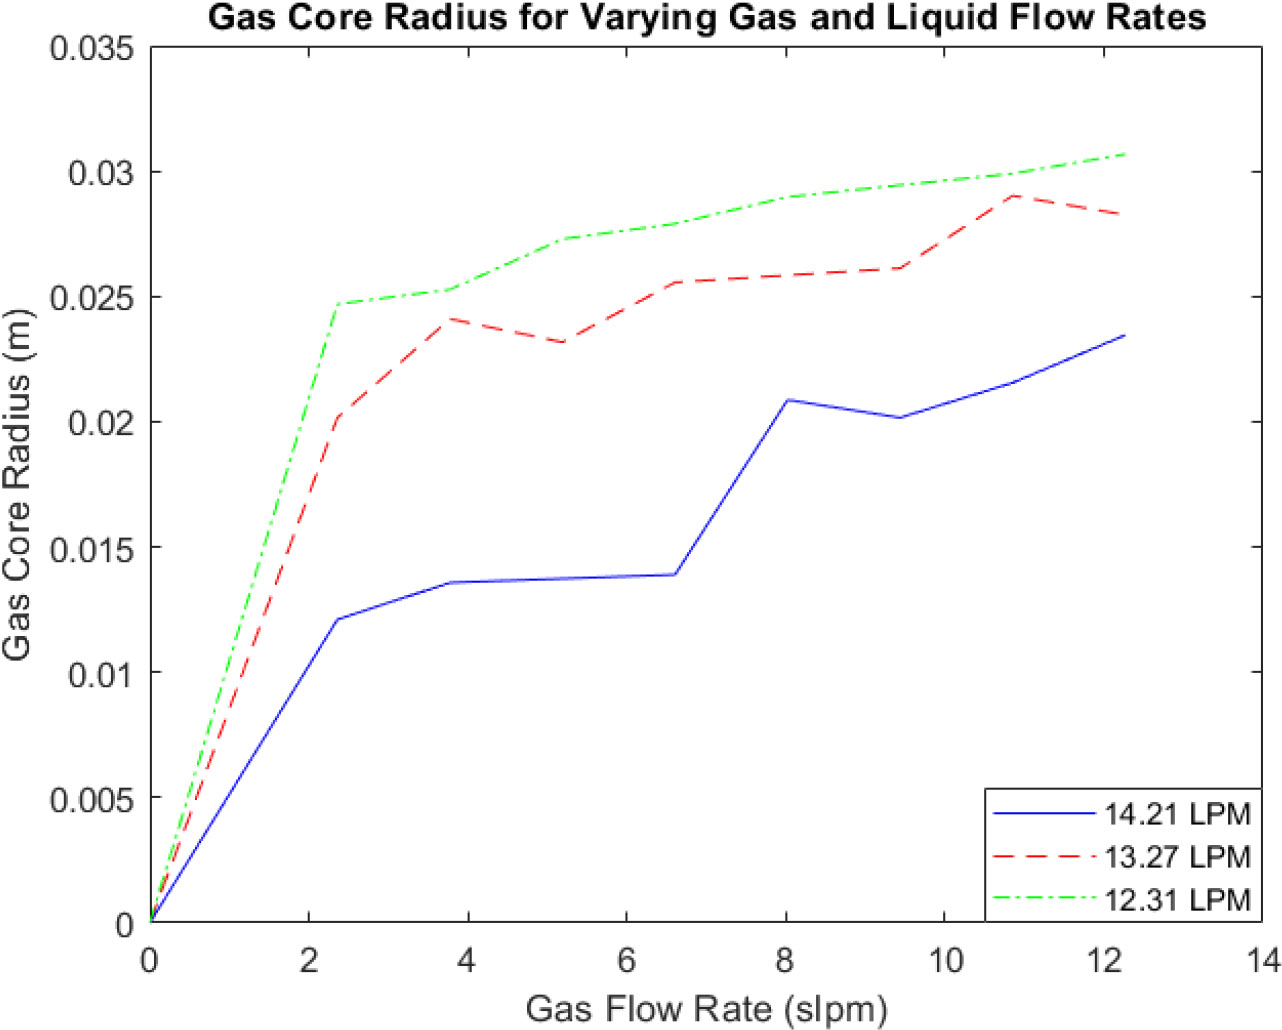
Figure 6
Gas core radius at increasing air flow rates and three constant water flow rates.
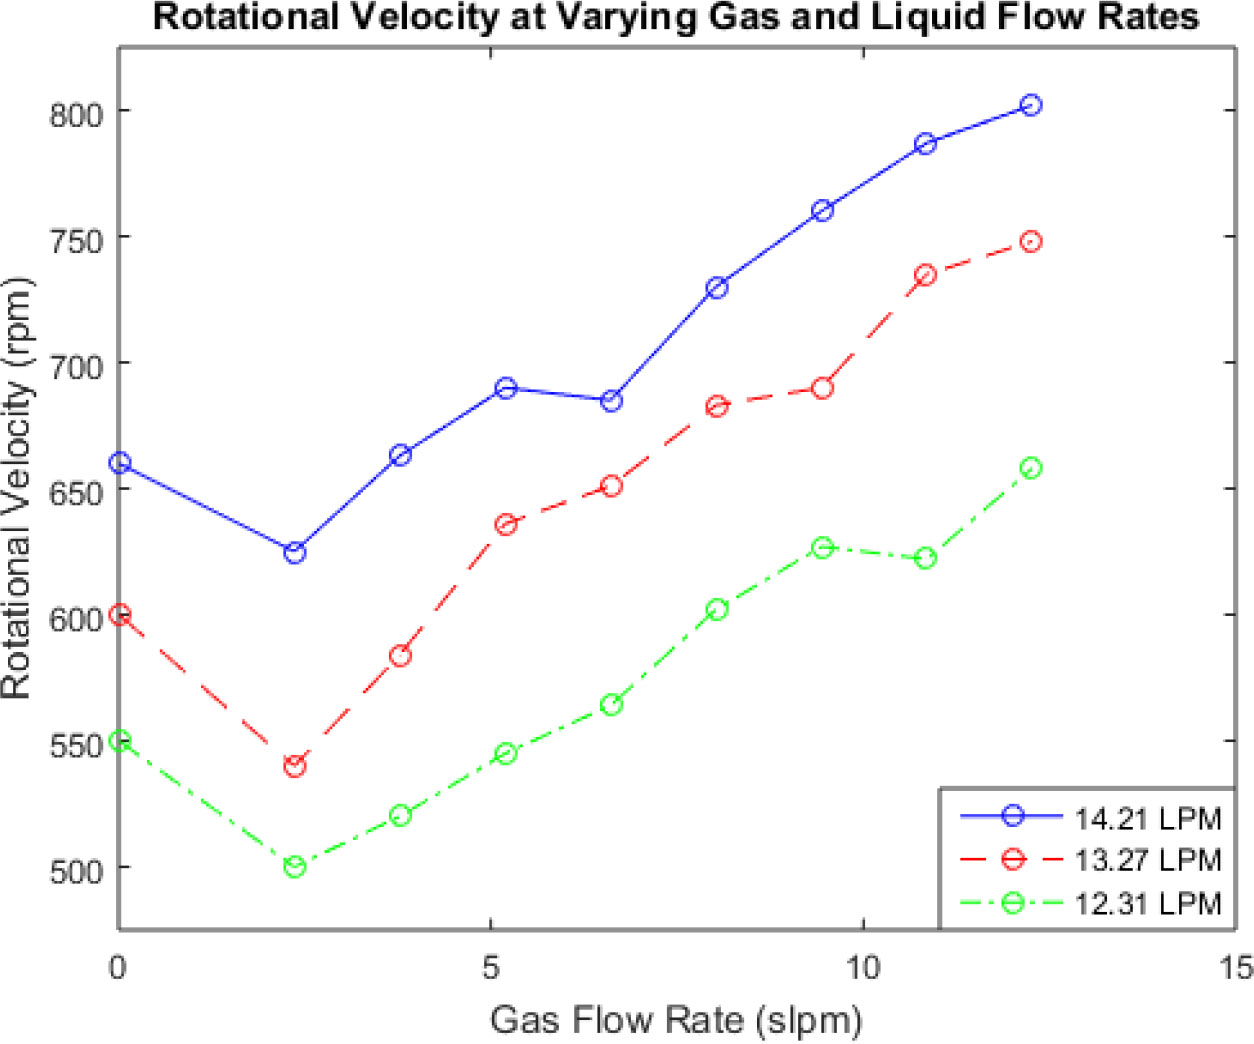
Figure 7
Rotational velocity at increasing air flow rates and three constant water flow rates.
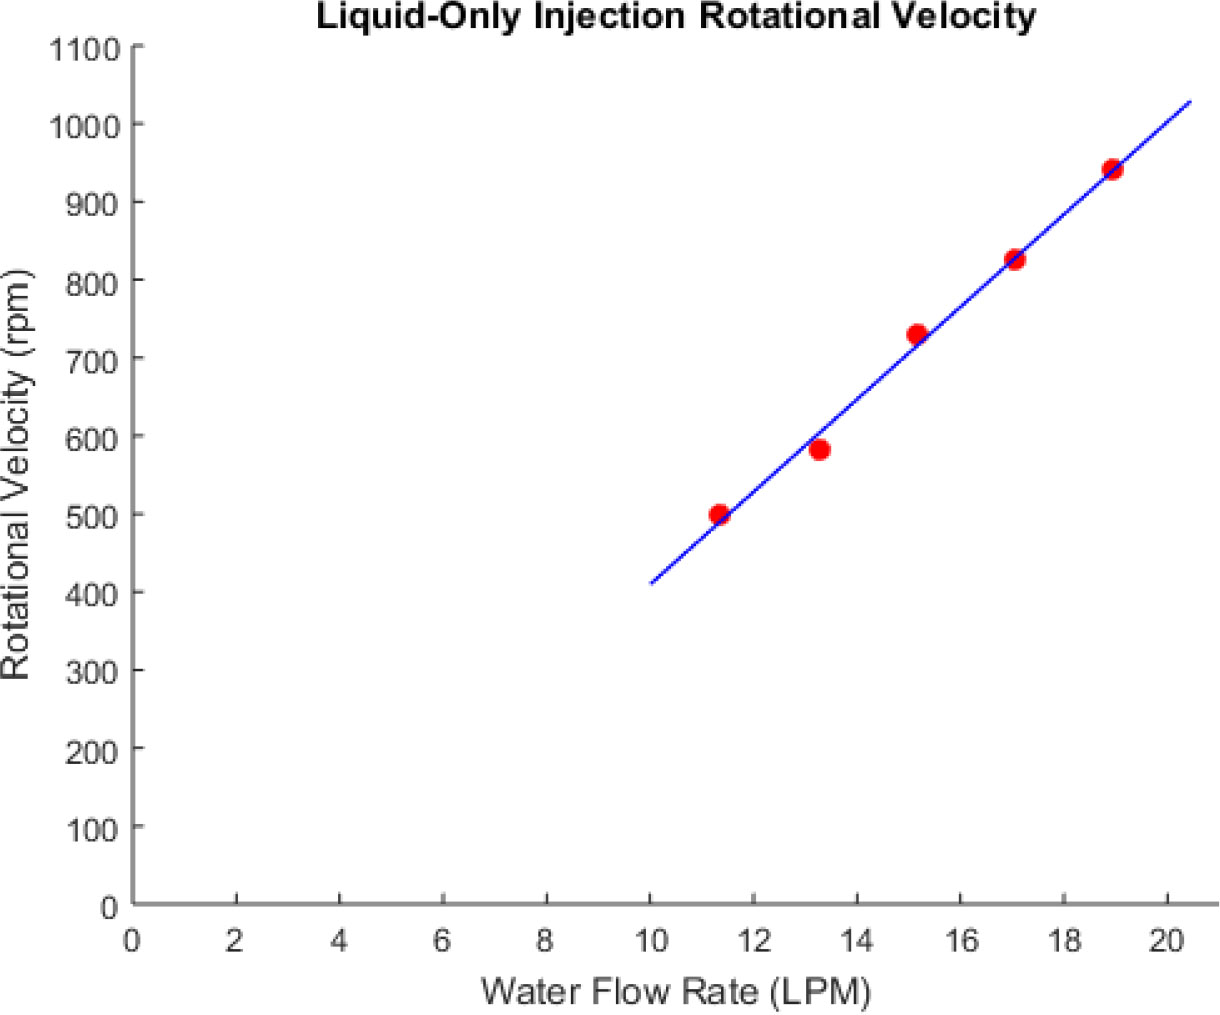
Figure 8
Rotational velocity of liquid-only injections at increasing water flow rates.
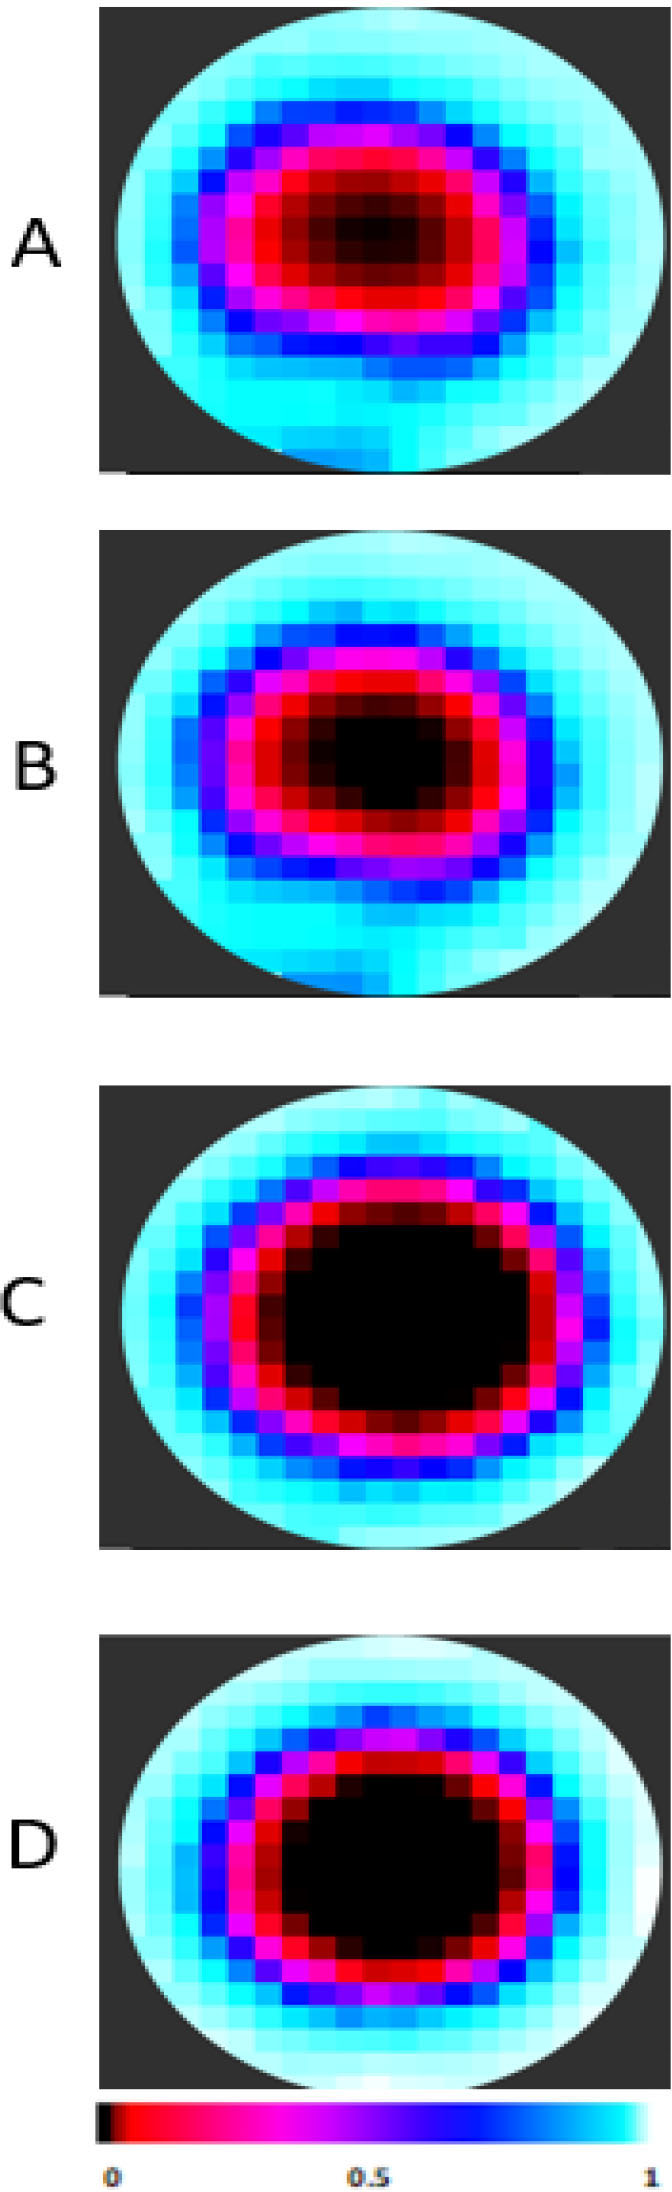
Figure 9
Typical displacement-current phase tomography cross section image reconstruction of liquid and gas distribution inside the passive cyclonic gas-liquid separators: (A) Top of Sensing Region, (B) 1/3 into Sensing Region, (C) 2/3 into Sensing Region, and (D) Bottom of Sensing Region. These images are from a 13.21 LPM, 12.27 SLPM test.
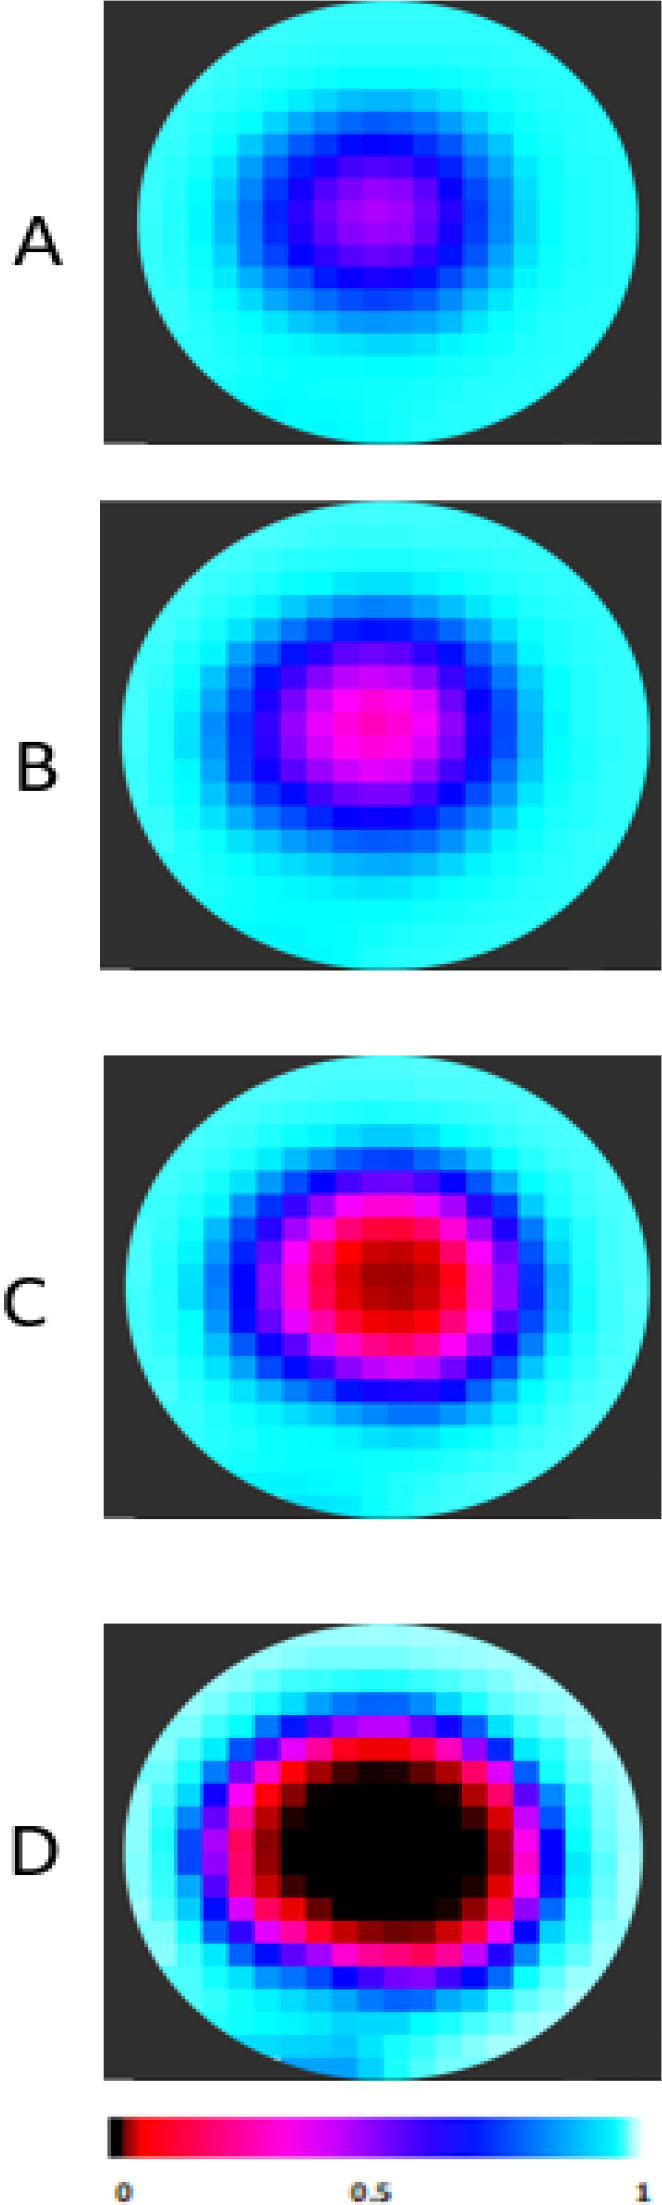
Figure 10
Displacement-current phase tomography reconstructed cross section images at a constant water injection rate (13.27 L/min) and varying air injection rates: (A) 2.36 SLPM, (B) 5.19 SLPM, (C) 8.02 SLPM, and (D) 12.27 SLPM.
Table 1
Expected (from Figure 6) and imaged gas core radii at varying air flow rates. Liquid flow is held constant at 13.21 LPM for these results.
| Image | Air Flow Rate (SLPM) | Expected Gas Core Radius (m) | Imaged Gas Core Radius (m) |
|---|---|---|---|
| A | 2.36 | 0.0202 | 0.0187 |
| B | 5.19 | 0.0232 | 0.0234 |
| C | 8.02 | 0.0258 | 0.0251 |
| D | 12.26 | 0.0283 | 0.0266 |
Table 2
Expected and imaged average liquid holdup at varying air flow rates. Liquid flow is held constant at 13.21 LPM for these results.
| Image | Air Flow Rate (SLPM) | Expected Liquid Holdup | Imaged Liquid Holdup |
|---|---|---|---|
| A | 2.36 | 0.72 | 0.75 |
| B | 5.19 | 0.63 | 0.62 |
| C | 8.02 | 0.54 | 0.56 |
| D | 12.26 | 0.45 | 0.51 |
Table 3
Visual and displacement-current phase tomography (DCPT) measured liquid holdup at varying air and water flow rates. Highlighted rows are the four cases imaged in Figure 10.
| Water Flow Rate (LPM) | Air Flow Rate (SLPM) | Average Liquid Holdup (Visual) | Average Liquid Holdup (DCPT) |
|---|---|---|---|
| 14.213 | 2.36 | 0.899 | 0.871 |
| 14.213 | 3.78 | 0.873 | 0.824 |
| 14.213 | 5.19 | 0.87 | 0.825 |
| 14.213 | 6.61 | 0.867 | 0.787 |
| 14.213 | 8.02 | 0.7 | 0.648 |
| 14.213 | 9.44 | 0.72 | 0.667 |
| 14.213 | 10.85 | 0.68 | 0.510 |
| 14.213 | 12.27 | 0.621 | 0.575 |
| 13.265 | 2.36 | 0.72 | 0.651 |
| 13.265 | 3.78 | 0.6 | 0.497 |
| 13.265 | 5.19 | 0.63 | 0.547 |
| 13.265 | 6.61 | 0.55 | 0.478 |
| 13.265 | 8.02 | 0.54 | 0.571 |
| 13.265 | 9.44 | 0.53 | 0.437 |
| 13.265 | 10.85 | 0.42 | 0.343 |
| 13.265 | 12.27 | 0.45 | 0.418 |
| 12.318 | 2.36 | 0.58 | 0.505 |
| 12.318 | 3.78 | 0.56 | 0.506 |
| 12.318 | 5.19 | 0.487 | 0.4855 |
| 12.318 | 6.61 | 0.464 | 0.473 |
| 12.318 | 8.02 | 0.422 | 0.484 |
| 12.318 | 9.44 | 0.403 | 0.500 |
| 12.318 | 10.85 | 0.384 | 0.464 |
| 12.318 | 12.27 | 0.352 | 0.461 |
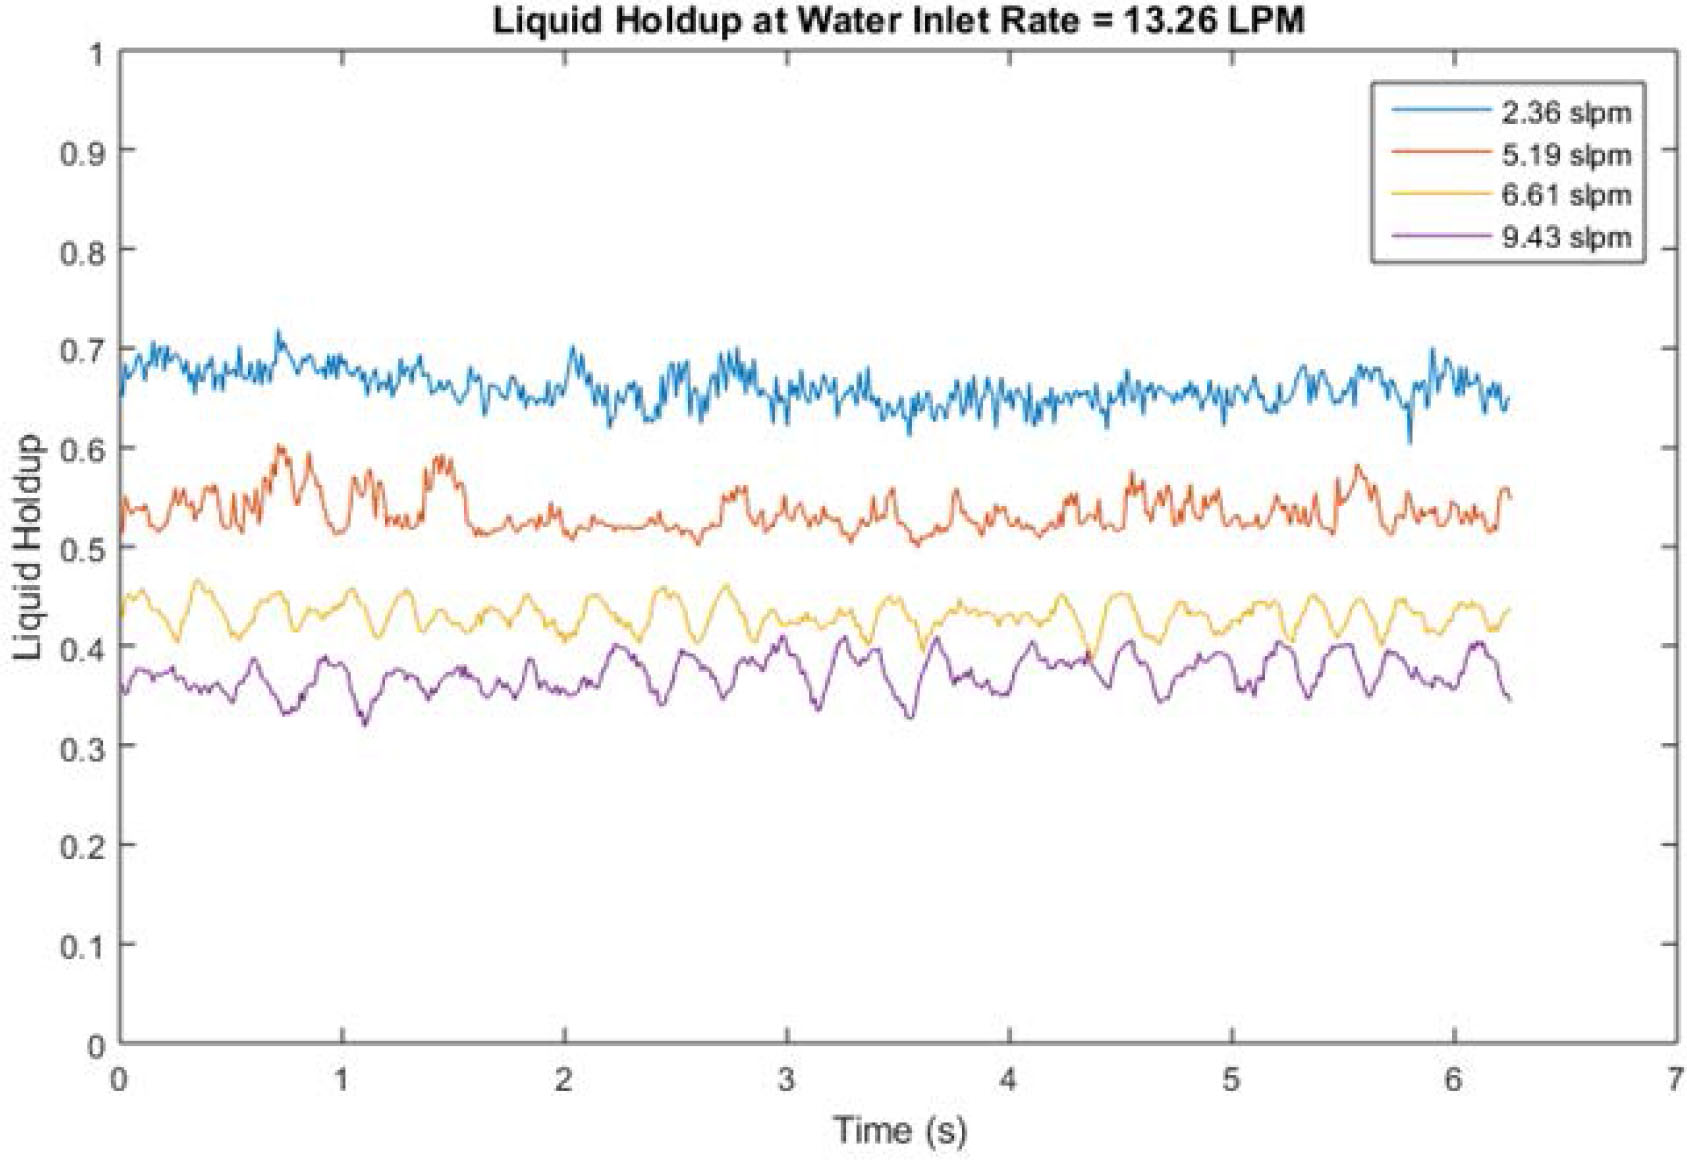
Figure 11
Liquid holdup over time for a water flow rate of 19 LPM and air flow rates varying from 4.75 SLPM to 9.4 SLPM. The signals from top to bottom correspond to air flow rates of: 4.75 SLPM, 5.6 SLPM, 6.6 SLPM, 7.5 SLPM, and 9.4 SLPM.
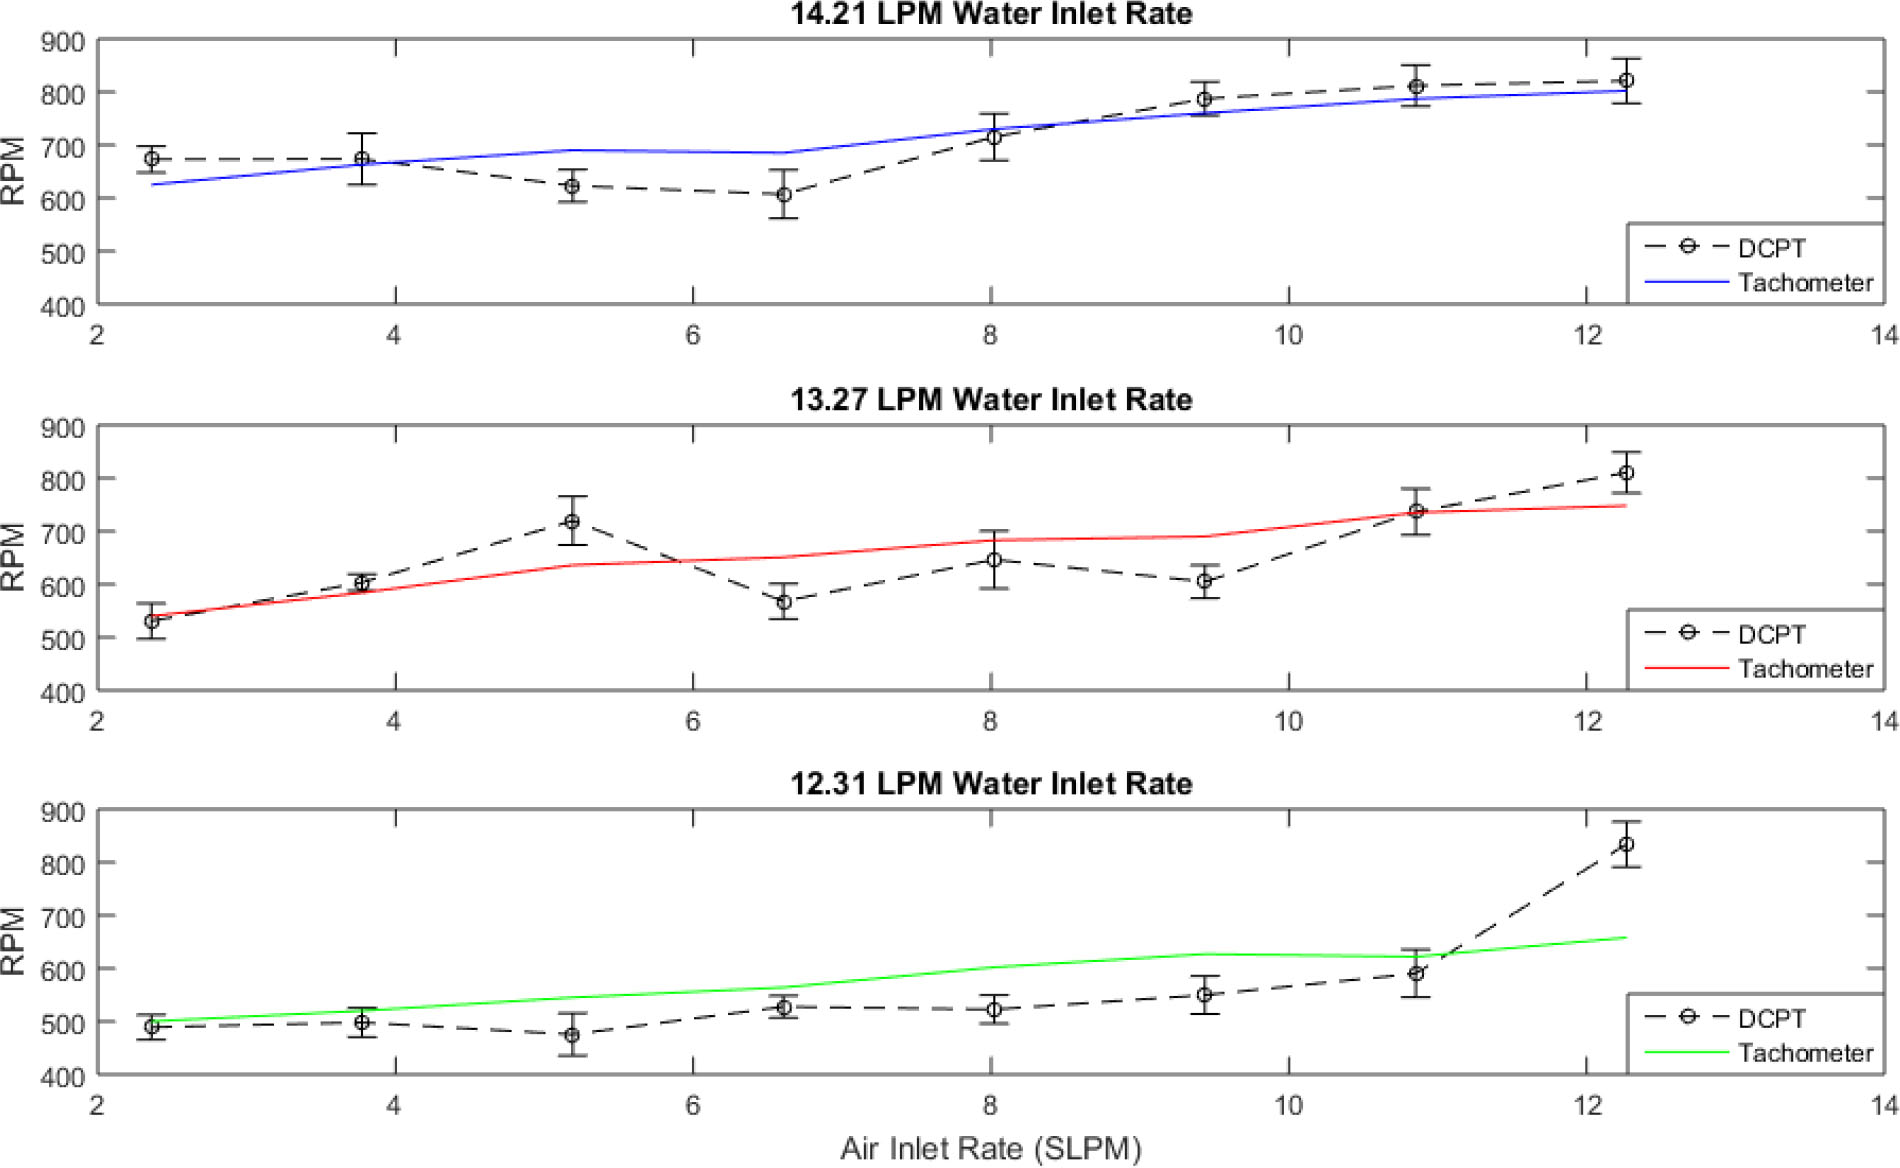
Figure 12
Displacement-current phase tomography determined angular velocities plotted against the tachometer determined angular velocity values. The vertical error bars represent the standard deviation in the DCPT angular velocity measurements.
Table 4
Visual and electrical capacitance phase tomography (ECVT) measurements of air-water vertical flow.
| Flow Direction | Water Flow Rate (LPM) | Air Flow Rate (SLPM) | Measured Liquid Holdup (Visual) | Measured Liquid Holdup (ECVT) |
|---|---|---|---|---|
| Up | 18.95 | 3 | 0.969 | 0.943 |
| Up | 18.95 | 5 | 0.930 | 0.923 |
| Up | 18.95 | 8 | 0.879 | 0.891 |
| Up | 18.95 | 12 | 0.827 | 0.855 |
| Up | 18.95 | 18 | 0.757 | 0.806 |
| Up | 18.95 | 24 | 0.717 | 0.758 |
| Up | 18.95 | 34 | 0.650 | 0.704 |
| Down | 18.95 | 3 | 0.943 | 0.911 |
| Down | 18.95 | 5 | 0.890 | 0.875 |
| Down | 18.95 | 8 | 0.822 | 0.827 |
| Down | 18.95 | 12 | 0.762 | 0.769 |
| Down | 18.95 | 18 | 0.675 | 0.696 |
| Down | 18.95 | 24 | 0.630 | 0.639 |
| Down | 18.95 | 34 | 0.555 | 0.575 |
| Down | 18.95 | 40 | 0.520 | 0.549 |
| Down | 18.95 | 50 | 0.485 | 0.497 |
| Down | 15.16 | 50 | 0.405 | 0.425 |
| Down | 13.25 | 50 | 0.380 | 0.367 |
| Down | 3.79 | 30 | 0.170 | 0.109 |
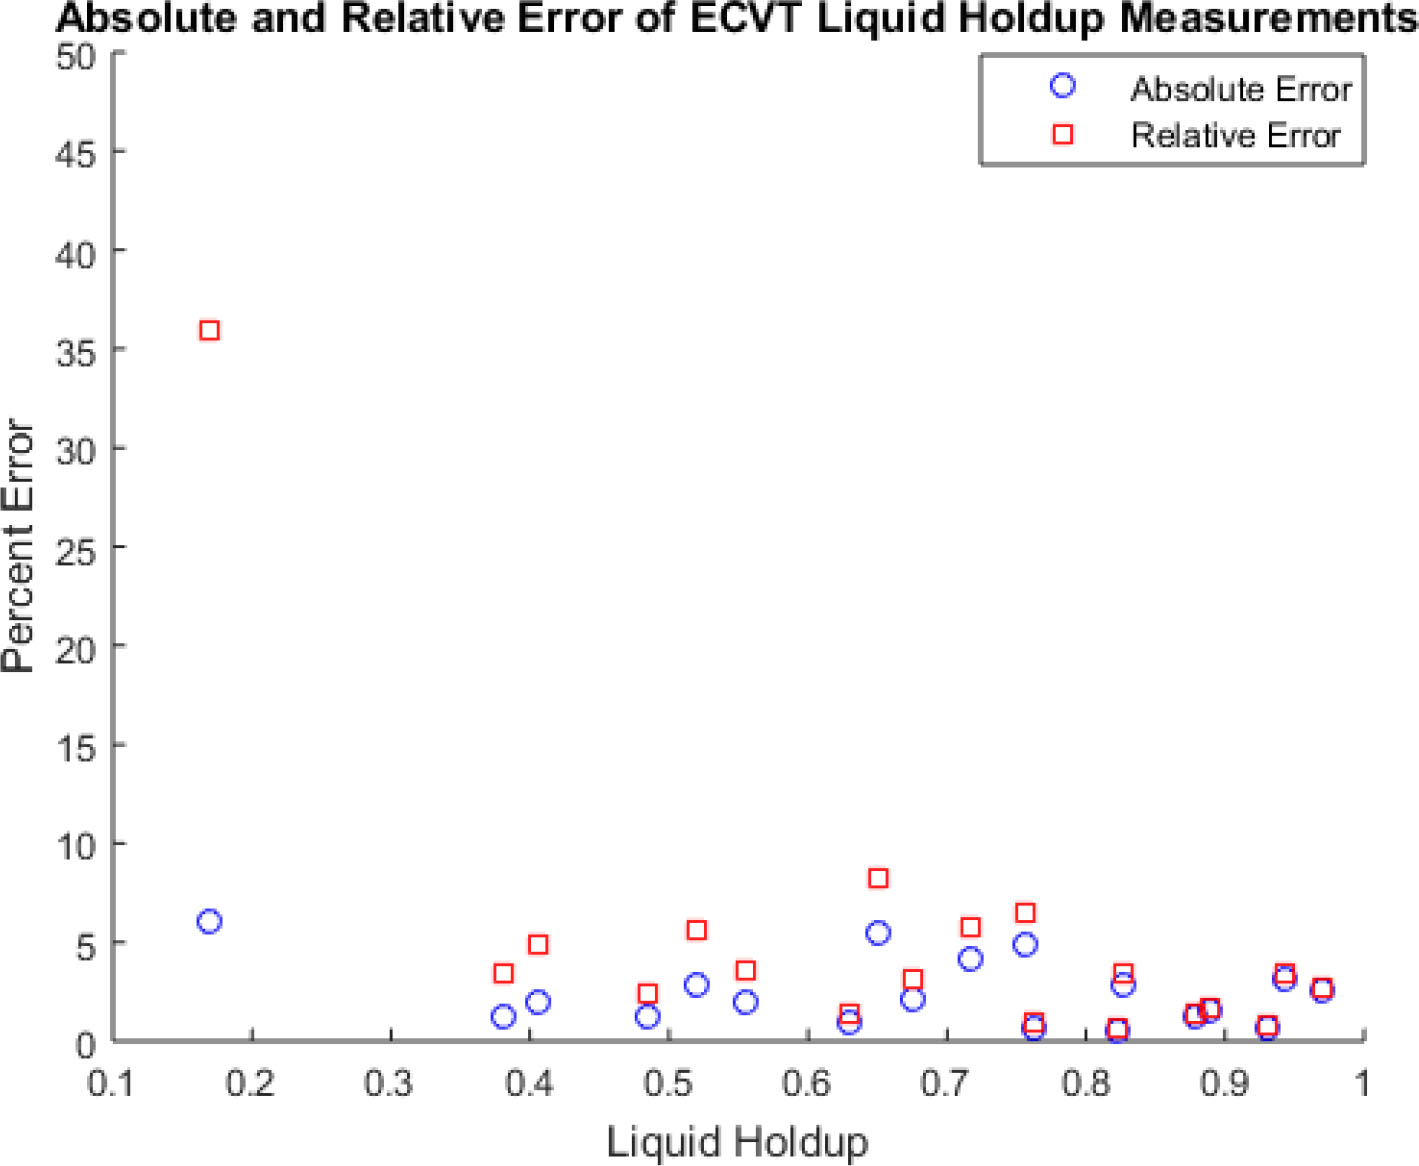
Figure 13
Absolute and relative error between the visual and electrical capacitance phase tomography liquid holdup measurements within the air-water inlet flow test.