
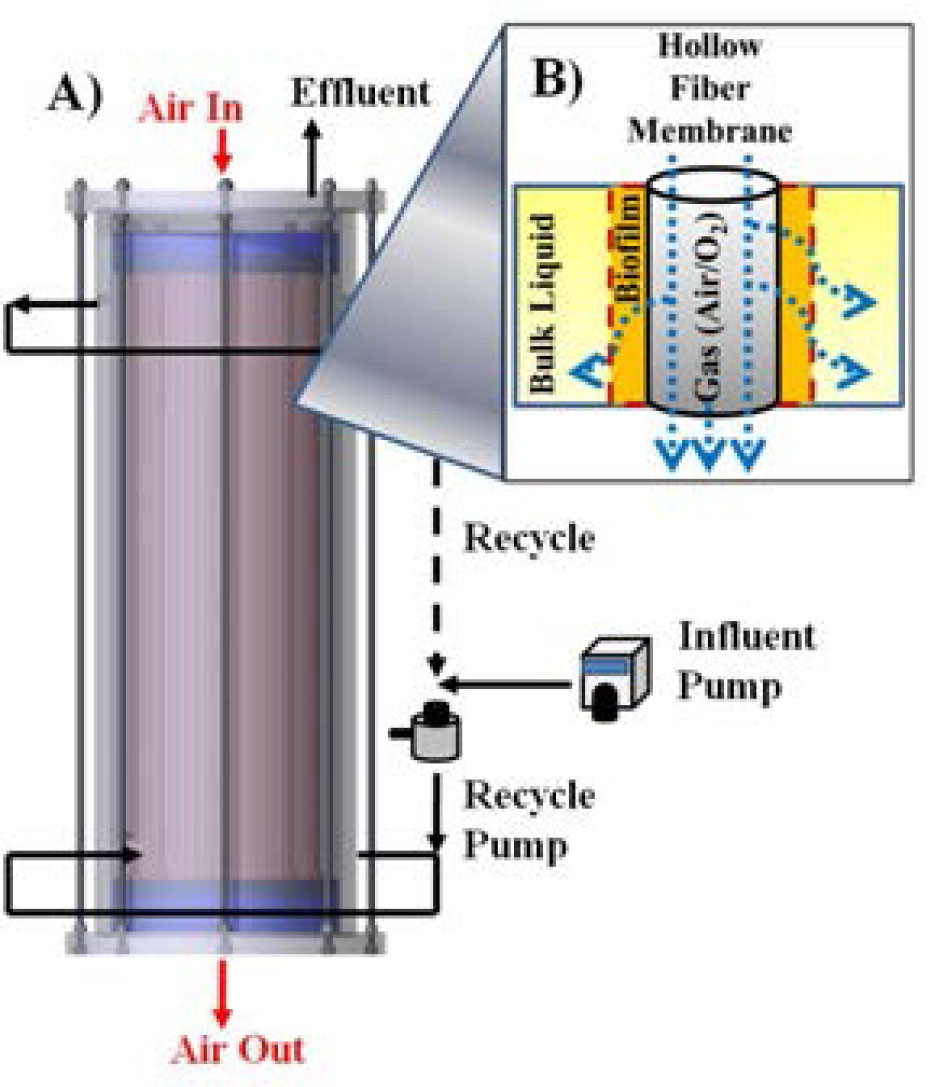
Figure 1
(A) CoMANDR schematic and liquid and gas flow path and (B) expansion of single membrane to illustrate counter-diffusion.
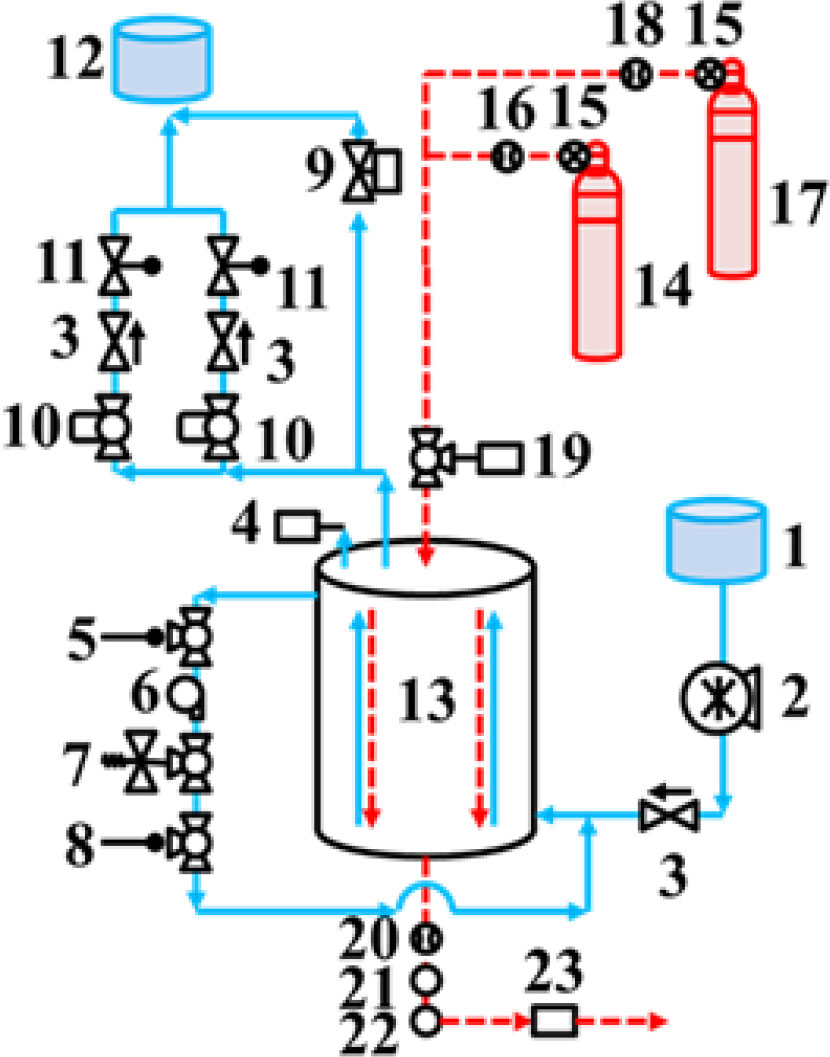
Figure 2
CoMANDR reactor and peripherals schematic (Christenson et al., 2013): (1) Influent Tank; (2) Influent Pump; (3) Check Valve; (4) Liquid Pressure Transducer; (5) pH probe; (6) Recycle Pump; (7) Liquid Pressure Relief Valve; (8) Sonde Multi-probe (pH, DO, TDS); (9) Pressure Dissipating Solenoid; (10) Screen; (11) Pressure Regulation Valve; (12) Effluent Tank; (13) Bioreactor; (14) O2 Cylinder; (15) Gas Cylinder Regulator; (16) Mass Flow Controller; (17) Air Cylinder; (18) Gas Mass Flowmeter; (19) Gas Relief Valve; (20) Gas Pressure Transducer; (21) Mass Flow Controller; (22) Desiccant Column; (23)% O2, %CO2 sensor.
Table 1
Wastewater Composition.
| Wastewater Component | Volume/Day-Crew Member (L) | Constituents |
|---|---|---|
| Urine* | 1.5 | N/A |
| Hygiene# | 7.2 | Organics: Neutrogena shaving cream, Oragel or Arm and Hammer toothpaste, No-Rinse body wash, 13 other compounds** Inorganics: Sodium Chloride, Ammonium Bicarbonate, Sodium Sulfate, Potassium Phosphate Monohydrate Tribasic, Potassium Fluoride |
| Humidity Condensate# | 1.95 | Organics: Ethanol, 1–2 Propanediol, Acetic Acid, 2-propanol, 22 other trace organics** Inorganics: Ammonium Bicarbonate, Potassium Fluoride, Potassium Chloride, Calcium Chloride Dihydride, Sodium Sulfate |
| Laundry# | 3.75 | Seventh Generation Free and Clear Detergent |
| Total | 14.4 |
Table 2
Test Point Parameters. Key Influent and Effluent Parameters Along with Test Point Objectives and Characteristics for the CoMANDR 265 and CoMANDR 200 Modules.
| Reactor Module | Test Point Objective | Days in Test | Hydraulic Retention Time (O) | Inf Organic Concentration (mg/L) | Eff Organic Concentration (mg/L) | Inf Nitrogen Concentration (mg/L) | Eff Nitrogen Concentration (mg/L) | Eff NO2-N (mg/L) | Eff NO3-N | Eff NOx-N (mg/L) | Eff NO2-N/Eff NOx-N | Eff pH | Dissolved Oxygen (mg/L) |
|---|---|---|---|---|---|---|---|---|---|---|---|---|---|
| CoMANDR 265 | Loading Rate | 32 | 2.6 | 529 | 47 | 710 | 642 | 231 | 25 | 256 | 0.90 | 6.73 | 40.48 |
| CoMANDR 265 | 13 | 6.9 | 604 | 43 | 850 | 592 | 398 | 11 | 410 | 0.97 | 6.00 | 3.09 | |
| CoMANDR 265 | 24 | 3.5 | 539 | 49 | 1008 | 729 | 363 | 22 | 385 | 0.94 | 6.50 | 1.91 | |
| CoMANDR 265 | Hibernation Study | 21 | 5.2 | 550 | 43 | 824 | 643 | 378 | 12 | 390 | 0.97 | 6.24 | 1.59 |
| CoMANDR 265 | 21 | Hibernation: recycle only | |||||||||||
| CoMANDR 265 | 25 | 5.2 | 489 | 57 | 858 | 643 | 368 | 37 | 405 | 0.91 | 6.44 | 2.55 | |
| CoMANDR 265 | Intermittent Operation | 16 | 5.2 | 635 | 42 | 935 | 722 | 359 | 17 | 376 | 0.95 | 6.57 | 2.37 |
| CoMANDR 200 | Gas Composition | 32 | 5.5 | 398 | 56 | 828 | 748 | 343 | 25 | 367 | 0.93 | 6.55 | 7.24 |
| CoMANDR 200 | 10 | 5.5 | 361 | 51 | 664 | 724 | 363 | 21 | 383 | 0.95 | 6.62 | 9.43 | |
| CoMANDR 200 | 7 | 5.5 | 314 | 48 | 763 | 694 | 344 | 20 | 364 | 0.95 | 6.73 | 10.28 | |
| CoMANDR 200 | 14 | 5.5 | 487 | 51 | 786 | 755 | 254 | 23 | 277 | 0.92 | 7.21 | 33.13 | |
| CoMANDR 200 | Hibernation Study | 9 | 5.5 | 361 | 130 | 906 | 819 | 279 | 79 | 358 | 0.78 | 6.68 | 5.87 |
| CoMANDR 200 | 27 | Hibernation: recycle only | |||||||||||
| CoMANDR 200 | 26 | 5.5 | 484 | 93 | 854 | 782 | 351 | 21 | 372 | 0.94 | 6.53 | 31.71 | |
| CoMANDR 200 | Loading Rate | 10 | 5.5 | 337 | 61 | 744 | 664 | 325 | 19 | 344 | 0.95 | 6.60 | 8.17 |
| CoMANDR 200 | 9 | 4.4 | 637 | 35 | 761 | 738 | 346 | 14 | 360 | 0.96 | 6.55 | 6.36 | |
| CoMANDR 200 | 13 | 3.6 | 732 | 44 | 884 | 844 | 164 | 9 | 173 | 0.95 | 7.27 | 2.39 | |
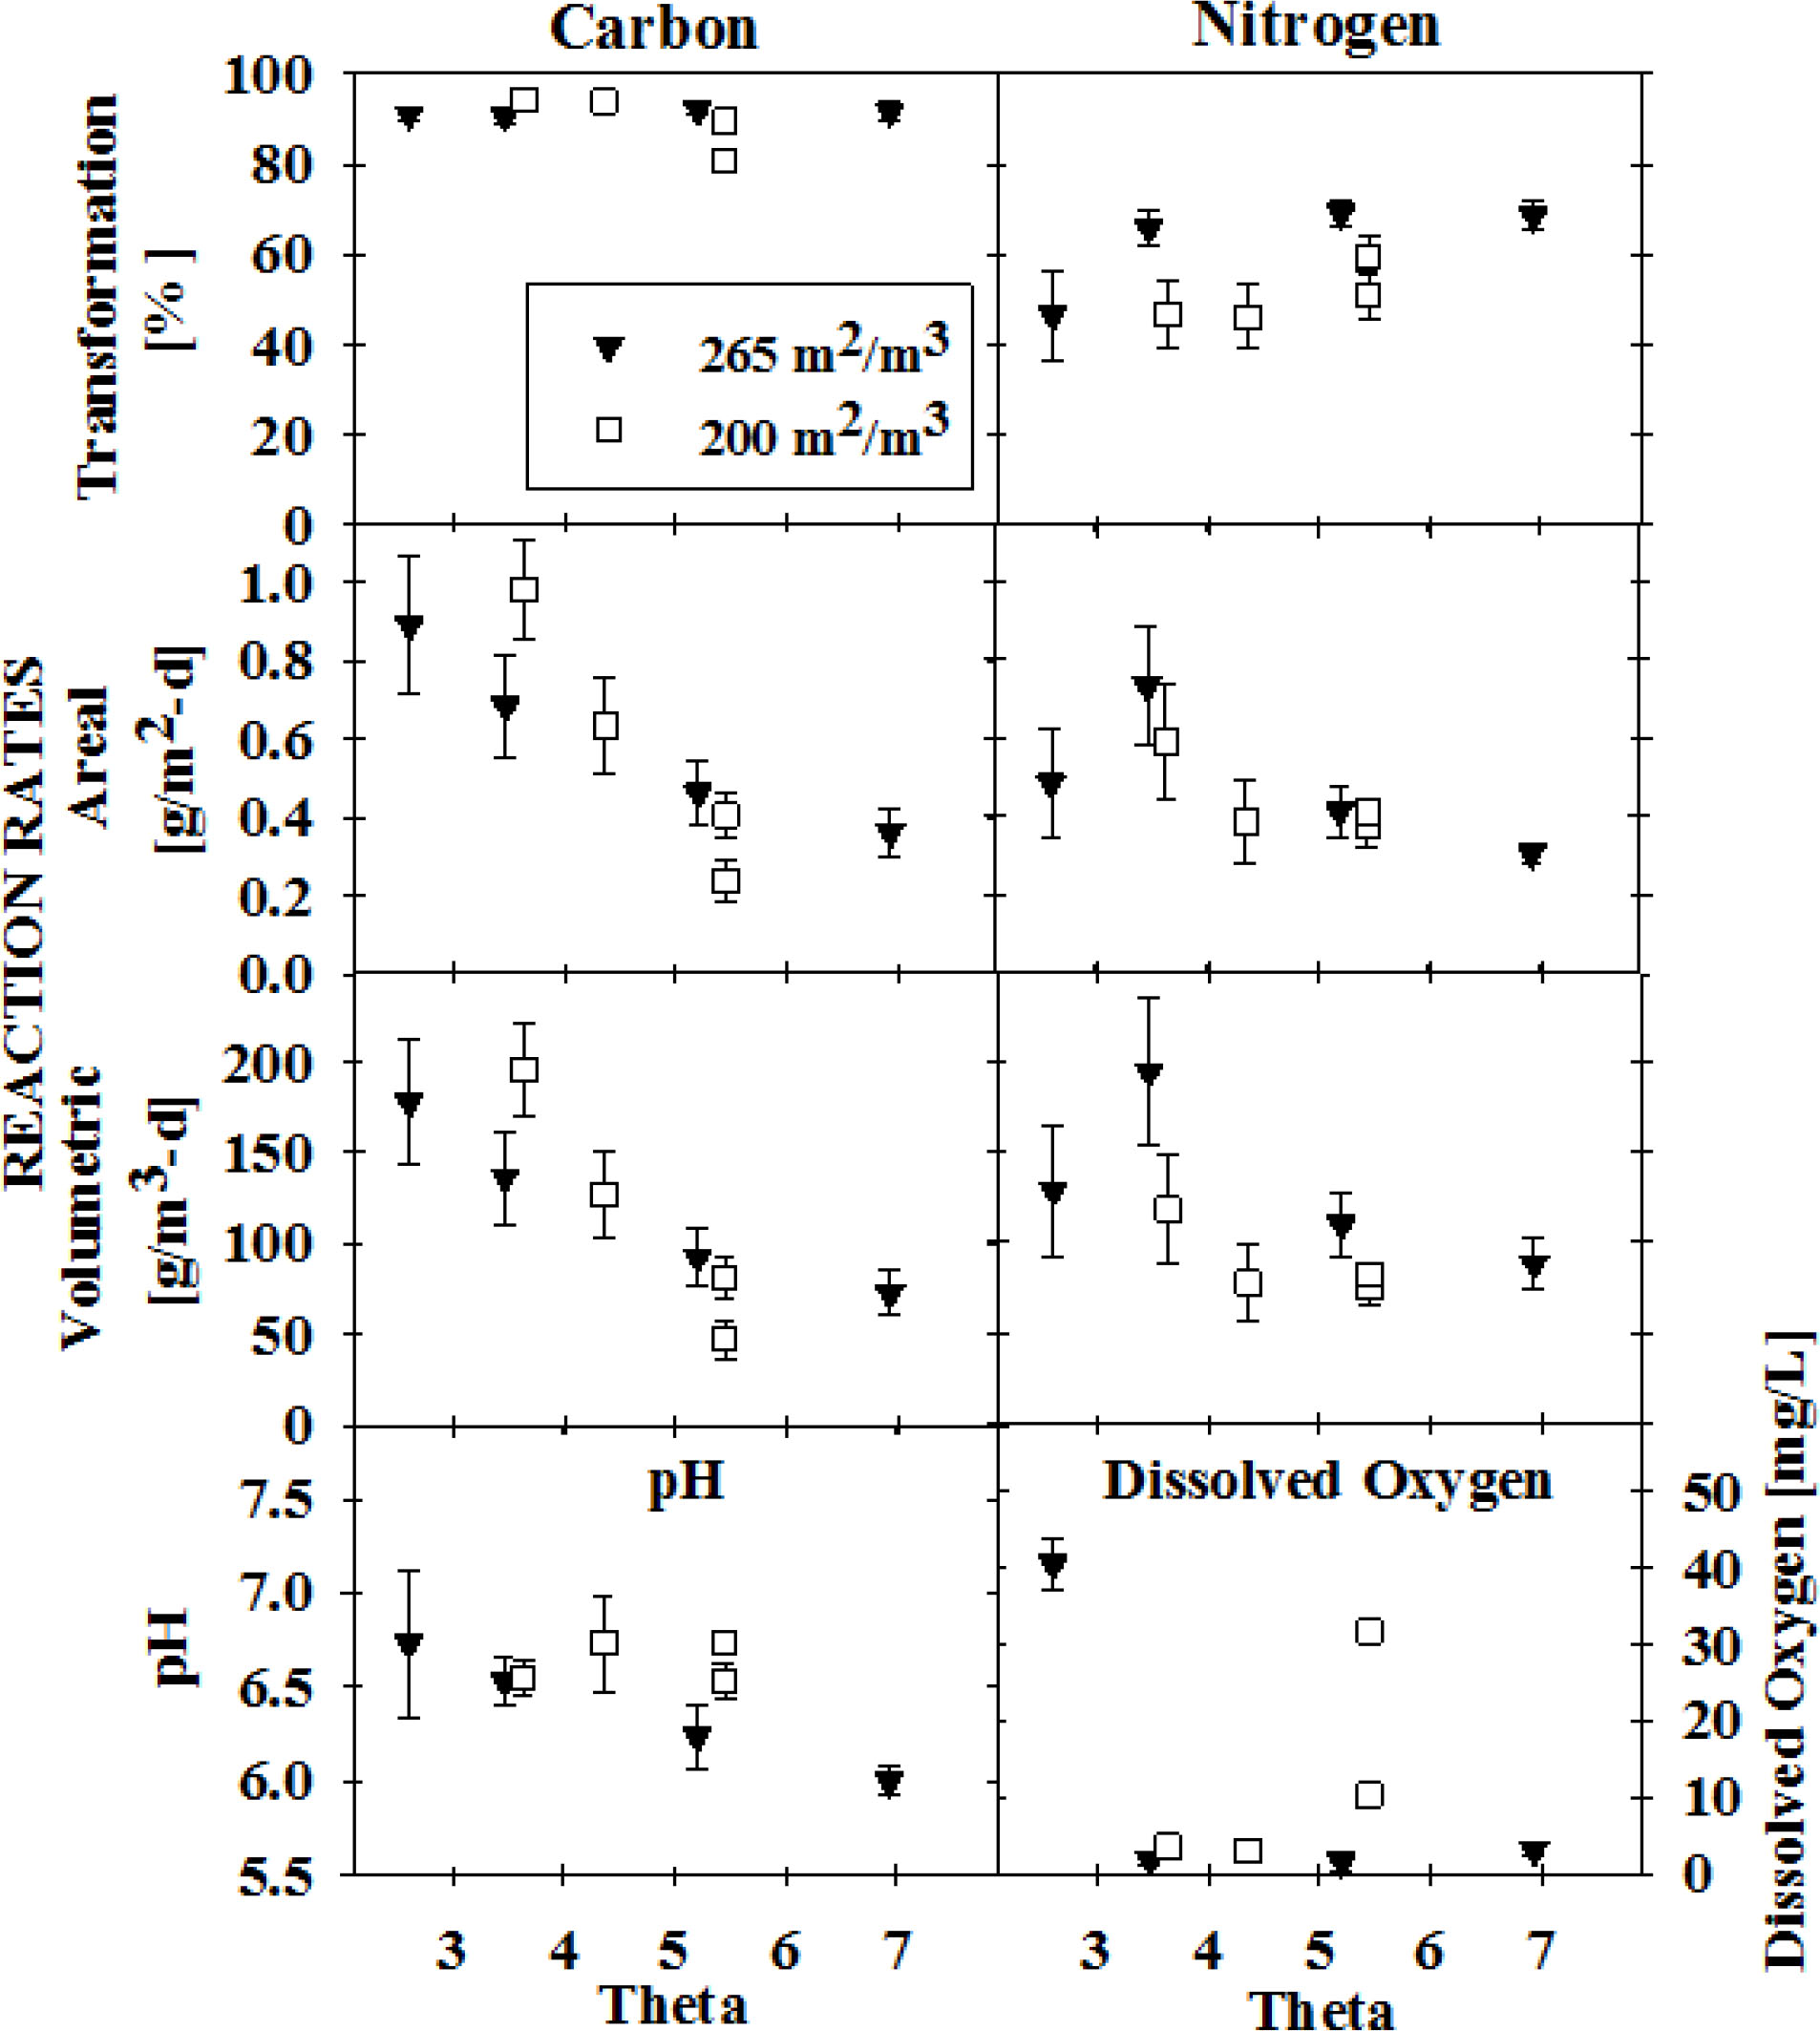
Figure 3
Overall carbon and nitrogen transformation efficiencies, reaction rates, pH, and dissolved oxygen vs. loading rate as indicated by hydraulic retention time (θ) for CoMANDR 265 and 200 treating an early planetary base wastewater.
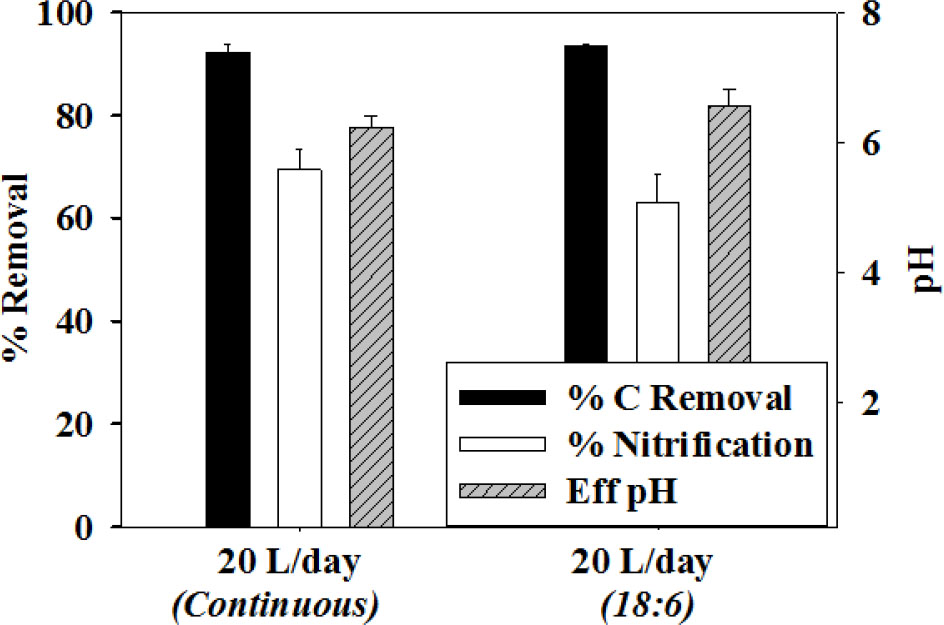
Figure 4
Continuous vs. intermittent operation results on efficiency and effluent pH of CoMANDR 200 at uniform loading rate of 20 liters/day. Overall performance efficiencies were maintained during intermittent operation.
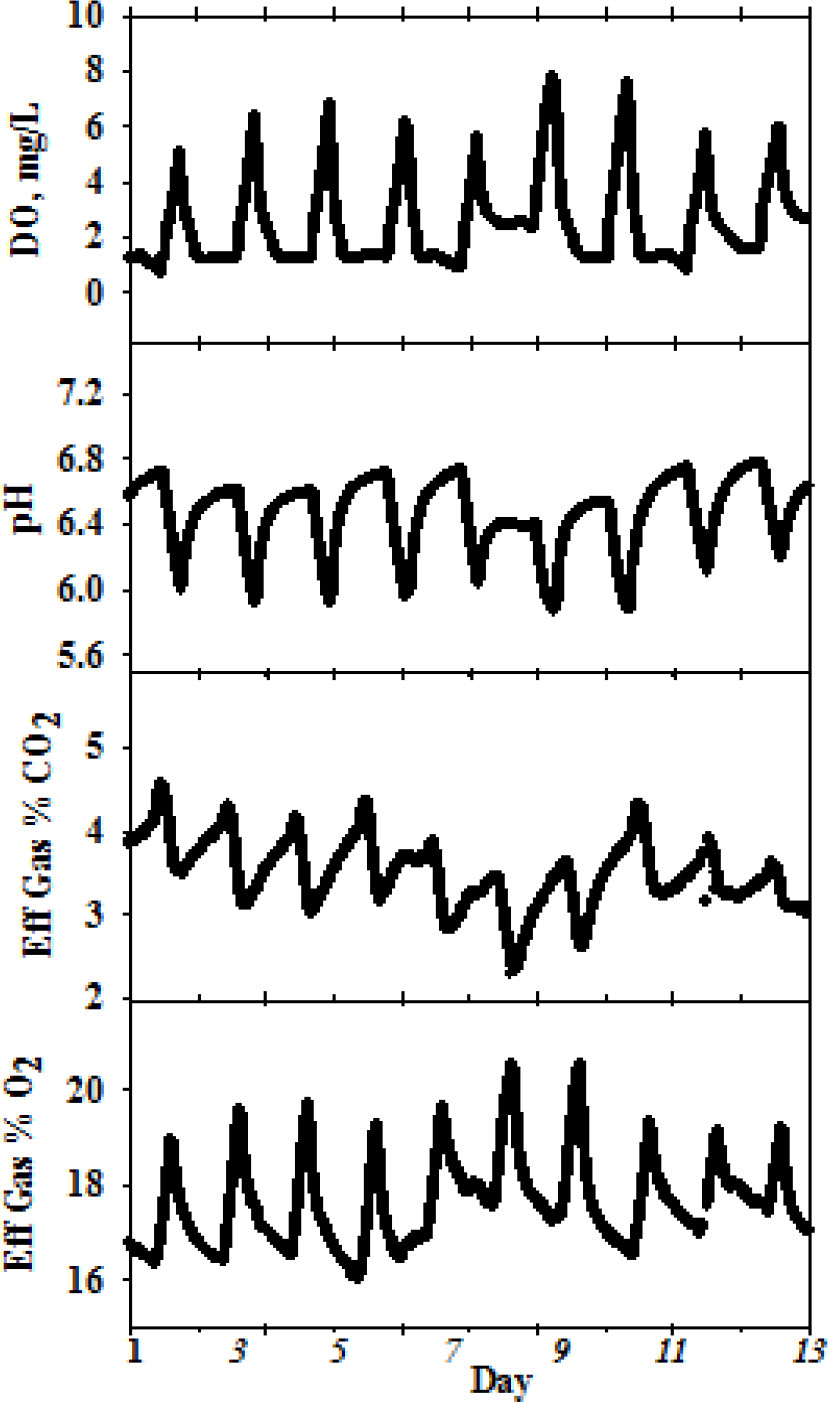
Figure 5
CoMANDR 200 effluent DO, pH, and gas O2 and CO2 % fluctuations in response to intermittent loading.
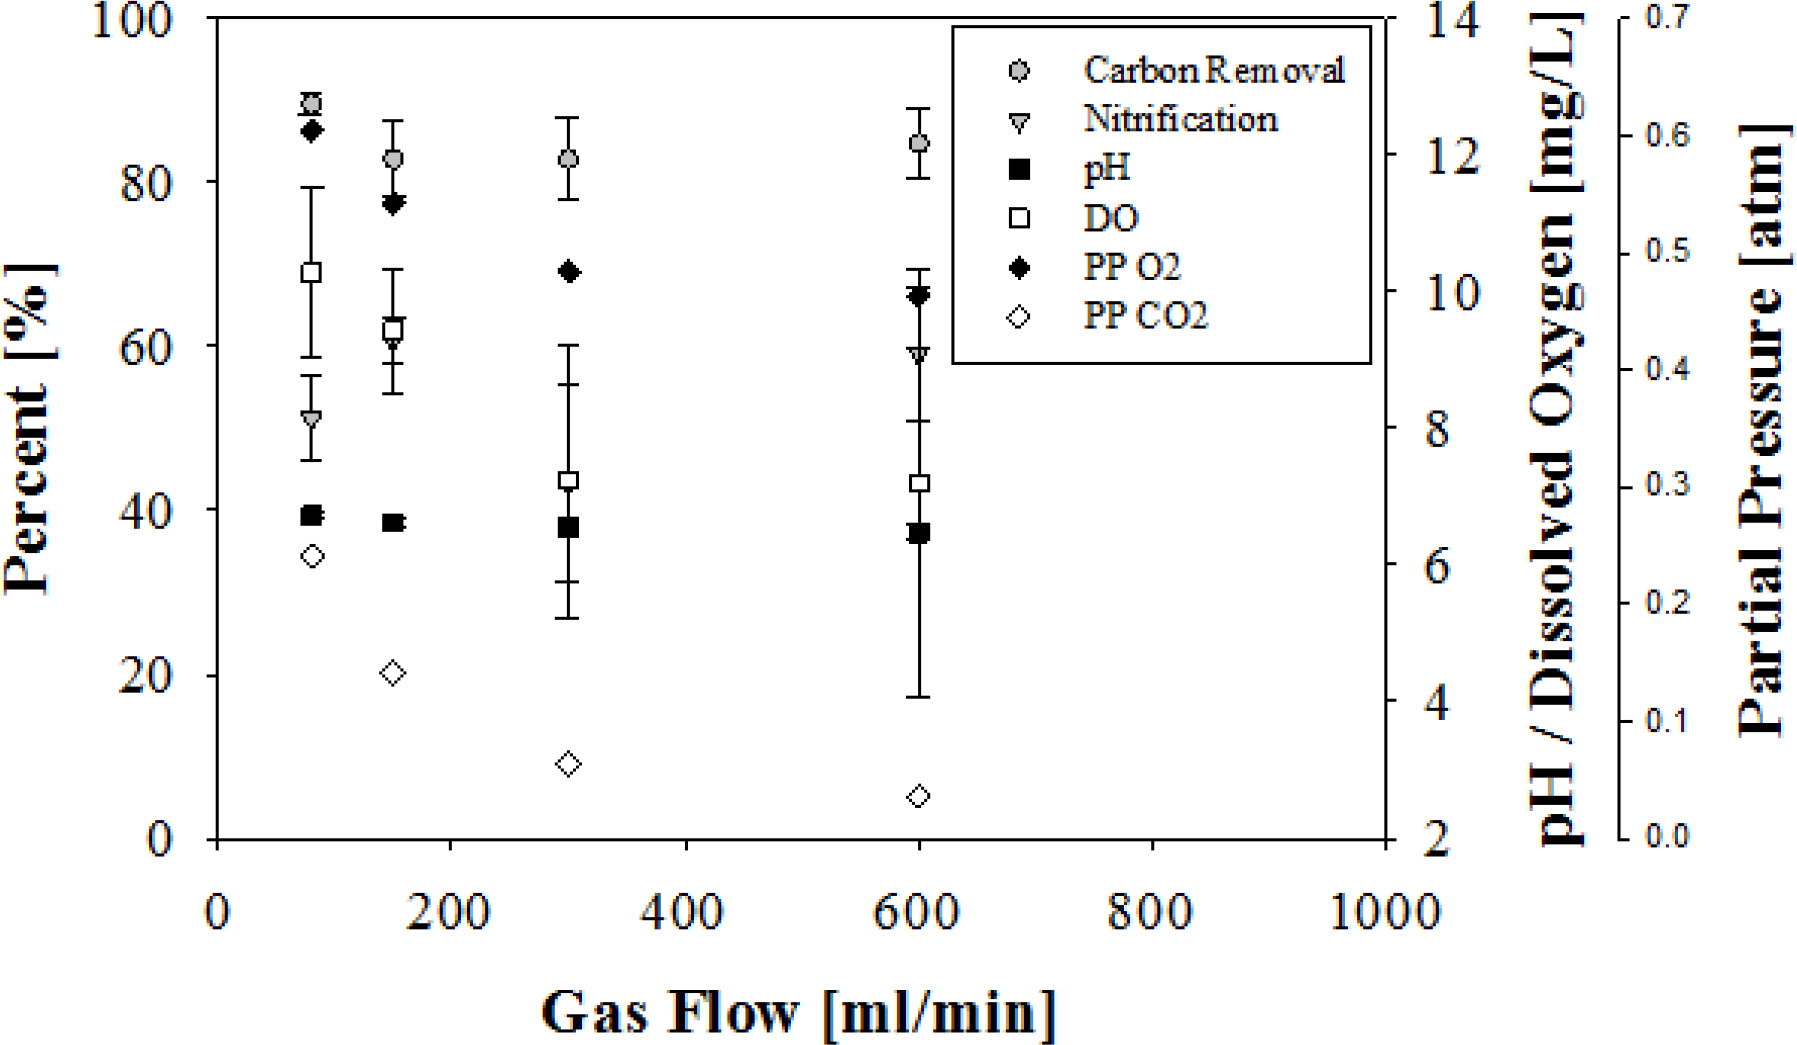
Figure 6
Total effluent gas flow vs. carbon and nitrogen efficiency and effluent liquid and gas composition.
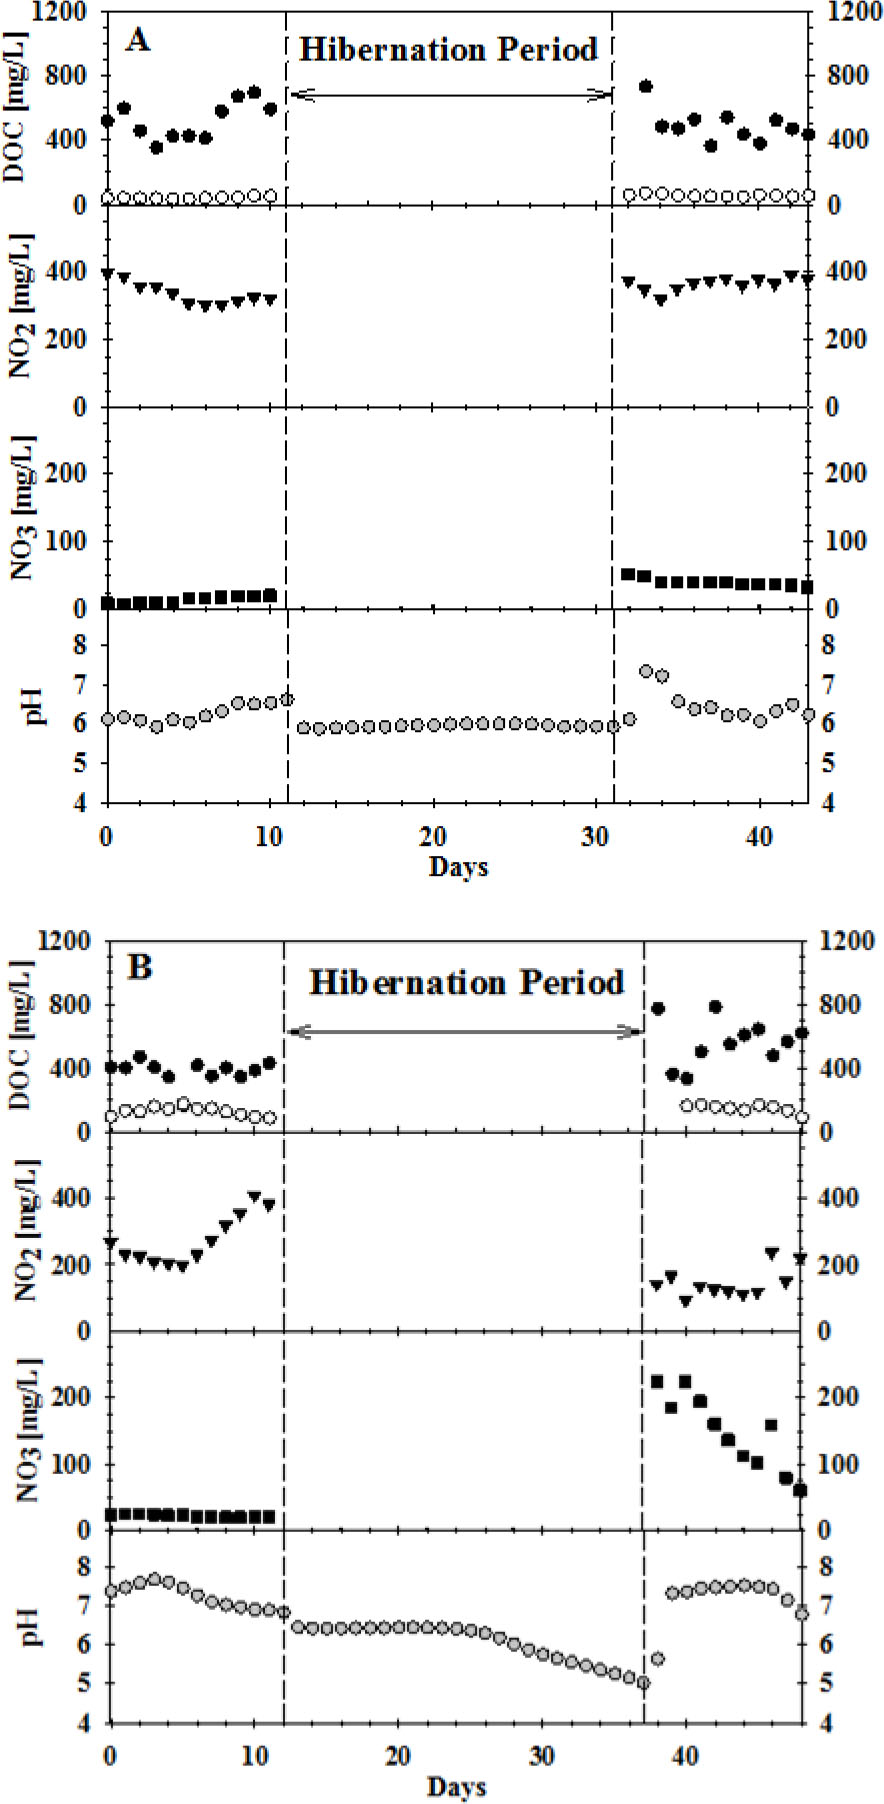
Figure 7
Hibernation performance: daily values of DOC, NO2−, NO3−, and pH for reactor systems (A) CoMANDR 265; (B) CoMANDR 200. Carbon oxidation and nitrification efficiencies are recovered within 1 week after resumption of operation.