
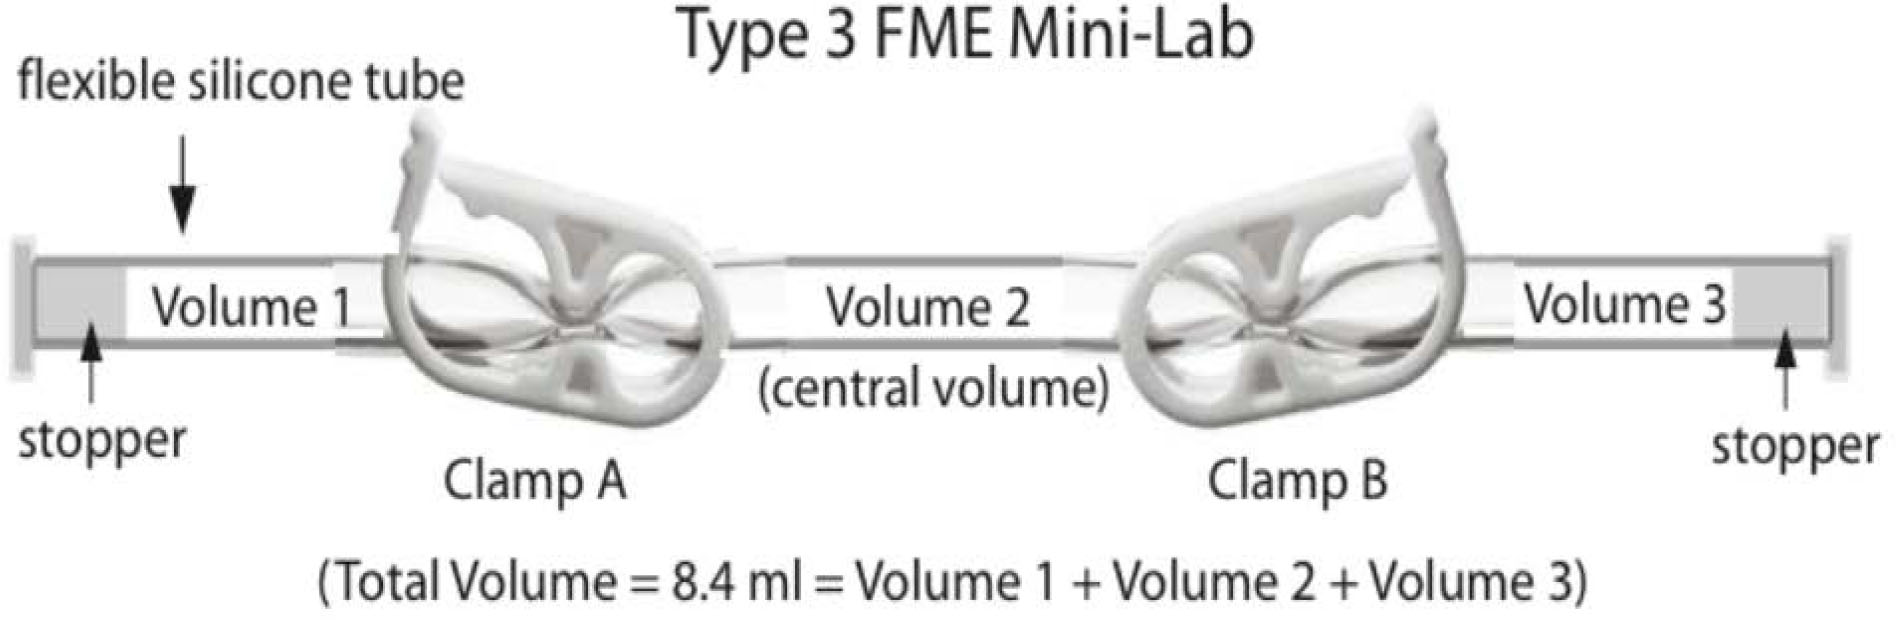
Figure 1
Type 3 Fluids Mixing Enclosure (FME) Mini-Lab. The FME is 17 cm in length with a total volume of 8.4 mL divided into three 2.8 mL compartments. Volume 1 and 3 contained 2.4 mL of CeMM and Volume 2 contained 2.4 mL of CeMM housing 5,000 C. elegans.
Table 1
Timeline of the experiment. The letter A stands for arrival (at the ISS) and the letter U stands for undock from the ISS.
| Location | Time Start | Time Duration | Temperature (°C) | Changes made to the FME |
|---|---|---|---|---|
| Travel from Toronto to Houston (FedEx) | A-25 days | 2 days | 2–4 | None |
| NanoRacks (Houston) | A-23 days | 12 days | 2–4 | None |
| Travel from Ferry to Launch | A-11 days | 11 days | 2–4 | None |
| Rocket travel to ISS | A-6 hours | 6 hours | 2–4 | None |
| ISS | A | 6 weeks | 21–24 | A+0 days: Unclamp Clamp A, shake gently for 3 seconds U-14 days: Unclamp Clamp B, shake gently for 3 seconds |
| Travel from Landing to Houston | U | 4 days | 0–10 | None |
| Travel from Houston to Toronto (FedEx) | U+4 days | 24 hours | 2–4 | None |
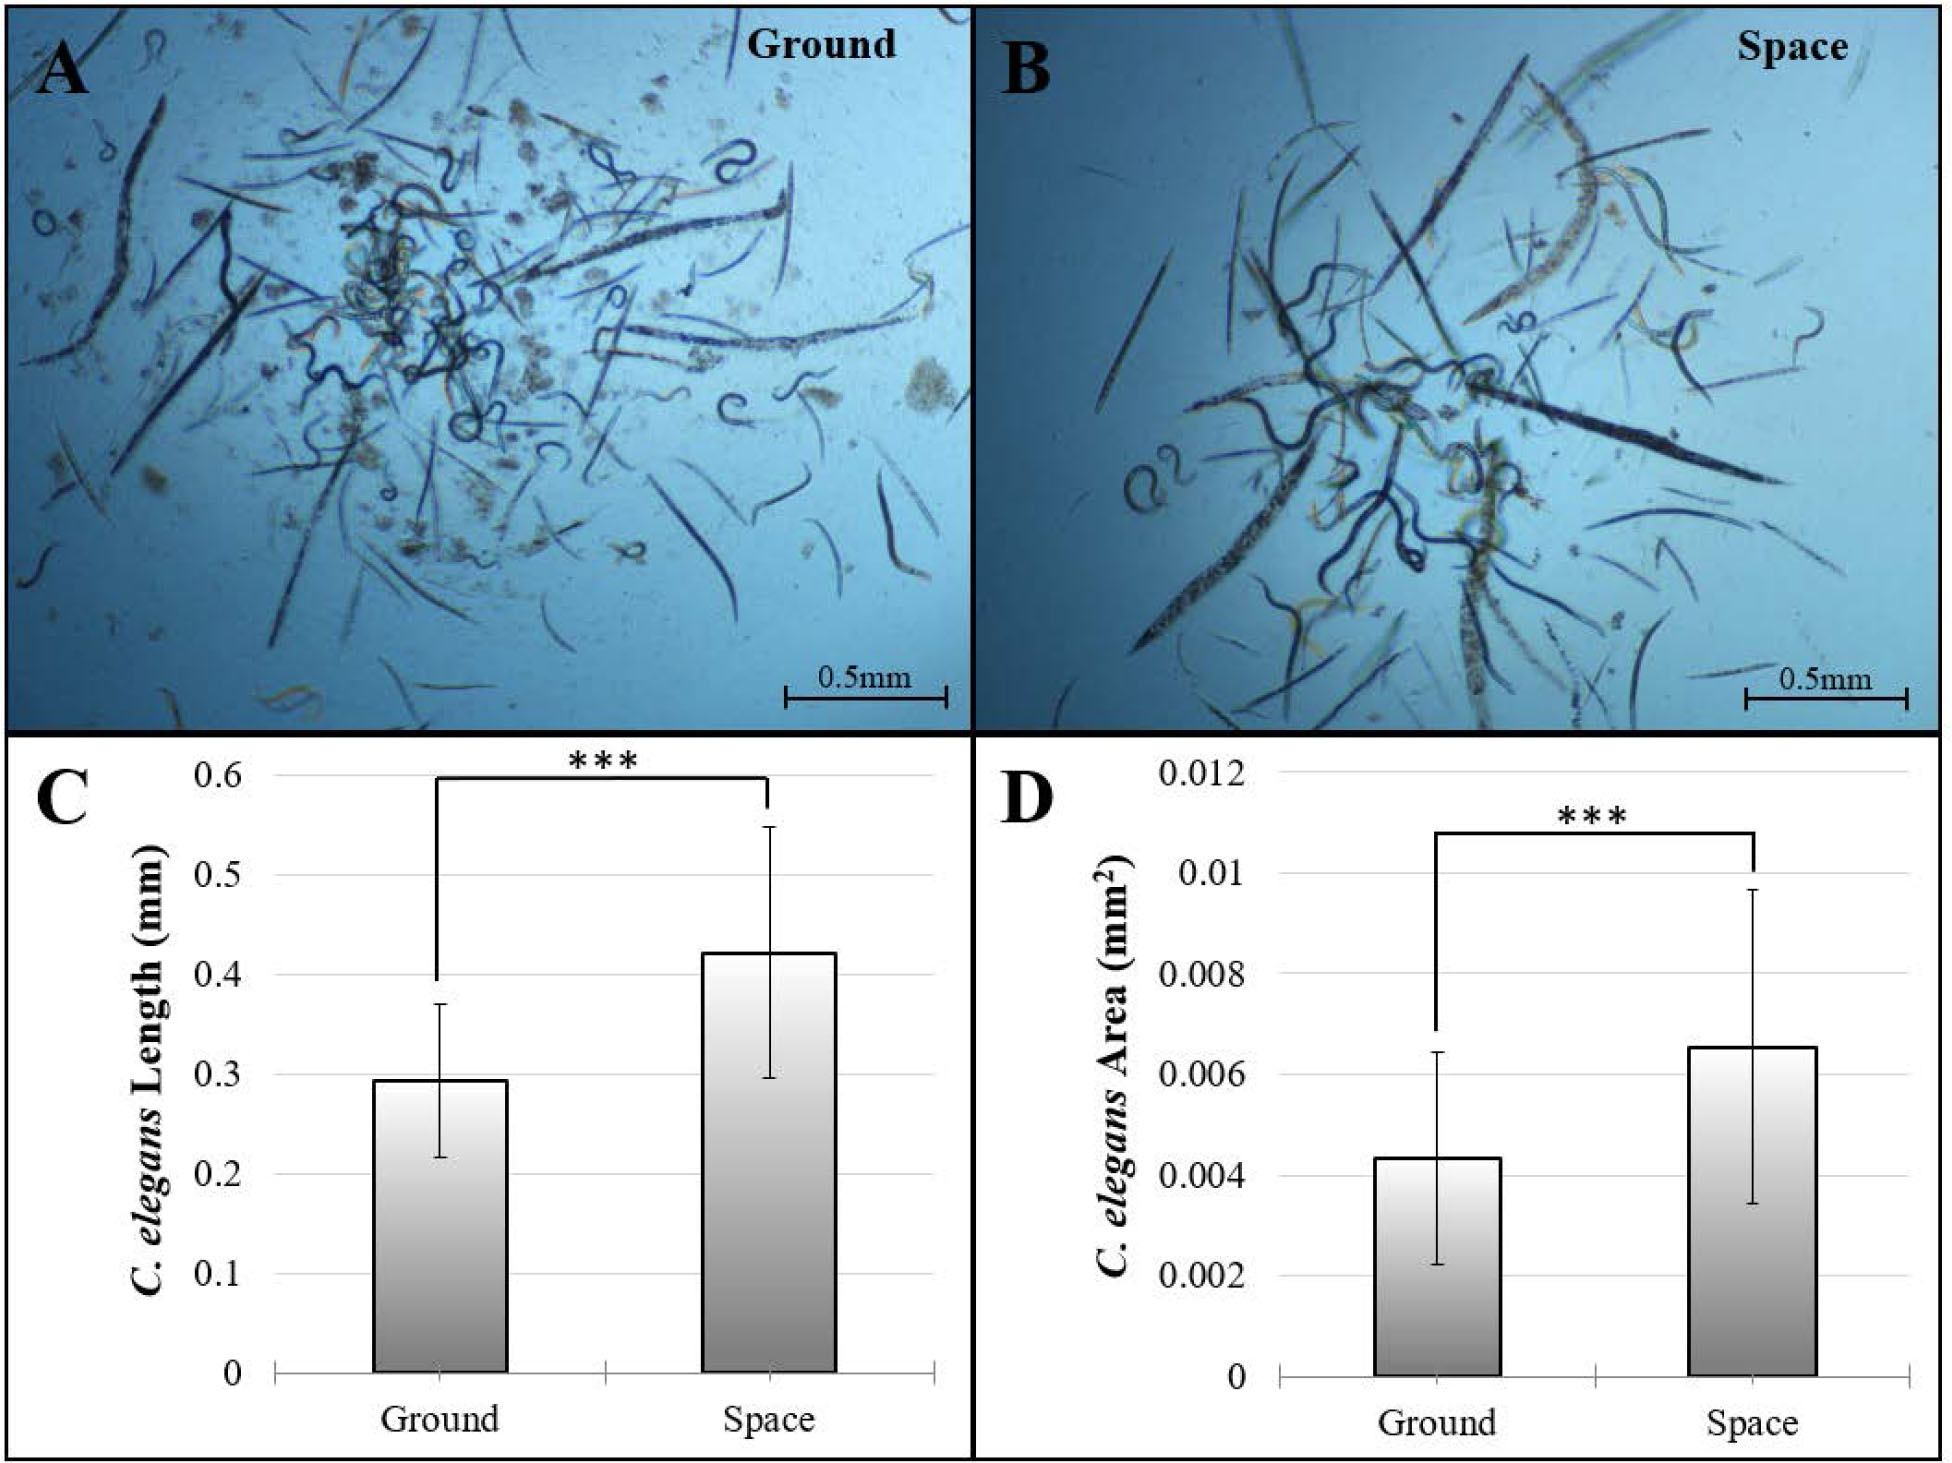
Figure 2
Length and cross-sectional area (CSA) of ground and space worms. Representative images of (A) ground worms, and (B) space worms are shown. Live C. elegans appear curled and dead C. elegans assume a straight and thick shape. Only live C. elegans were measured. The space worms (N=40) were longer (C), and had larger CSA (D), compared to the control worms (N=40). Data are mean ± SD. ***p<0.05.
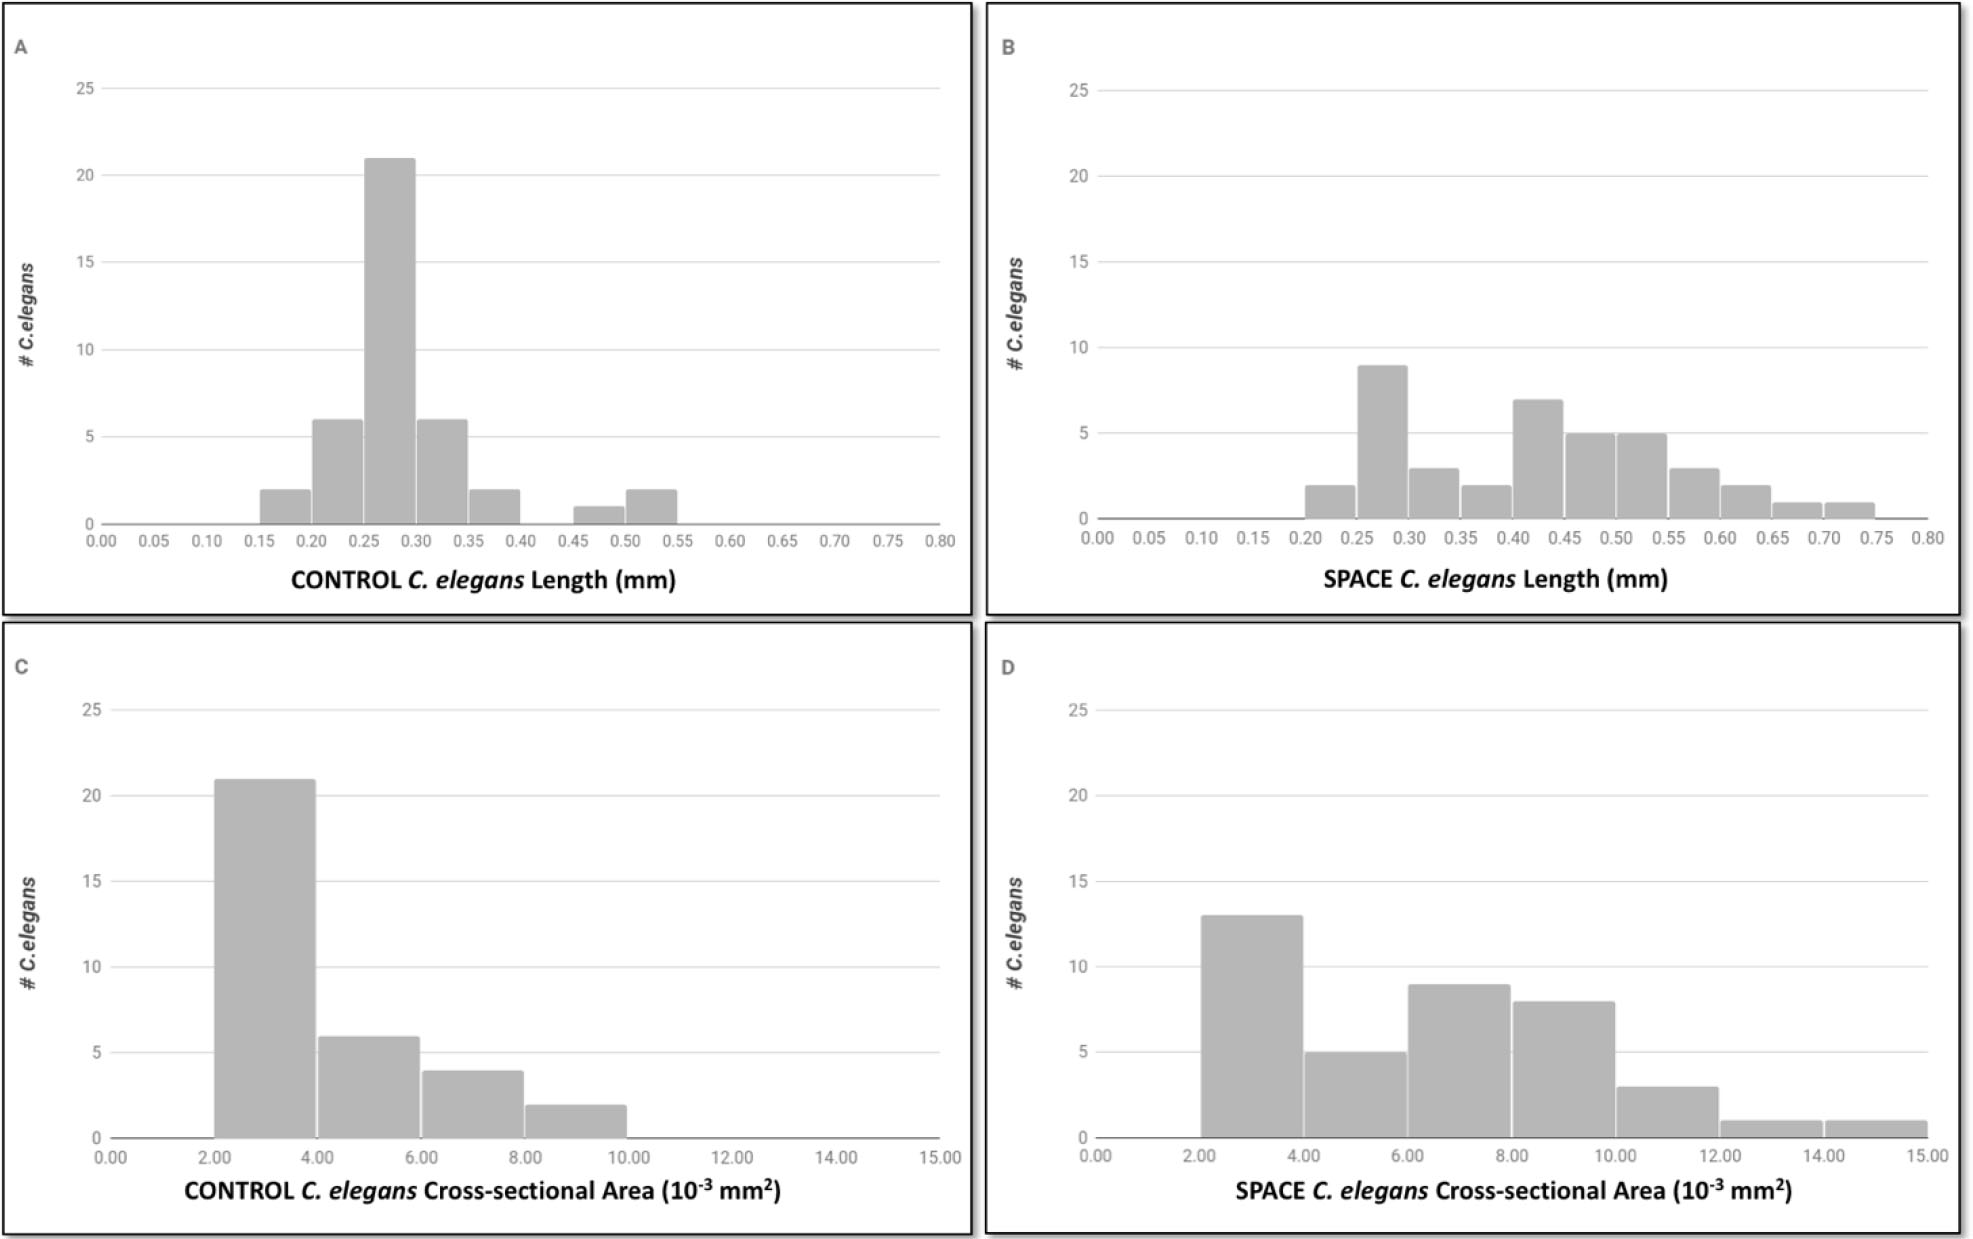
Figure 3
Histograms of length and cross-sectional area (CSA) of space and control C. elegans. The top panels depict the distribution of lengths of randomly selected control C. elegans (n=40, left panel) and space C. elegans (n=40, right panel). Bottom panels similarly demonstrate the distribution of CSAs of control (left panel) and space (right panel) worms. A broader distribution of both length and CSA is evident in the space worms compared to the control ground worms.
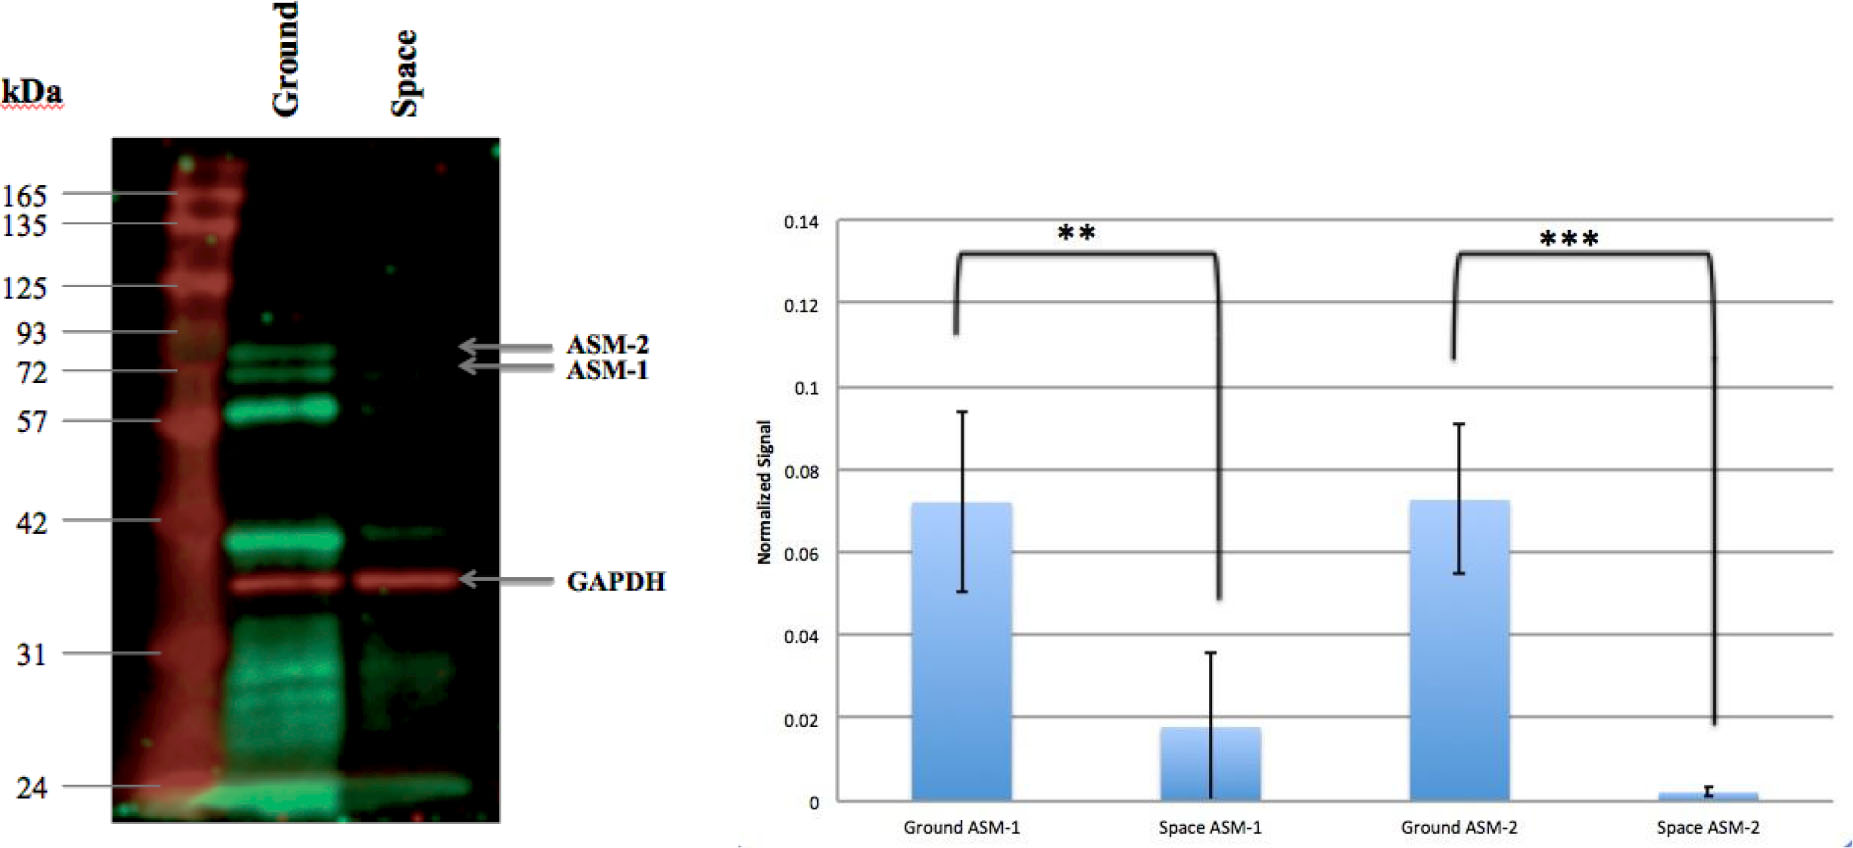
Figure 4
Ground and space worm lysates immunoblotted for ASM-1 and ASM-2. The space worms exhibited decreased expression of both ASM-1 and ASM-2, compared to the ground worms (left panel ASM Western blot, right panel graph of quantified fluorescent signal). GAPDH immunostaining demonstrates equivalent protein loading. Data are mean ± SD. ***p<0.05, **p<0.1.