
Table 1
Characteristics of various drop towers for research under microgravity. This table is based on data from the following publications: [1] Neumann, 2008; [2] Neumann, 2006; Neumann, 2017; [3] Steinberg, 2007; Steinberg, 2016; Lämmerzahl and Steinberg, 2015; [4] Zhang et al., 2005; Lämmerzahl and Steinberg, 2015; Huang and Mao, 2013; [5] Mori et al., 1993; Koide, 2001; Zhang et al., 2005; [6] Iwakami and Nokura, 2005; Nokura, 2008; [7] Dittus, 1991; ZARM FABmbH, 2011; Lämmerzahl and Steinberg, 2015; [8] Lotz et al., 2014.
| Name of facility | NASA Glenn 2.2 Second Drop Tower | Zero Gravity Research (Zero-G) Facility | Microgravity Drop Tower | Beijing Drop Tower | Drop Shaft Facility | Drop Exp. Facility | Bremen Drop Tower | Einstein-Elevator | |
|---|---|---|---|---|---|---|---|---|---|
| Research institution | NASA | NASA | QUT | NMLC | JAMIC | MGLAB | ZARM | HITec/LUH | |
| Country | USA | Australia | China | Japan | Germany | ||||
| Time in free fall in s | 2,2 | 5,18 | 2,0 | 3,5 | 10 | 4,5 | 4,7 / 9,3* | 2 / 4* | |
| Free fall distance in m | 24 | 132 | 20 | 60 | 490 | 100 | 110* | 20* | |
| Minimal residual acceleration | 10−3g | 10−5g | 10−4–10−6g | 10−3–10−5g | 10−5g | 10−5g | 10−6–10−7g | <10−6g | |
| Maximum deceleration | 15–30 g | 35–65 g | 15–20 g | 8–12 g | 8 g | 10 g | 40–50 g | 5 g | |
| Repetition rate per day | 12 | 2 | 15–20 | 2–4 | 2–3 | 1–2 | 3 | 100 | |
| Experiment payload in kg | 487C/159E | 1130C/455E | 150E | 630C/90E | 5000C/500E | 1000C/400E | 500C/400C, * 264E, S/221E, L/161,5E, S, * | 1000C/515E | |
| Experiment | Ø/□ | 960 × 400E | Ø1000C/Ø970E | Ø800E | Ø850C | Ø1800C/870 × 870E | Ø900C/Ø720E | Ø800C/Ø700E | Ø1700C/Ø1660E |
| Dimensions in mm | height | 840E | 4000C/1600E | 1500C/900E | 1000C | 7850C/918E | 2280C/885E | 2107C, L/1341C, S, * 1718E, L/953E, S | 2000C/1790E |
| Capsule-experiment configuration | DS | VC | DS | DS is VC | DS is VC | DS | VC +optional FF | comb. of DS, VC, FF | |
| Source | [1] | [2] | [3] | [4] | [5] | [6] | [7] | [8] | |
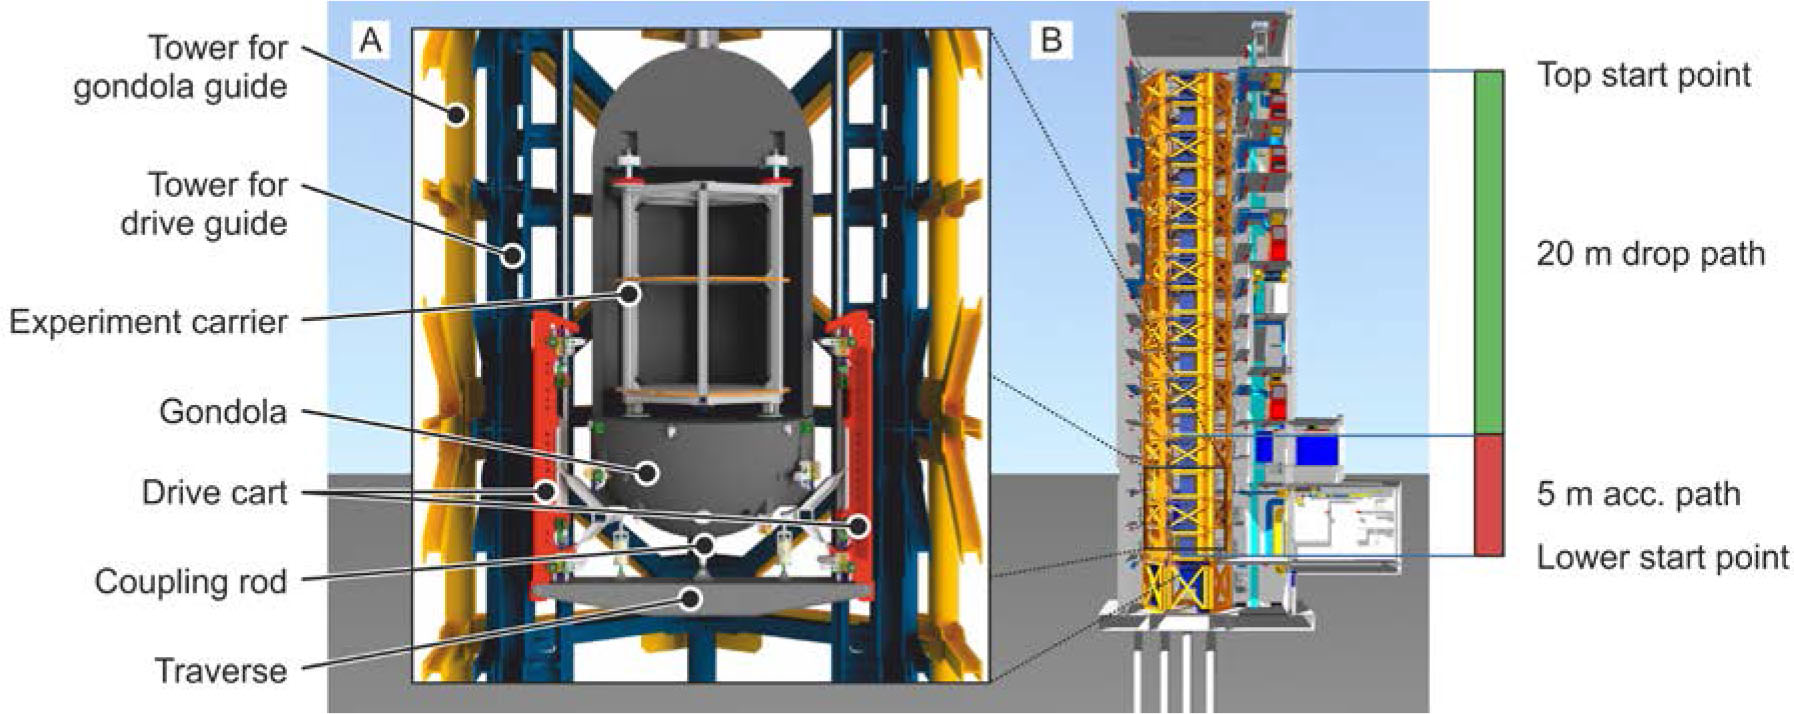
Figure 1
Design of the Einstein-Elevator. (A) Highlighted cut through the steel structure: the gondola with an empty experiment carrier. (B) Sketch of the tower with the division of areas in the tower building.
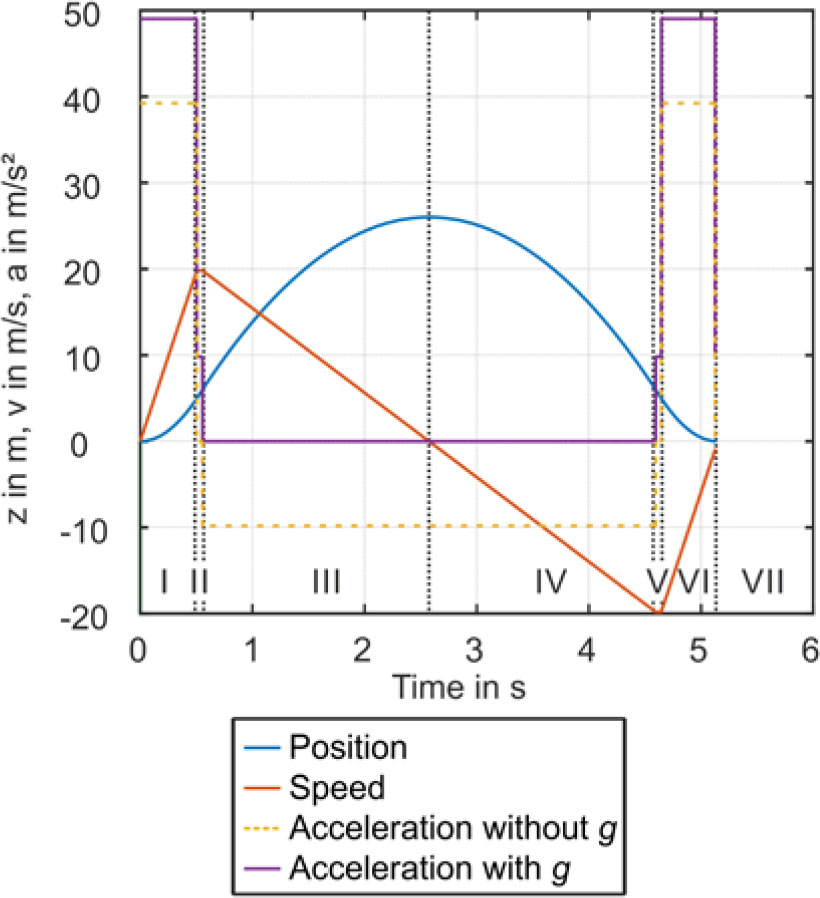
Figure 2
Trajectory profile for microgravity conditions. The coordinate “z” stands for the direction of motion. Description of sections: I. Acceleration section: 5 m; II. Constant travel: 1 m, separation of gondola and experiment; III. Parabolic flight (upwards): 20-m free fall plus 2-m reserve (top); IV. Parabolic flight (downwards): 20-m free fall; V. Constant travel: 1 m, approach and contact between gondola and experiment; VI. Braking: 5 m short-circuited stators, effect of the eddy current brake, plus 2X 4 rows of switched eddy current brake of length 0.5 m each on 2-m onboard brake fins; VII. Contact with hydraulic cylinder.
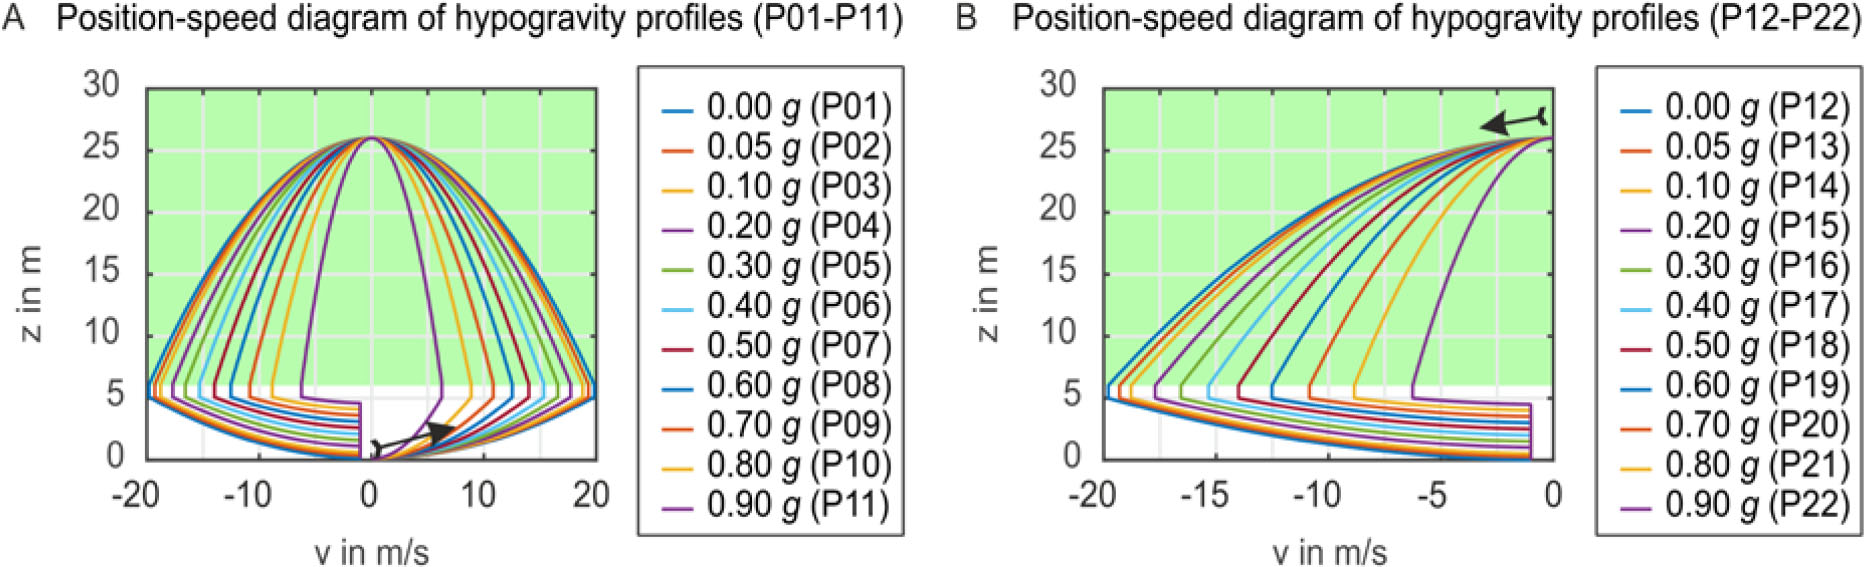
Figure 3
Position-speed diagrams for micro- and hypogravity experiments. The coordinate “z” stands for the direction of motion. (A) Microgravity in parabolic flight (profile P01), hypogravity in parabolic flight (profiles P02–P11). (B) Microgravity in free fall (profile P12), hypogravity in free fall (profiles P12–P22). The key area for the trajectory profiles is the light green area.
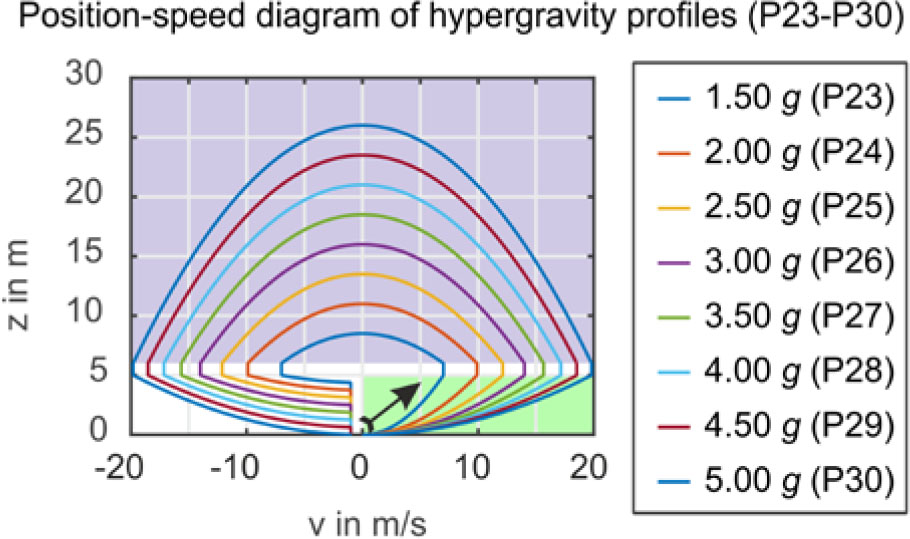
Figure 4
Position-speed diagram for hypergravity experiments. The coordinate “z” stands for the direction of motion. Hypergravity (profiles P23–30). The key area for the trajectory profiles is the light green area. Besides the μg-profile subsequent to hypergravity profiles shown in light purple area, hypogravity profiles are also feasible.
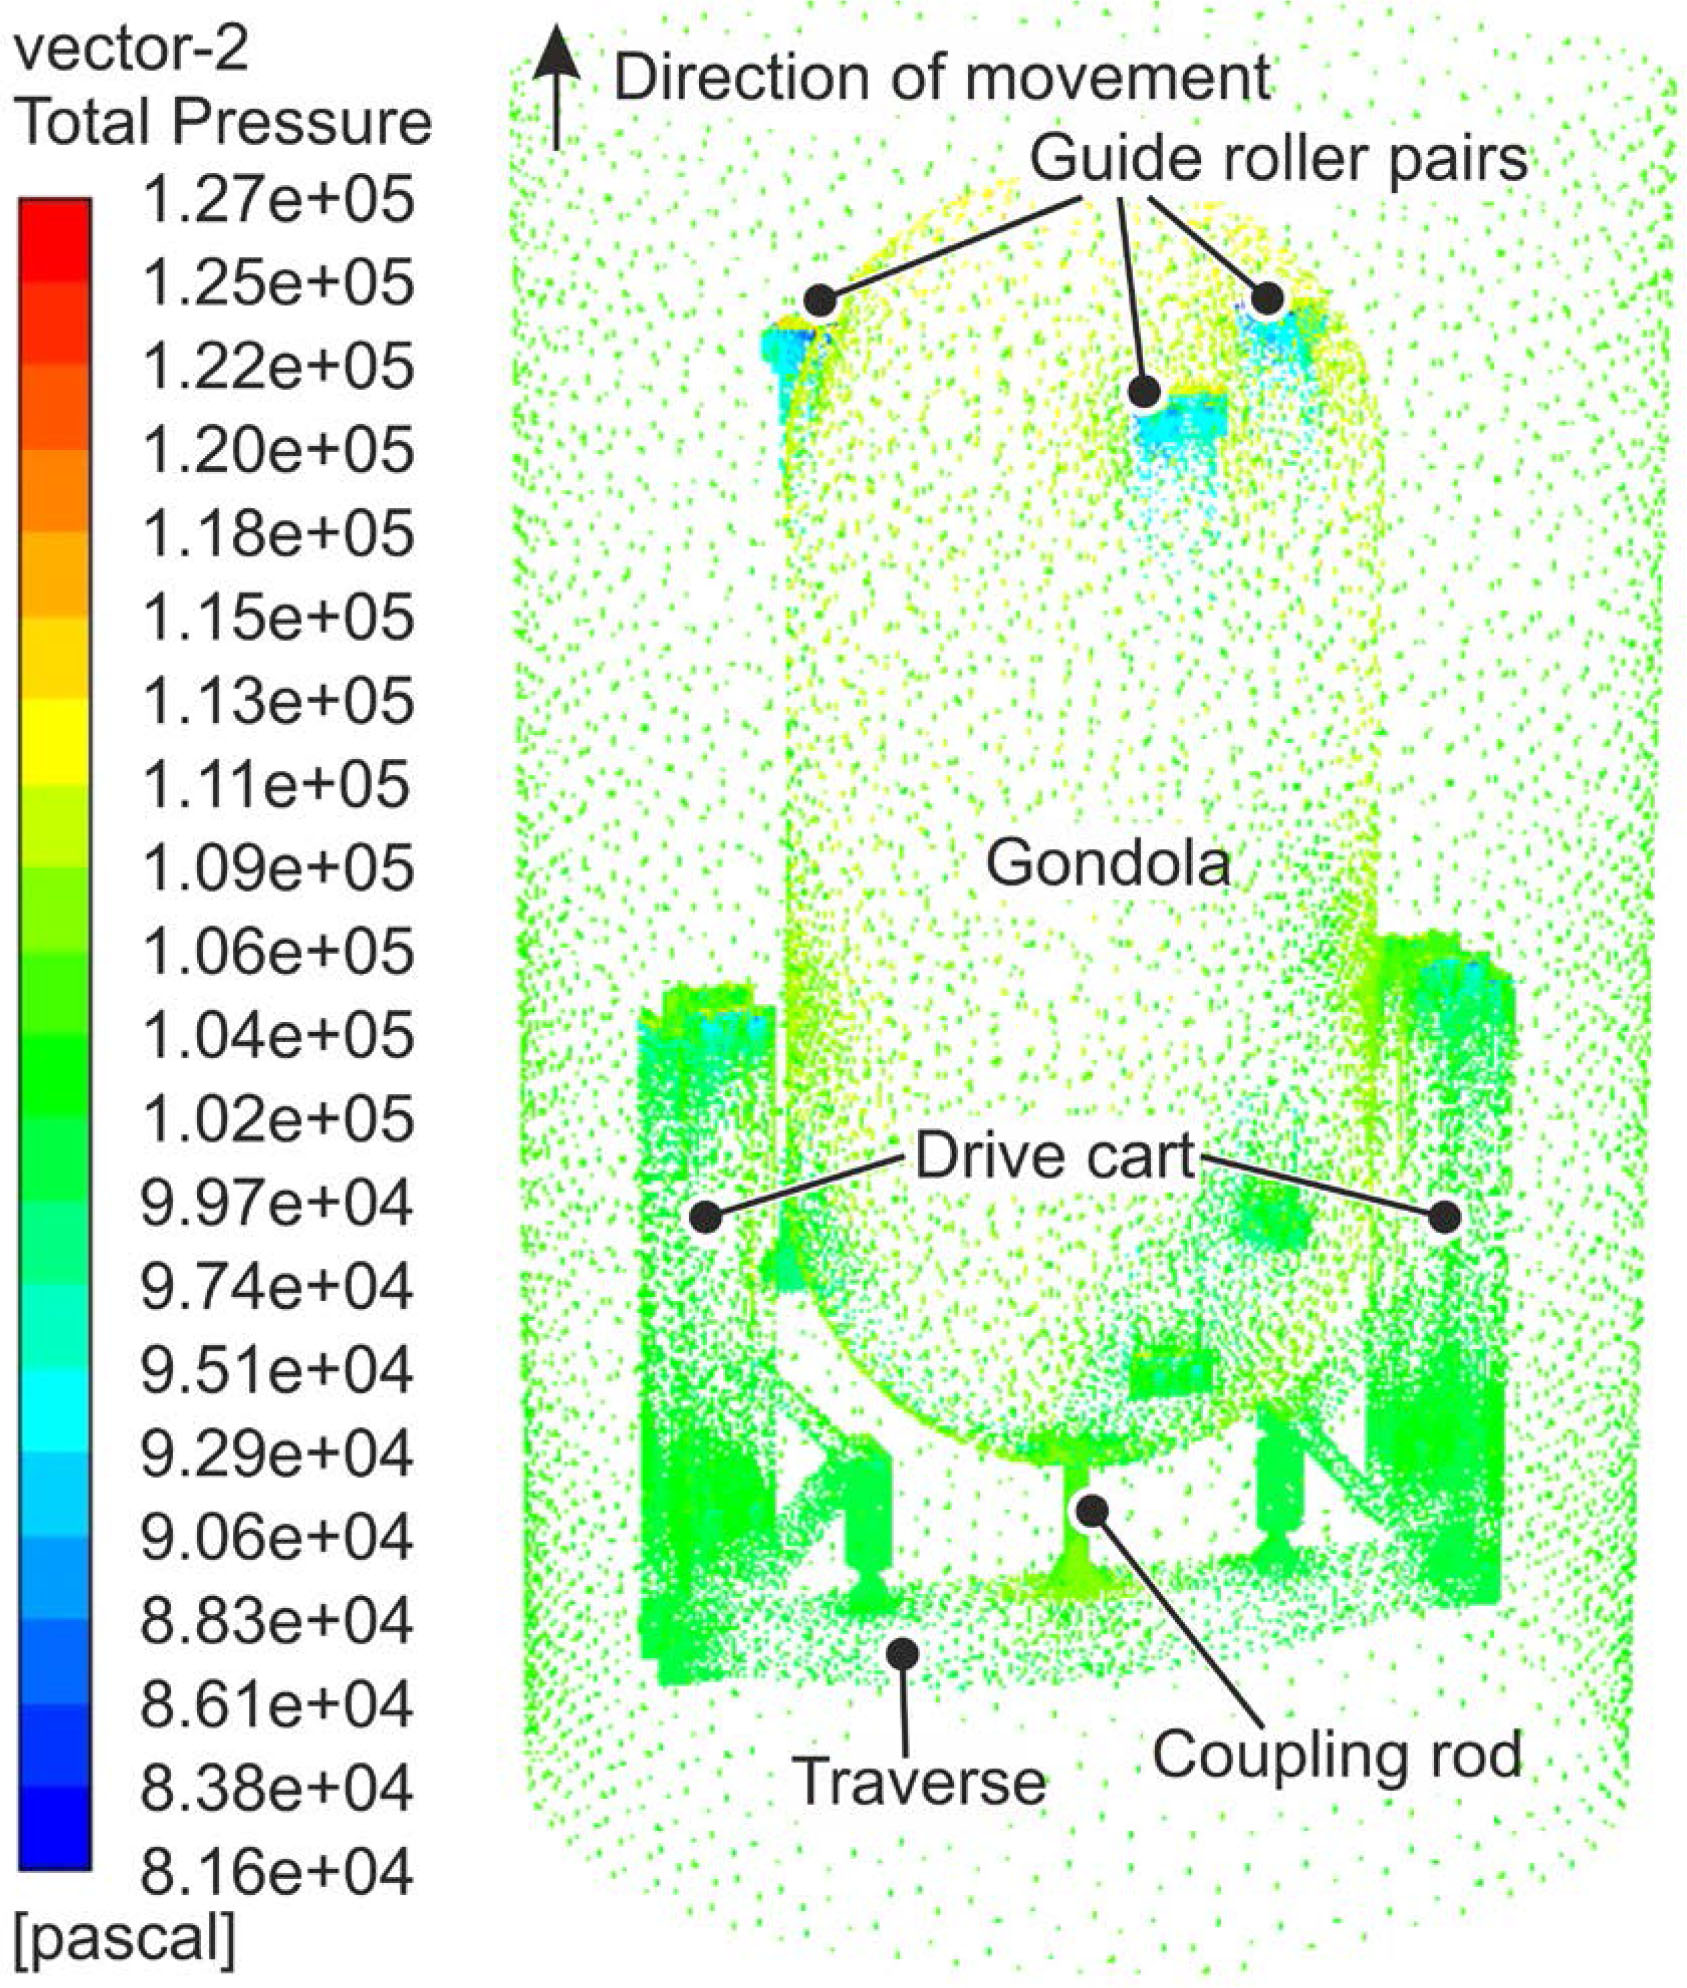
Figure 5
Gondola and drive carts in computational fluid dynamics (CFD) simulation. Results show how the airflow behaves around the moving parts and which pressure and reaction forces occur.
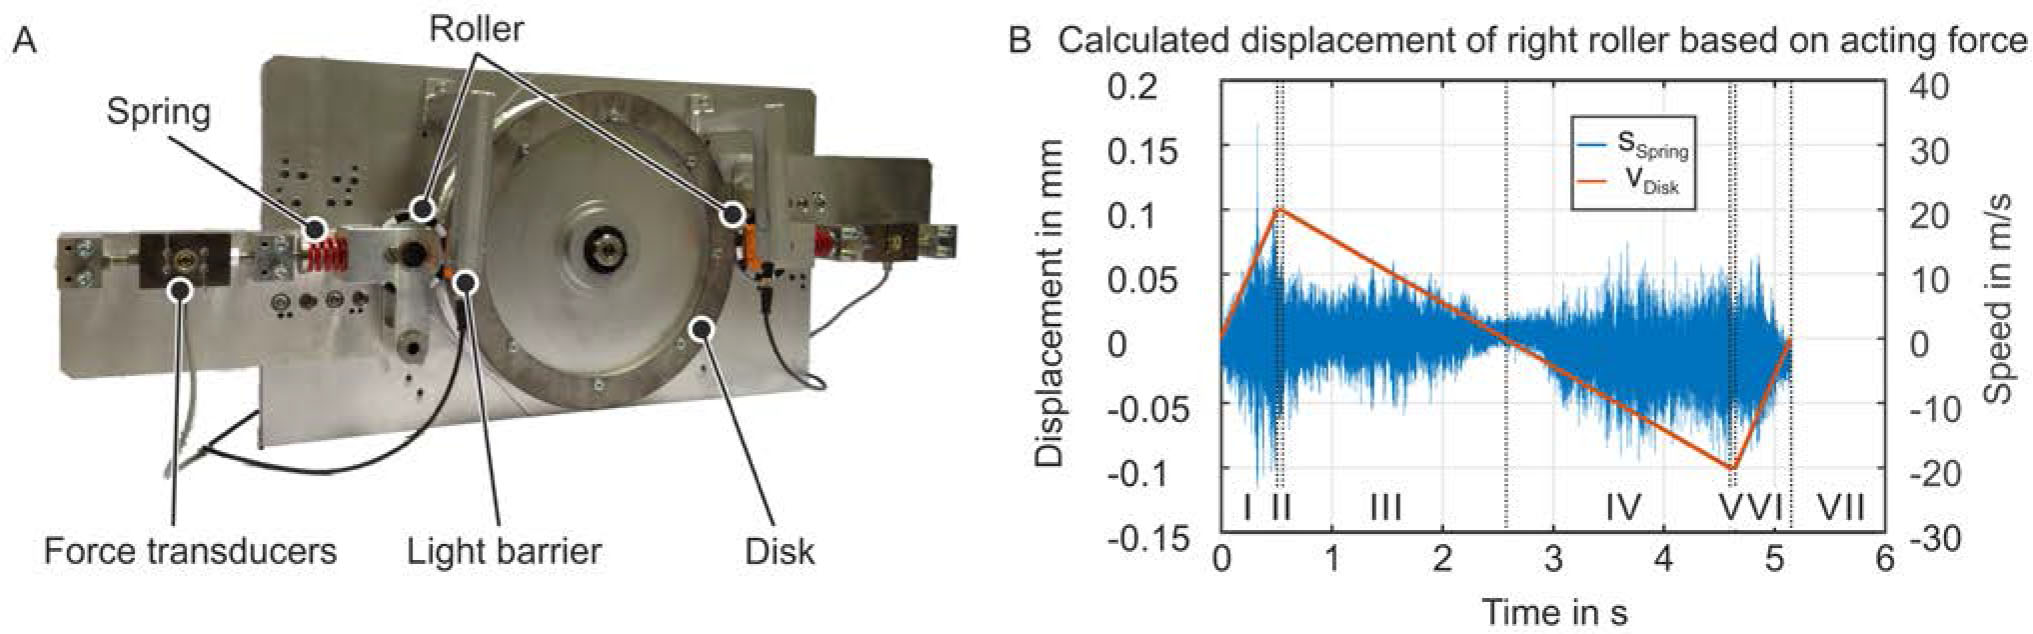
Figure 6
Roller characterizations. (A) Test rig to analyze the behavior of two mounted rollers in combination with the disk surface. The disks represent the guide rails and can be made of different materials to achieve the best combination with the lowest vibration. (B) Vibration amplitudes of one roller and the speed of the driven disk for its movement sections: I. Acceleration; II. Constant travel; III. Parabolic flight (upwards); IV. Parabolic flight (downwards); V. Constant travel; VI. Braking; VII. Waiting for next test execution.
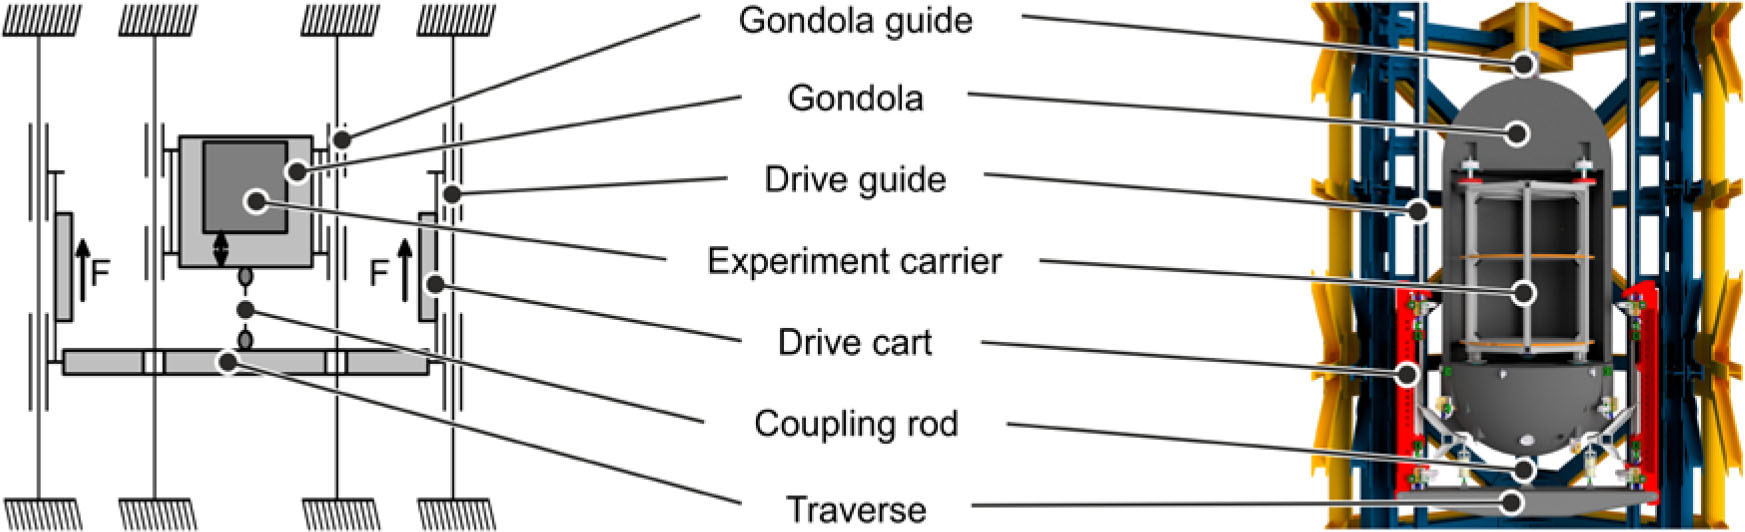
Figure 7
Concept of the Einstein-Elevator. Design sketch to show the general structure of the system and the actual design to display its technical realization.
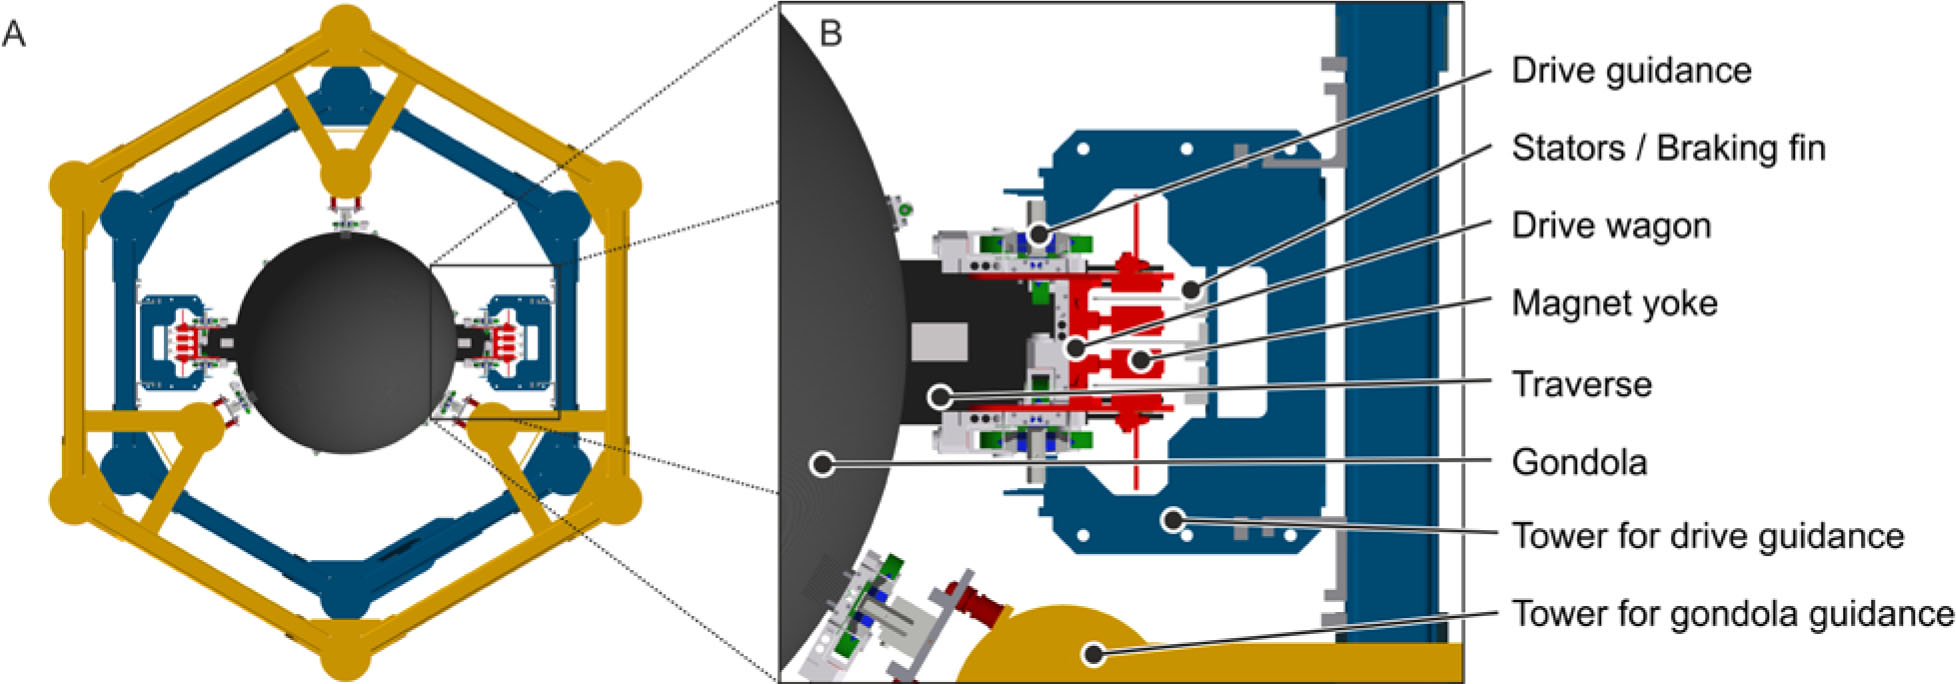
Figure 8
Detailed overview of the drive configuration. (A) Top view of the tower-in-tower construction. (B) Section with the highlighted drive configuration.
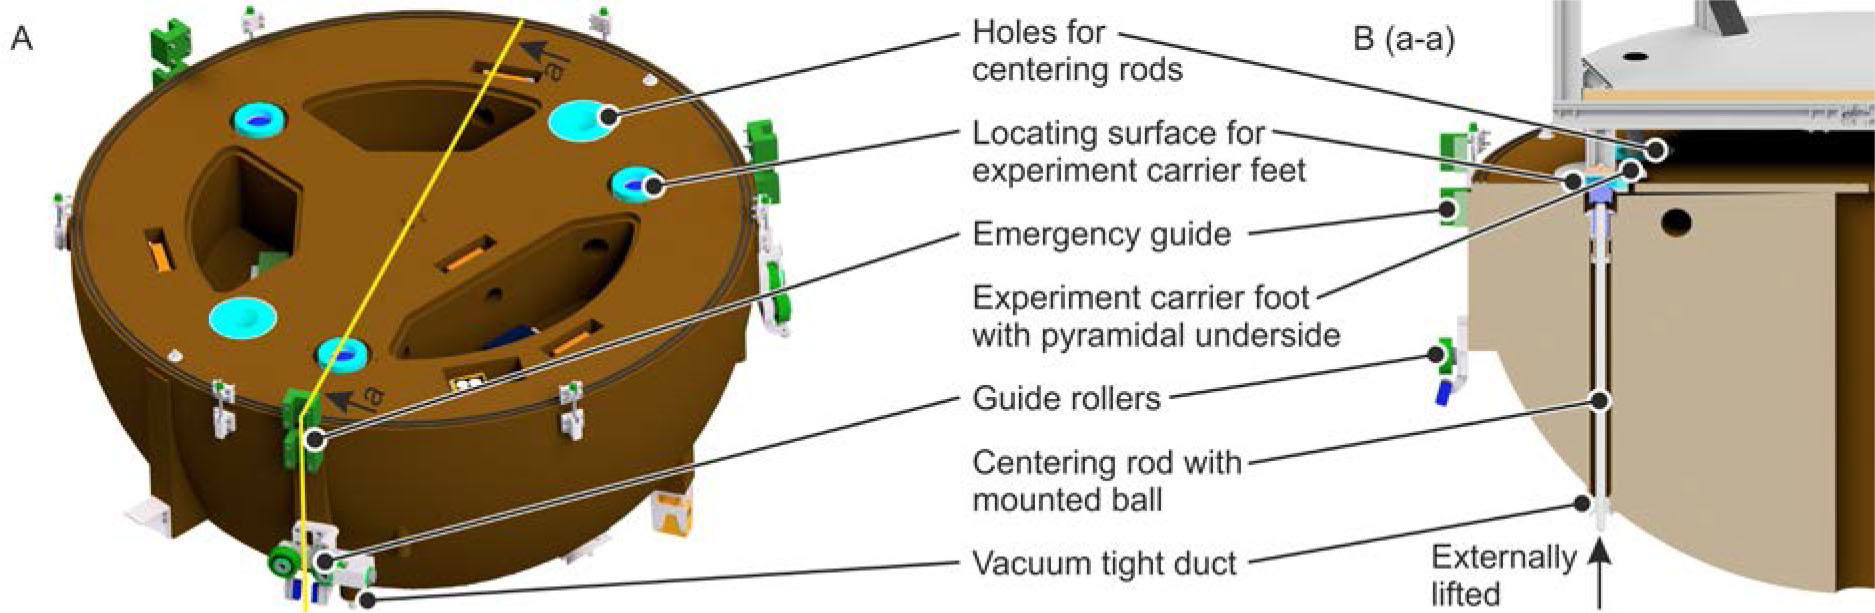
Figure 9
Gondola lower shell and automatic centering unit. (A) Gondola lower shell with its interior and marked cut a. (B) Cut a-a shows the details of the automatic centering unit. The rod with a ball mounted on top is being pushed upwards. Pyramid-shaped counterparts at the three legs provide the self-centering capability of the experiment carrier inside the evacuated gondola.
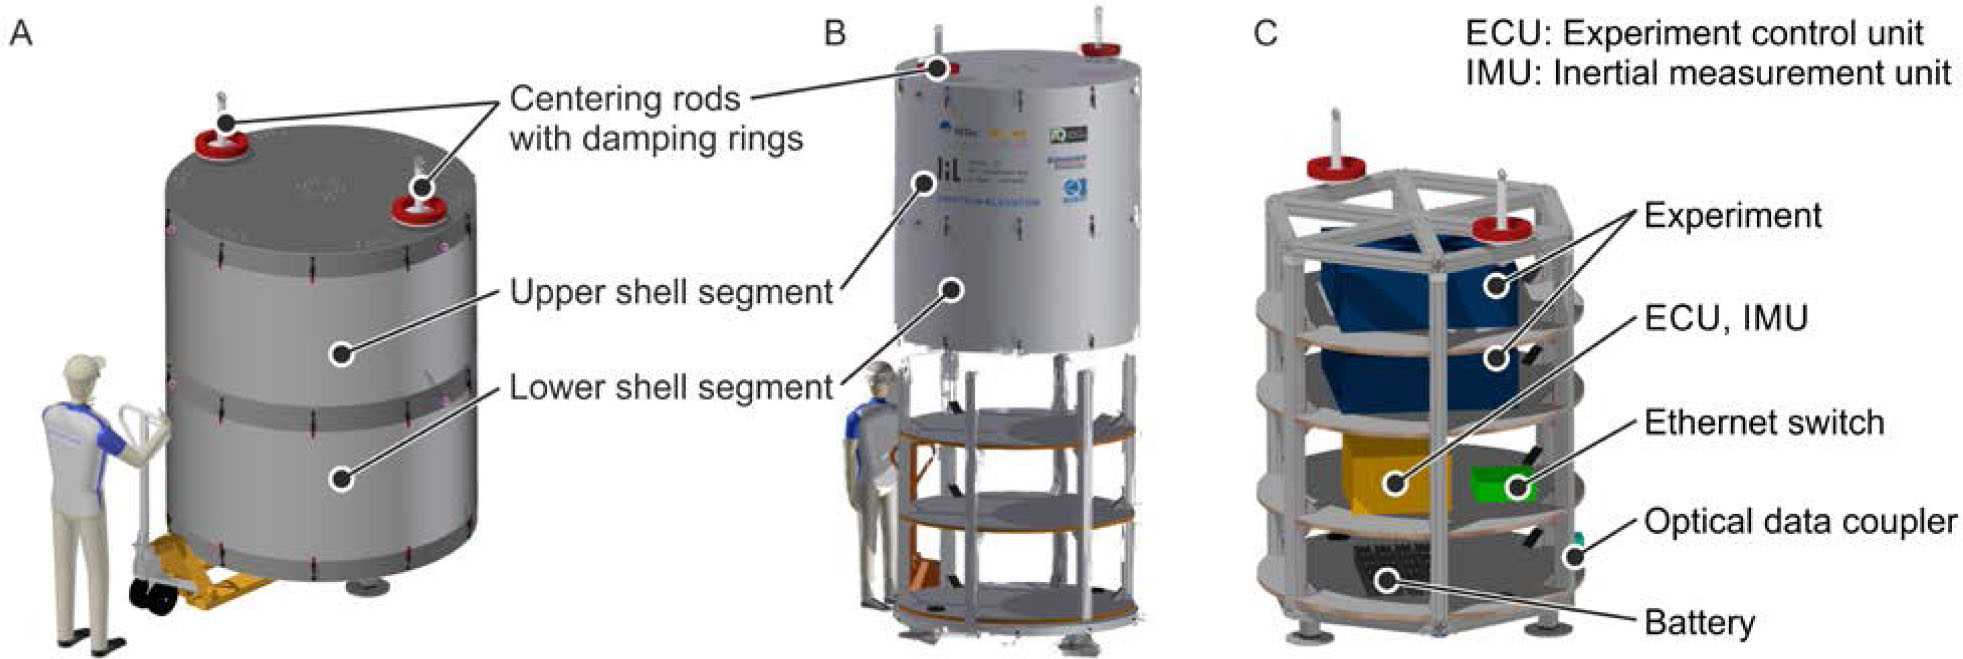
Figure 10
Structure of the experiment carrier. (A) Closed with pressure-tight shell. (B) Opened with lifted shell. (C) Example of the arrangement of the components in the experiment carrier.
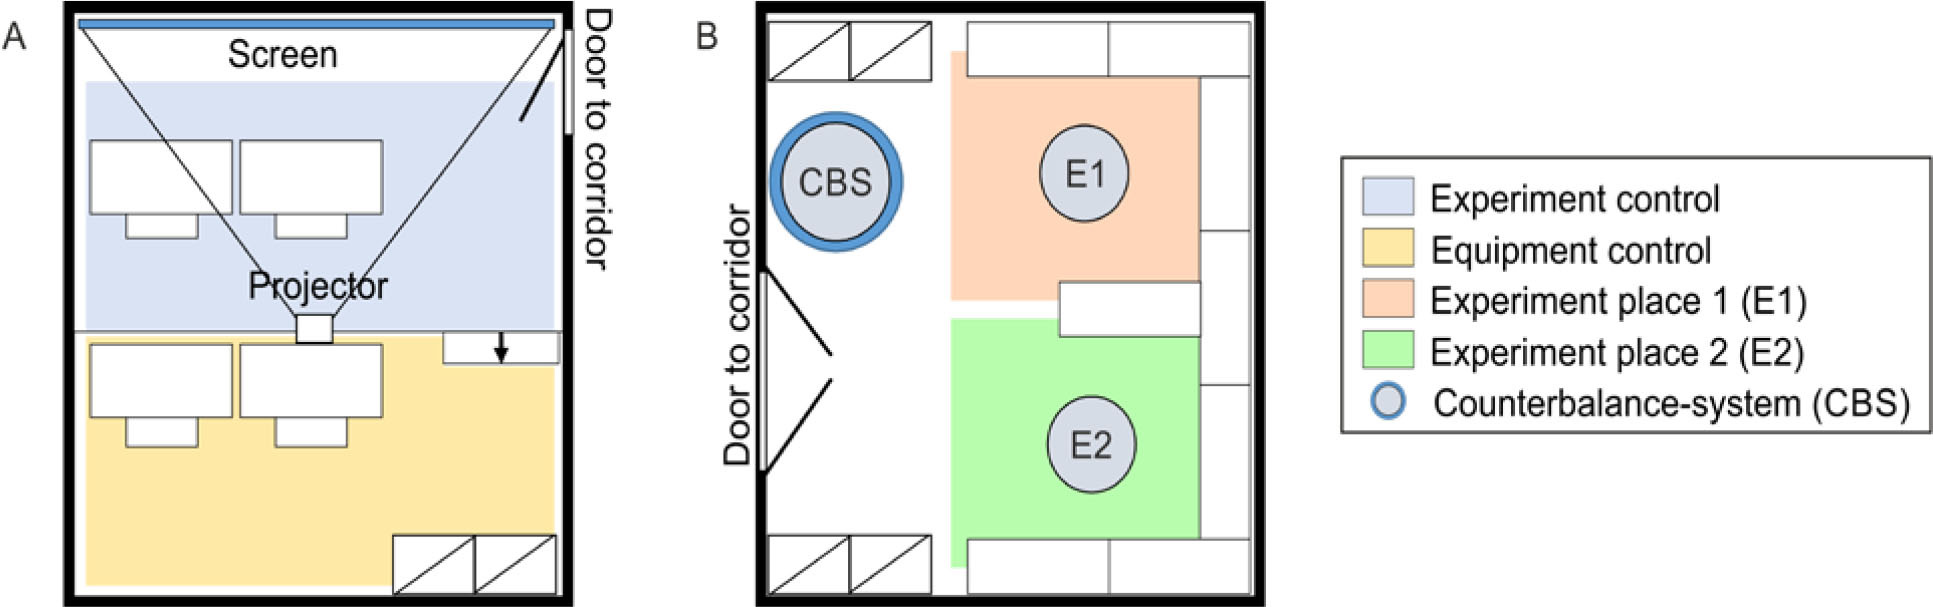
Figure 11
Options for scientists. (A) Depiction of the workplaces in the control room with the areas for facility operating staff and scientists. (B) Test preparation area with two workplaces for scientists to finish the setup assembly (after Lotz et al., 2014).
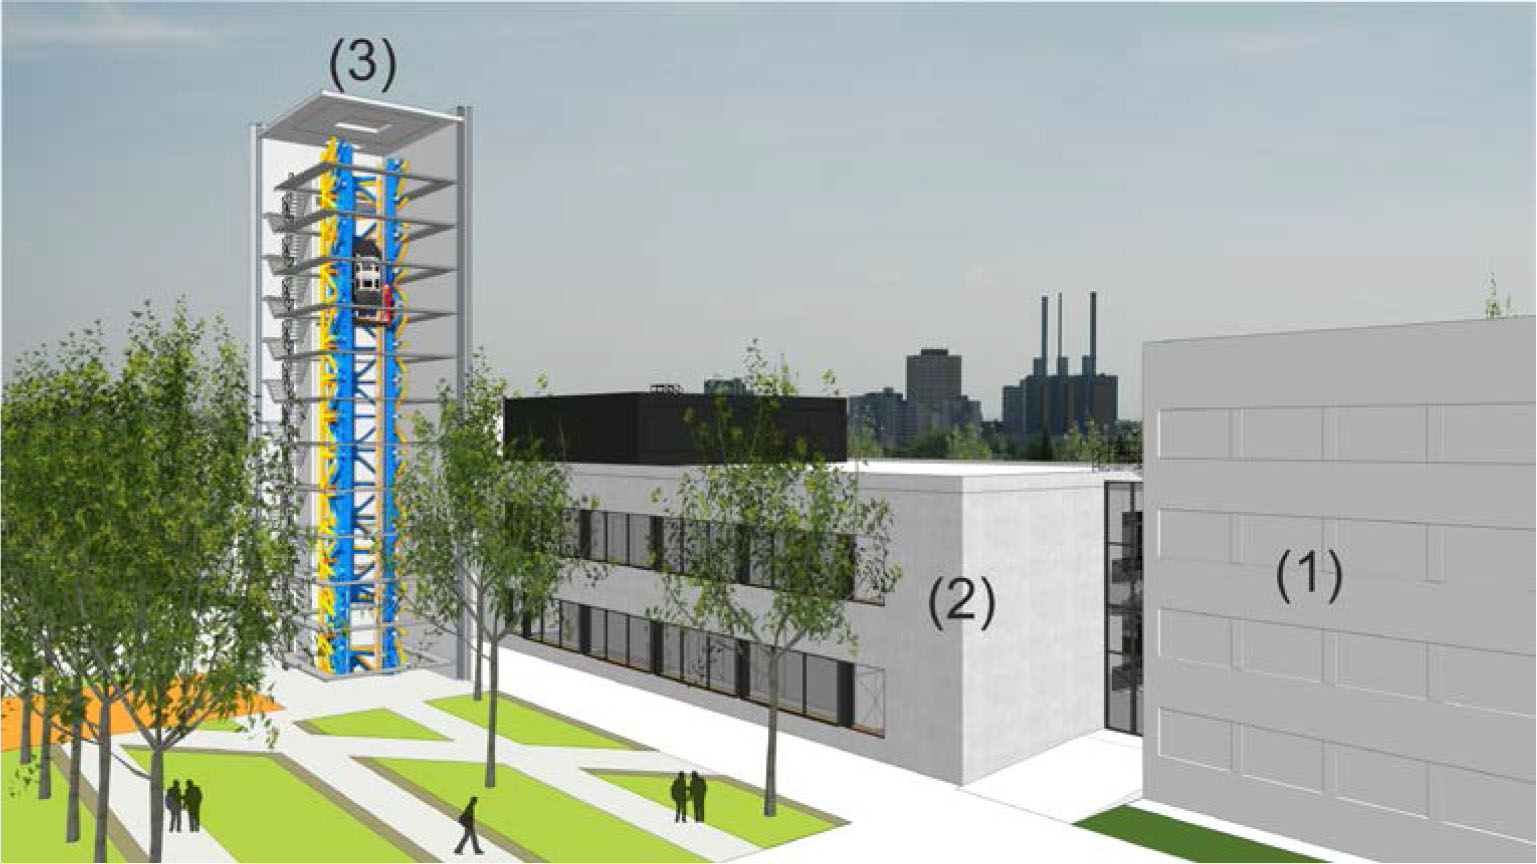
Figure 12
Visualization of the Hannover Institute of Technology (HITec) and the Einstein-Elevator within the Hannover skyline. (1) Offices, (2) Laboratory building, (3) Tower building with the Einstein-Elevator.