
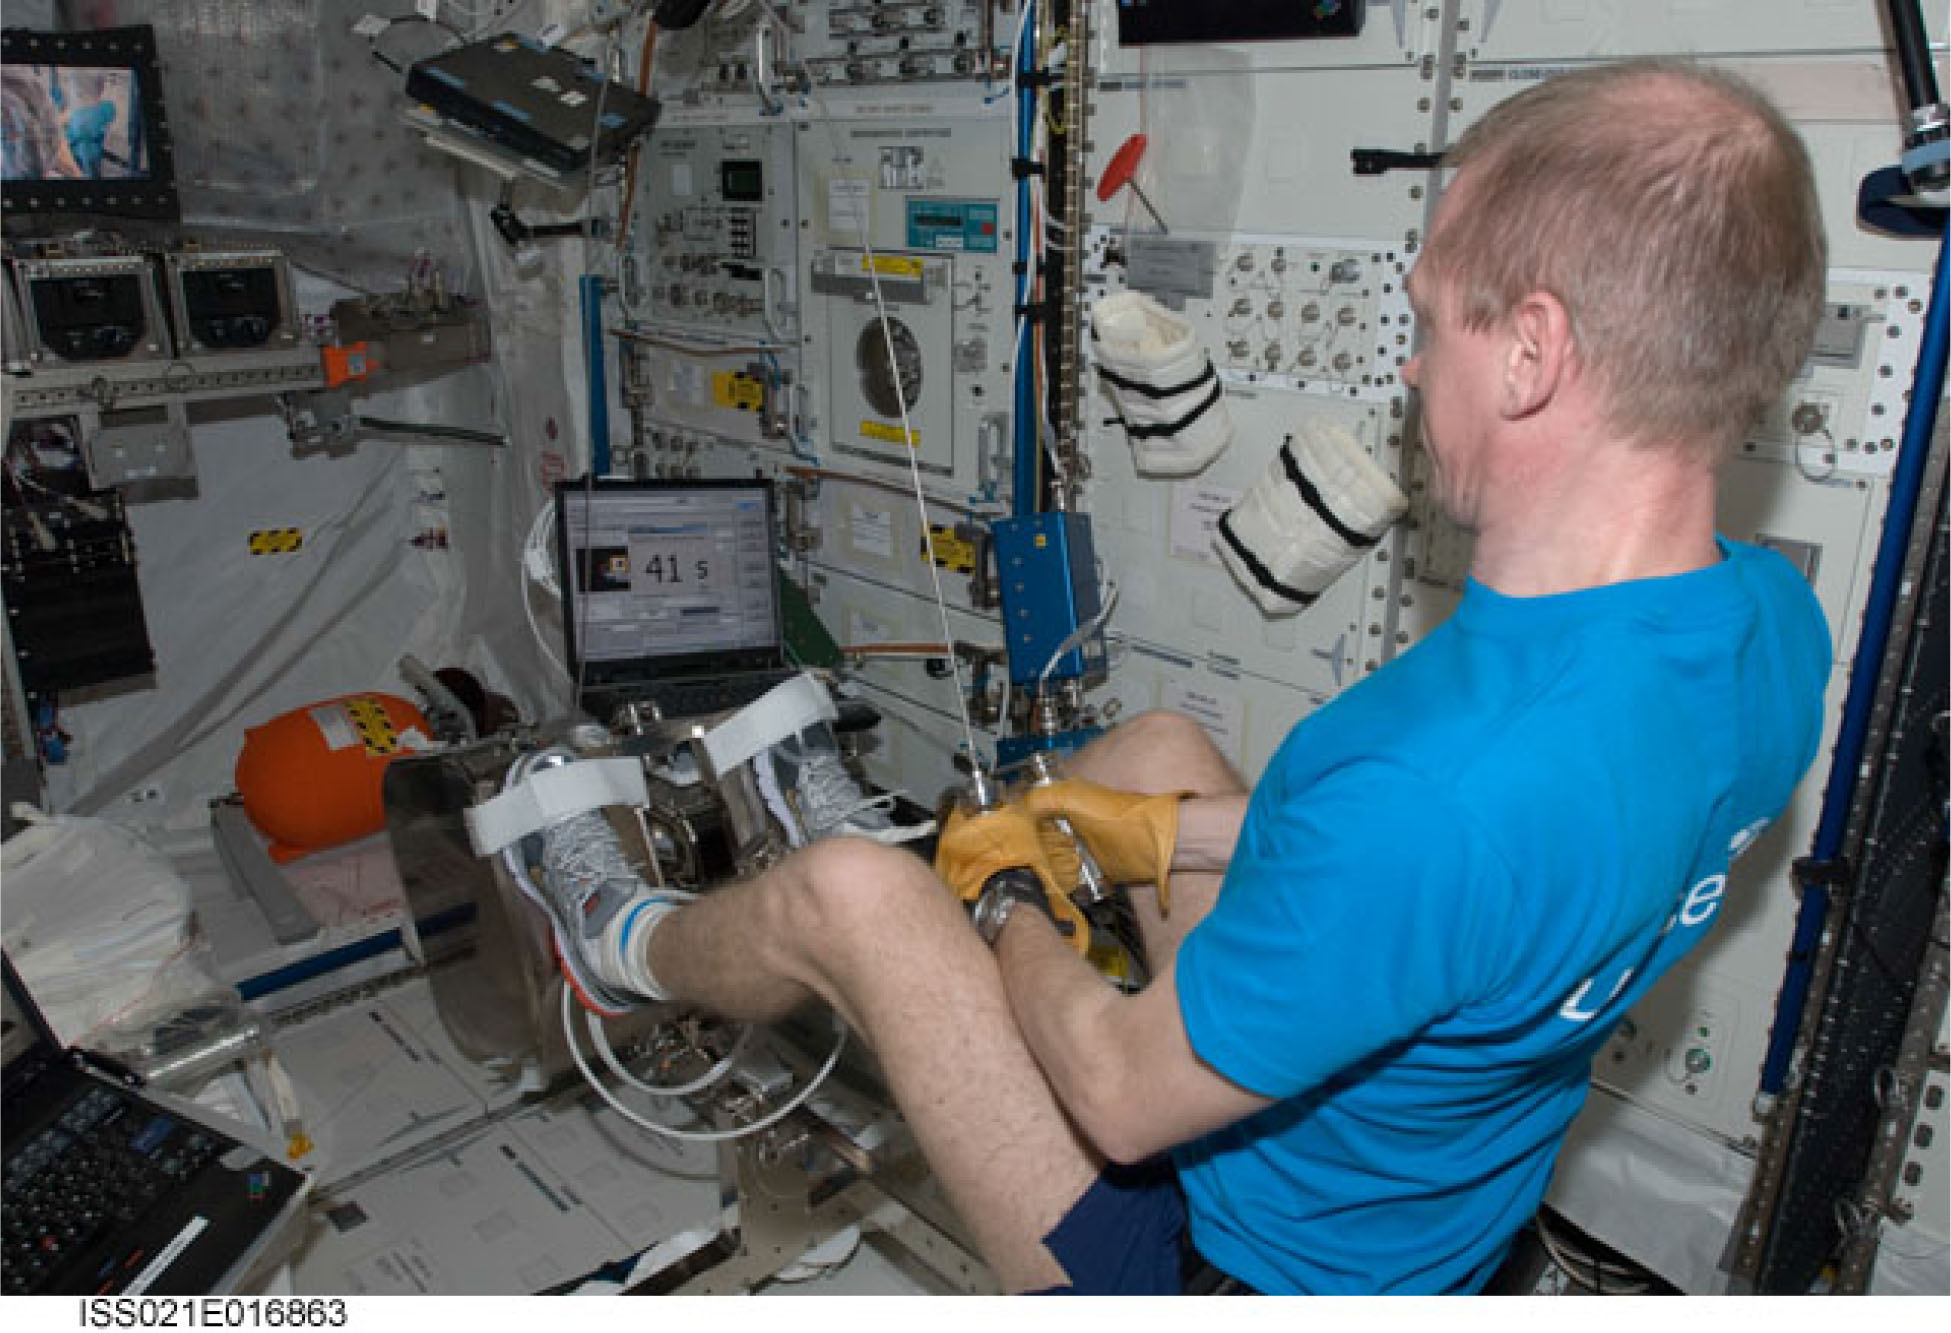
Figure 1
The flywheel exercise device (FWED) in use onboard the International Space Station.
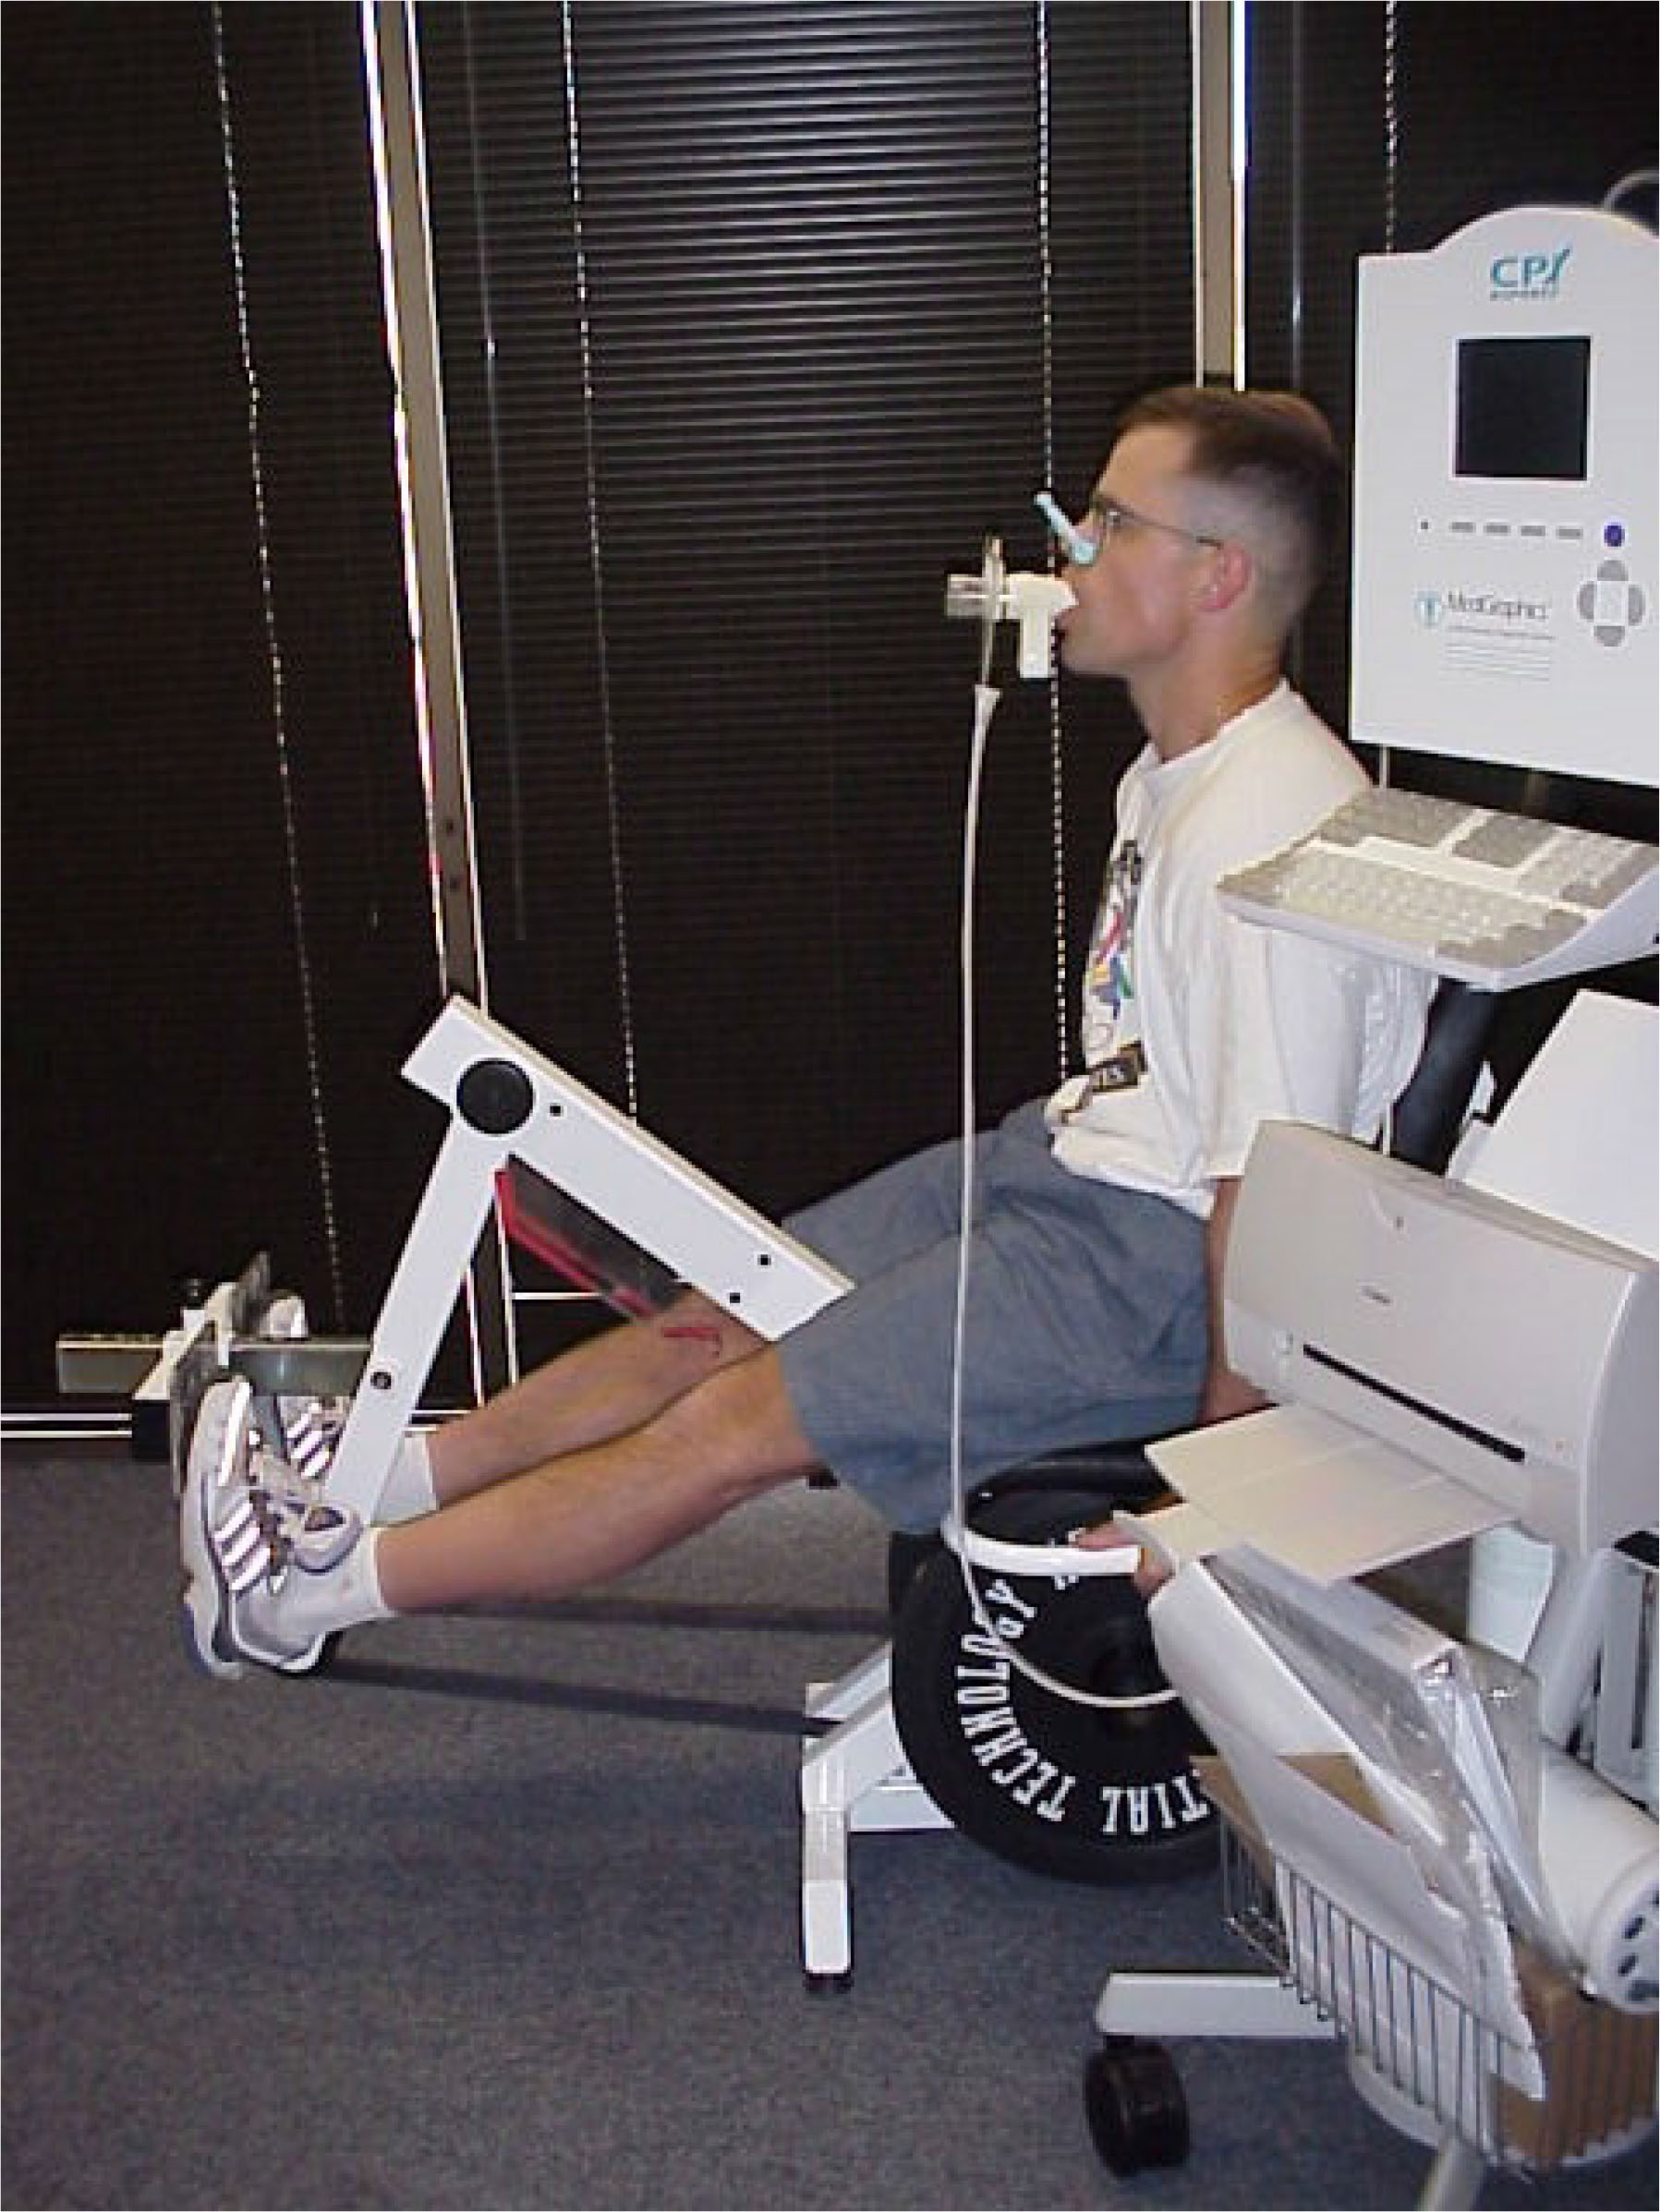
Figure 2
Configuration of the prototype flywheel ergometer and metabolic cart as current study seated calf press repetitions were performed.
Table 1
Descriptive statistics for current study criteria and predictor variables, as well as height and body mass values. Data are presented by gender and total (n = 30) subject values.
| Variable (units) | Male subjects | Female subjects | Total subjects | |||
|---|---|---|---|---|---|---|
| x̄ ± sem | range | x̄ ± sem | range | x̄ ± sem | range | |
| TW (joules · 103) | 19.4±1.1 | 11.2–29.3 | 14.4±1.5 | 8.9–25.6 | 17.0±1.0 | 8.9–29.3 |
| net energy cost (kcals) | 26.7±1.5 | 15.4–36.7 | 17.6±1.5 | 8.6–28.6 | 22.4±1.3 | 8.6–36.7 |
| [BLa−] (mmol · L−1) | 5.5±0.4 | 3.0–8.5 | 4.7±0.4 | 2.8–8.1 | 5.1±0.3 | 2.8–8.5 |
| LLL (cm) | 51.0±0.6 | 45–56 | 46.0±0.6 | 43–50 | 48.6±0.7 | 43–56 |
| ML (cm) | 22.0±0.4 | 20–25 | 22.0±0.6 | 18–26 | 22.0±0.4 | 18–26 |
| ATL (cm) | 29.0±0.7 | 25–34 | 24.0±0.9 | 19–29 | 26.6±0.7 | 19–34 |
| CSA (cm2) | 94.0± 3.8 | 75–130 | 71.0±3.4 | 48–93 | 83.1±3.3 | 48–130 |
| Height (cm) | 179.0± 2.0 | 168–187 | 169.0± 2.0 | 160–182 | 174.0± 2.0 | 160–187 |
| Body mass (kg) | 79.9± 4.1 | 71–111 | 65.4± 2.5 | 48–92 | 72.01± 2.6 | 48–111 |
[i] TW: total work
[ii] [BLa−]: peak blood lactate concentration
[iii] LLL: lower leg length
[iv] ML: muscle length
[v] ATL: Achilles tendon length
[vi] CSA: lower leg cross-sectional area
Table 2
The degree of colinearity among the current study predictor variables.
| LLL | ML | ATL | CSA | |
|---|---|---|---|---|
| LLL | 1 | |||
| ML | 0.26 | 1 | ||
| ATL | 0.87 | −0.25 | 1 | |
| CSA | 0.69 | −0.06 | 0.72 | 1 |
[i] LLL: lower leg length
[ii] ML: muscle length
[iii] ATL: Achilles tendon length
[iv] CSA: lower leg cross-sectional area
Table 3
Univariate matrix, r, r2, and prediction equation values for our multivariate regression analysis with total work (TW) as our criterion variable.
| LLL | ML | ATL | CSA | TW | |
|---|---|---|---|---|---|
| TW | 0.22 | 0.15 | 0.16 | 0.50 | 1 |
[i] r = 0.66 (P < 0.05); r2 = 0.43
[ii] TW′ = 1864.9 - 4.5(LLL) + 2.4(ML) + 4.1(ATL) + 0.8(CSA)
[iii] LLL: lower leg length
[iv] ML: muscle length
[v] ATL: Achilles tendon length
[vi] CSA: lower leg cross-sectional area
Table 4
Univariate matrix, r, r2, and prediction equation values for our multivariate regression analysis with net energy cost as our criterion variable.
| LLL | ML | ATL | CSA | net energy cost | |
|---|---|---|---|---|---|
| net energy cost | 0.67 | 0.20 | 0.57 | 0.67 | 1 |
[i] net energy cost′ = −32.1 + 1.9(LLL) − 0.7(ML) − 1.6(ATL) + 0.5(CSA)
[ii] r = 0.75 (P < 0.05); r2 = 0.56
[iii] LLL: lower leg length
[iv] ML: muscle length
[v] ATL: Achilles tendon length
[vi] CSA: lower leg cross-sectional area
Table 5
Univariate matrix, r and r2 values for our multivariate regression analysis with peak blood lactate concentration ([BLa−]) as our criterion variable.
| LLL | ML | ATL | CSA | [BLa−] | |
|---|---|---|---|---|---|
| [BLa−] | 0.38 | 0.17 | 0.30 | 0.39 | 1 |
[i] r = 0.49 (P = 0.12); r2 = 0.24
[ii] LLL: lower leg length
[iii] ML: muscle length
[iv] ATL: Achilles tendon length
[v] CSA: lower leg cross-sectional area