
Table 1
Schedule of activities for BRIC-23 Science Verification Test (SVT), Flight (FL), and Ground Control (GC) experiments*.
| SVT | FL | GC | ||||
|---|---|---|---|---|---|---|
| Actual or Simulated Activity | Day | Date | Day | Date | Day | Date |
| Integration/Handover | 0 | 03/29 | 0 | 07/15 | 0 | 09/13 |
| Launch | 8 | 04/06 | 3 | 07/18 | 3 | 09/16 |
| Docking | 11 | 04/09 | 5 | 07/20 | 5 | 09/18 |
| Unpacking/stowage | 12 | 04/10 | 6 | 07/21 | 6 | 09/19 |
| Actuation | 14 | 04/12 | 7 | 07/22 | 7 | 09/20 |
| Transfer to −80°C (B. subtilis) | 15 | 04/13 | 8 | 07/23 | 8 | 09/21 |
| Transfer to −80°C (S. aureus) | 16 | 04/14 | 9 | 07/24 | 9 | 09/22 |
| Undocking and splashdown | 42 | 07/26 | ||||
| Arrival at KSC | 46 | 07/30 | ||||
| Deintegration | 20 | 04/18 | 54 | 09/07 | 21 | 10/04 |
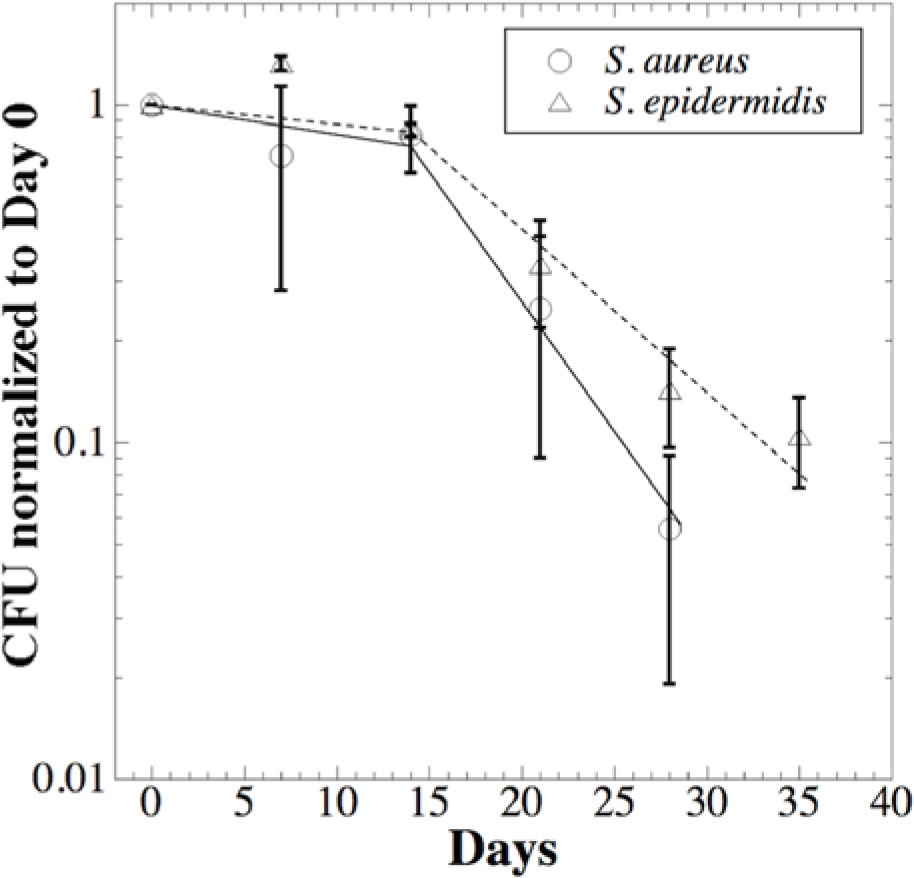
Figure 1
Survival of air-dried cells of S. aureus (circles) and S. epidermidis (triangles) as a function of time. Data points are averages ± standard deviations of duplicate samples.
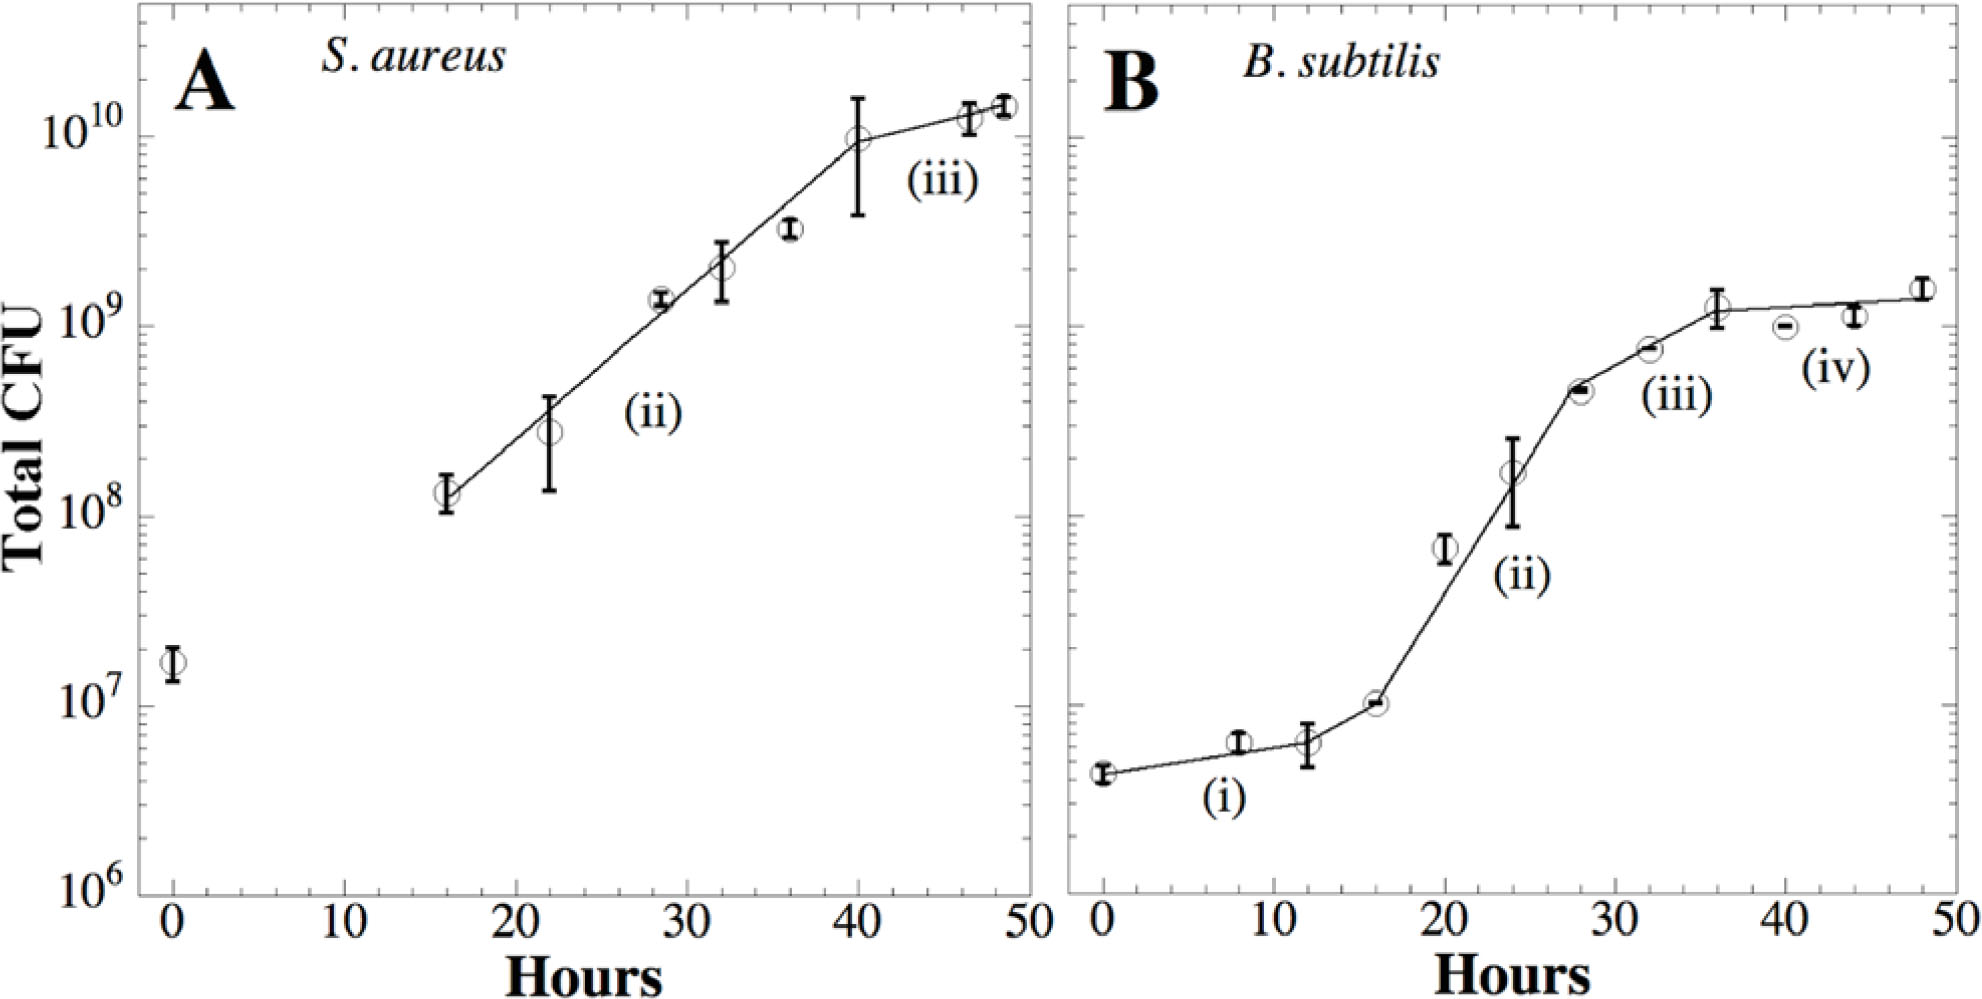
Figure 2
Pre-SVT growth curves of S. aureus (A) and B. subtilis (B) in 60 mm Petri plates. Data are averages + standard deviations of duplicate experiments. Growth phases are denoted: (i) lag, (ii) logarithmic, (iii) transition, and (iv) stationary. Data are plotted on the same scales for comparison.
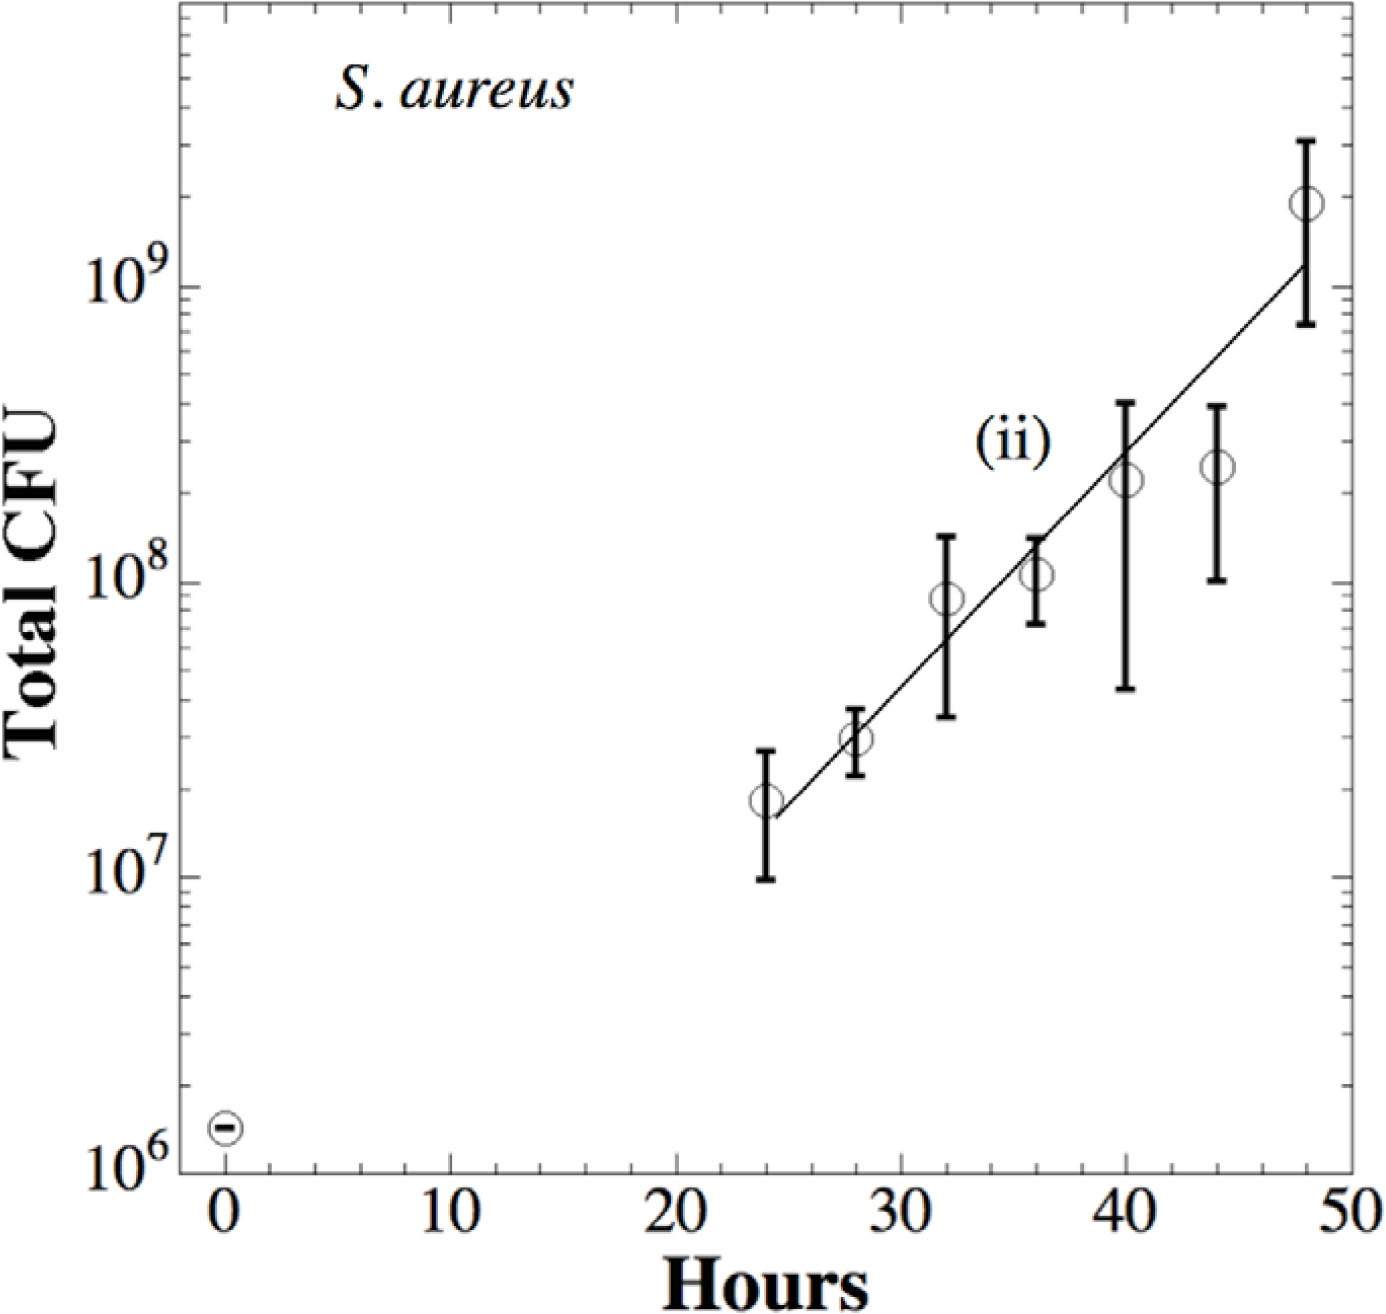
Figure 3
Growth of S. aureus cells in BRIC-PDFUs during SVT. Data are averages ± standard deviations of triplicate samples. Logarithmic (ii) phase is denoted. See text for details.
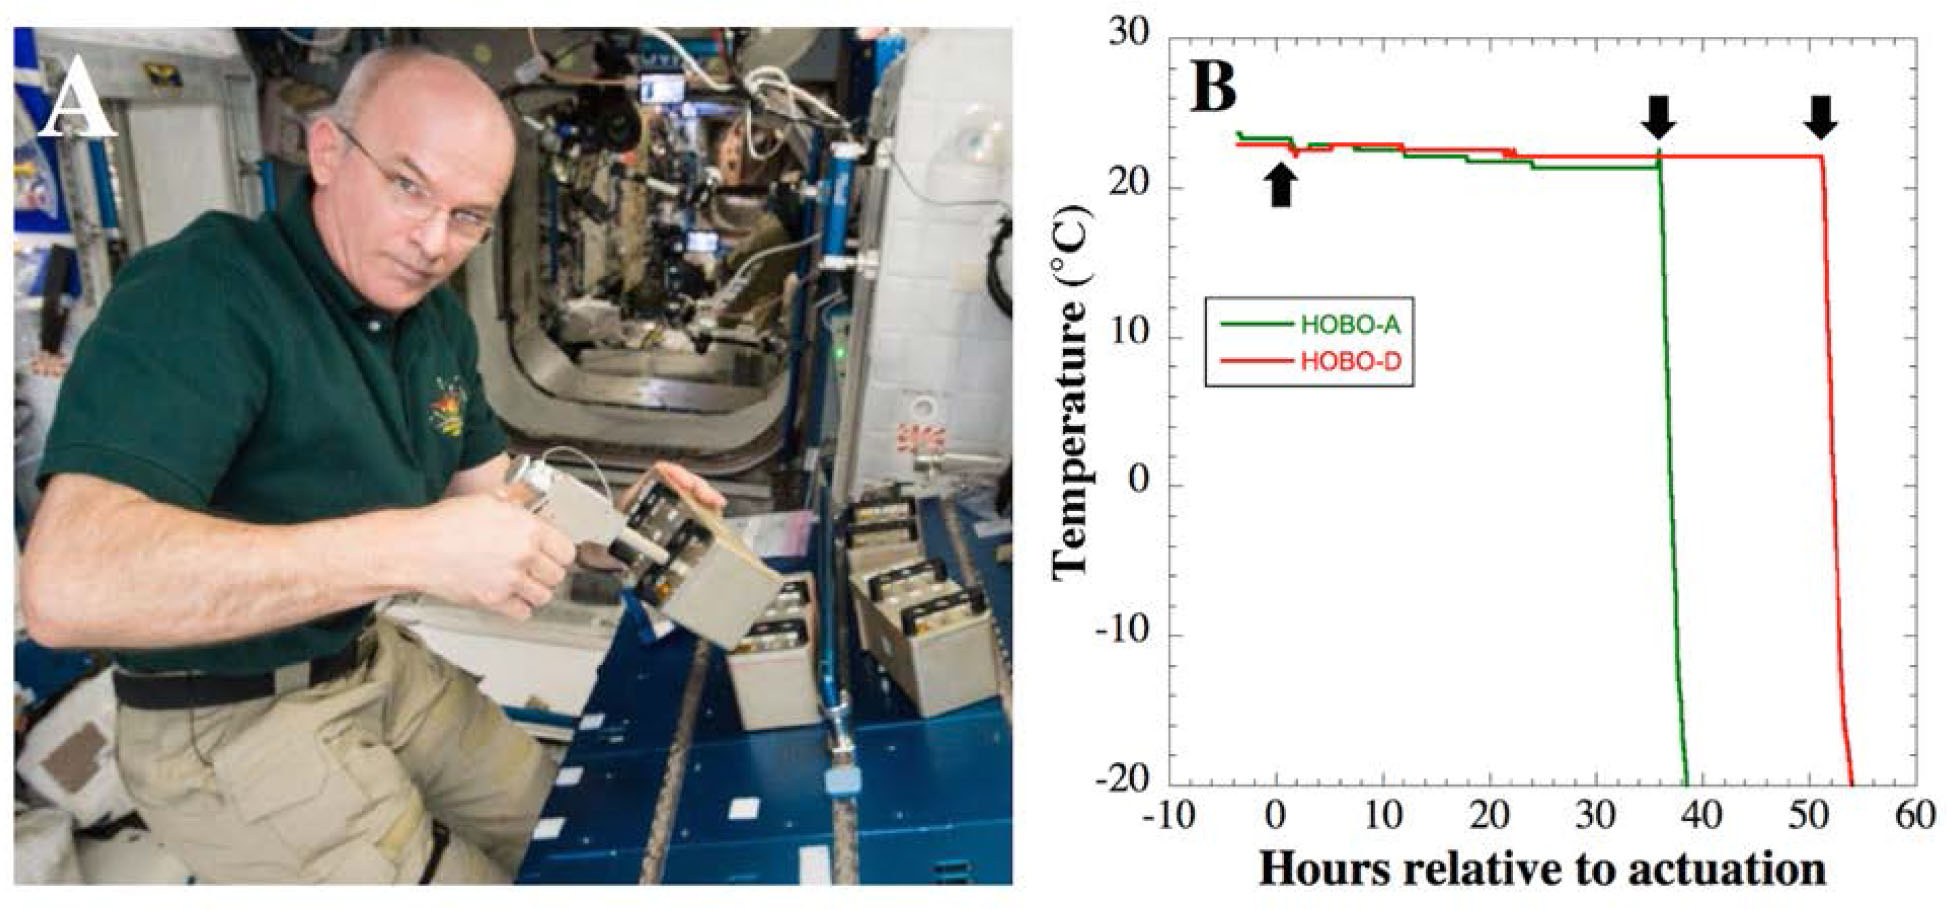
Figure 4
(A) Actuation of BRIC-23 canisters onboard the ISS by astronaut Jeffrey Williams. (B) Temperatures recorded during BRIC-23 flight for B. subtilis (HOBO-A, green line) and S. aureus (HOBO-D, red line). Time of actuation is denoted by upward arrow, and time of canister transfer to the onboard −80°C freezer is denoted by the downward arrows.