
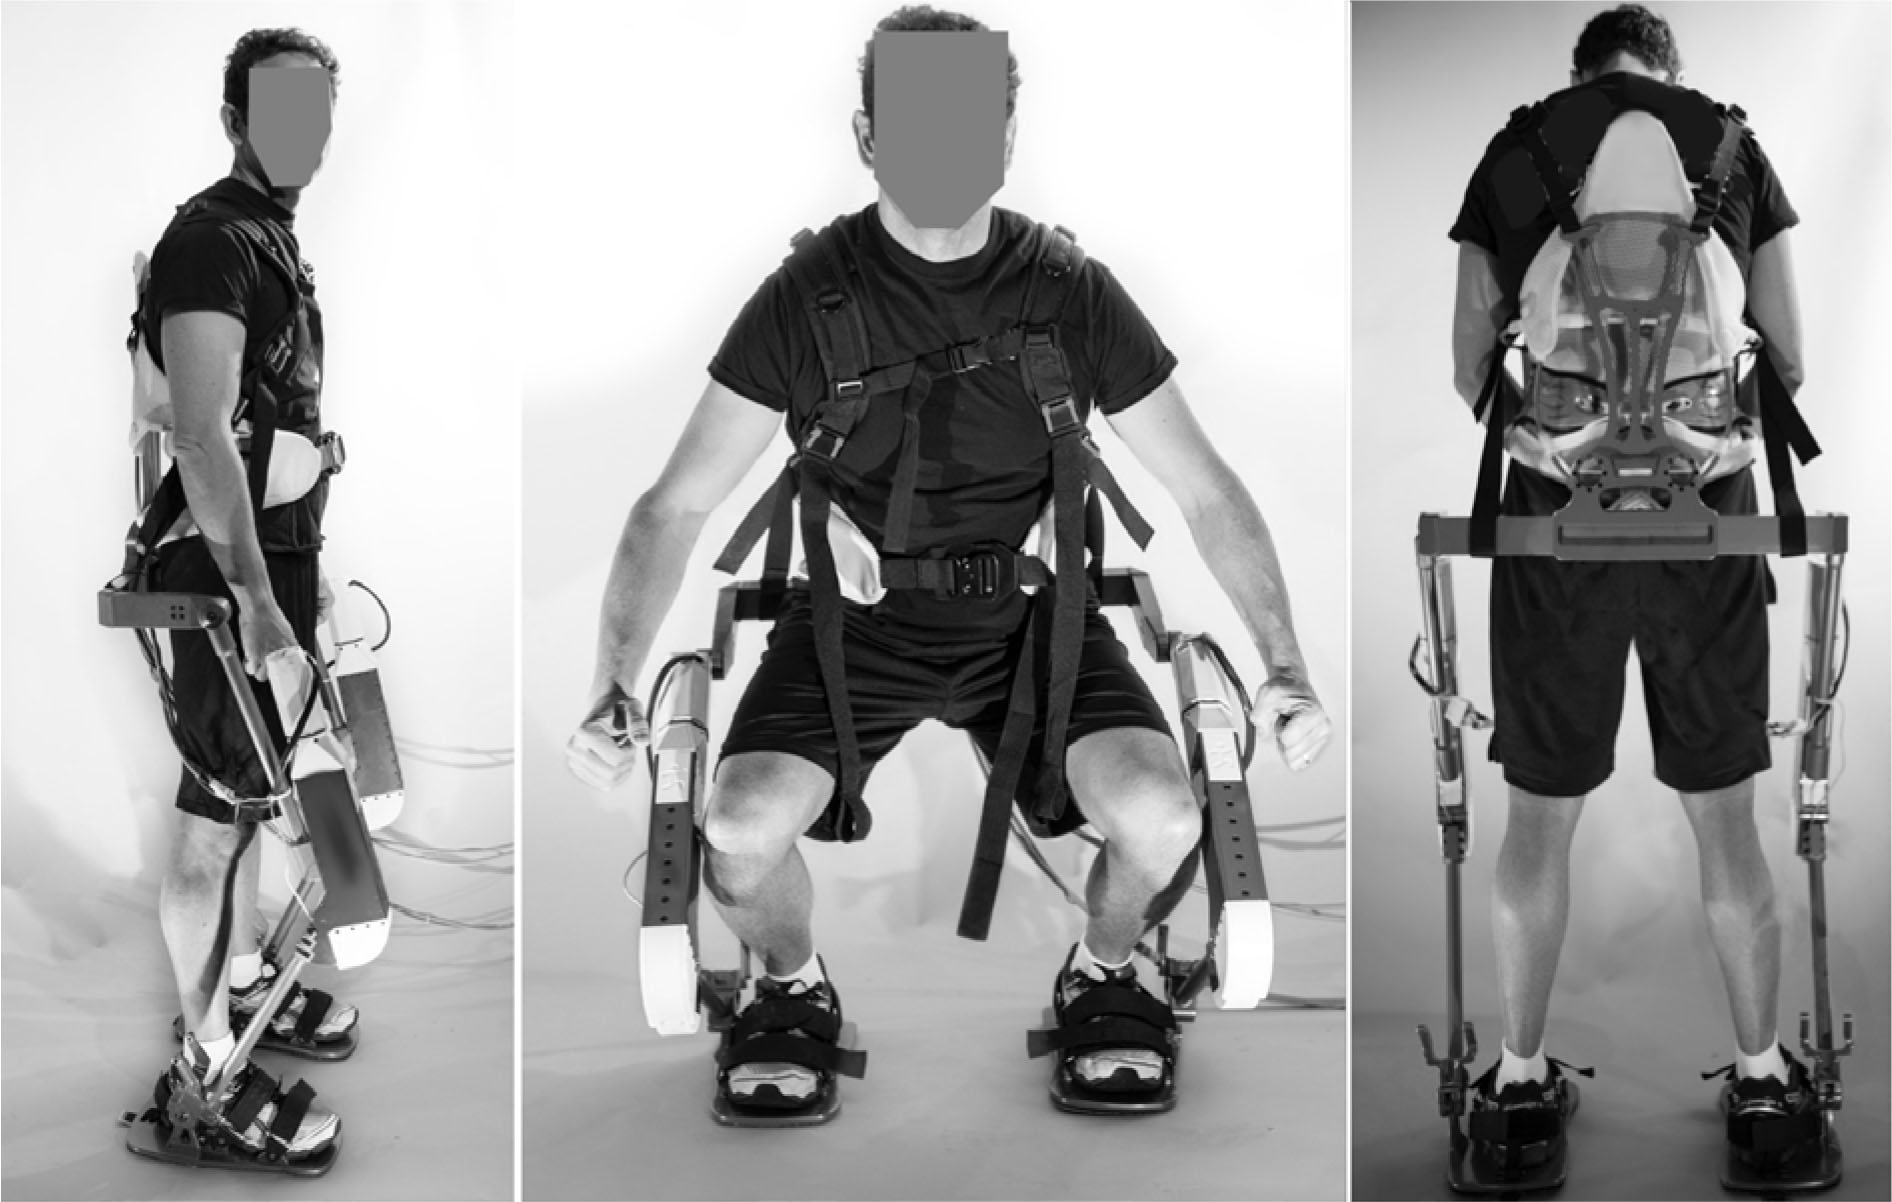
Figure 1
Side, front, and rearview images of the IHMC robotic exoskeleton. In a typical exercise configuration, it connects to the user's torso like a hiking backpack—over the shoulders and around the waist. In the linkages paralleling the user's legs are motorized, computer-controlled actuators. In operation, these actuators try to fold up, or collapse, putting a compressive load between the user's feet and torso. This force is similar to carrying a heavy backpack, or replicating a weightlifting squat exercise.
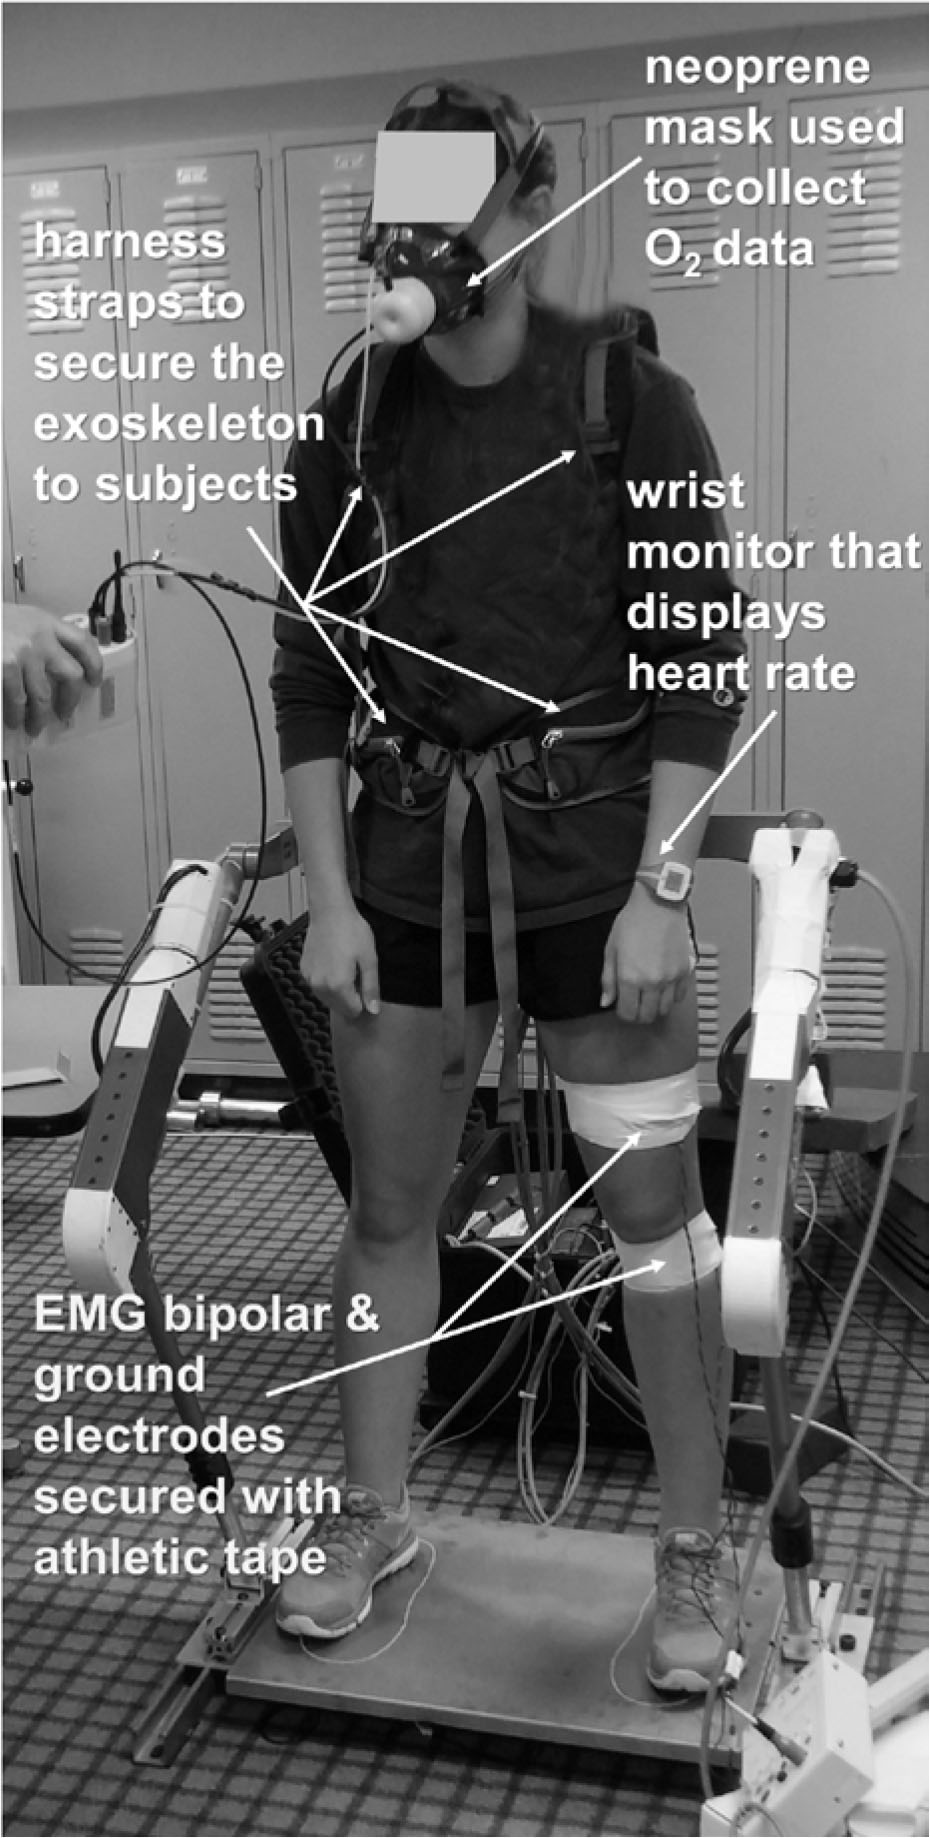
Figure 2
Subjects as they appeared at the start of exercise done on the exoskeleton. On the subject's left leg is an EMG electrode, over the nose and mouth is a mask for quantifying O2 consumption, and on the torso (not visible) is a heart rate monitor with receiver on the left wrist.
Table 1
Metabolic, heart rate (HR), and rate of perceived exertion (RPE) data from exoskeleton and free weight workouts. Sets 1–4 entailed heavier loads (22.5, 34, 45.5, and 57 kg, respectively) for each workout.
| Dependent variable (units) | Exoskeleton workout | Free weight workout | ||
|---|---|---|---|---|
| mean ± sd | range | mean ± sd | range | |
| pre-exercise [BLa−] (mmol · L−1) | 1.7 ± 0.8 | 0.8 – 3.7 | 1.8 ± 0.9 | 0.9 – 3.7 |
| post-exercise [BLa−] (mmol · L−1) | 2.4 ± 1.4 | 1.0 – 6.1 | 2.1 ± 1.0 | 1.0 – 3.9 |
| pre-exercise [C] (μg · dl−1) | 0.21 ± 0.08 | 0.10 – 0.37 | 0.22 ± 0.08 | 0.10 – 0.42 |
| post-exercise [C] (μg · dl−1) | 0.25 ± 0.11 | 0.10 – 0.45 | 0.21 ± 0.15 | 0.10 – 0.76 |
| peak O2 (ml · min−1) | 1144 ± 174 | 909 – 1457 | 1278 ± 173 | 947 – 1535 |
| pre-exercise HR (beats · min−1) | 65.1 ± 8.0 | 52 – 75 | 68.4 ± 9.7 | 46 – 80 |
| post-set 1 HR (beats · min−1) | 94.8 ± 14.0 | 75 – 126 | 104.9 ± 13.4 | 84 – 126 |
| post-set 2 HR (beats · min−1) | 101.1 ± 12.9 | 83 – 125 | 111.1 ± 16.3 | 80 – 134 |
| post-set 3 HR (beats · min−1) | 110.6 ± 18.2 | 83 – 151 | 117.2 ± 17.1 | 81 – 140 |
| post-set 4 HR (beats · min−1) | 107.4 ± 17.7 | 82 – 146 | 123.4 ± 20.0 | 89 – 153 |
| post-exercise HR (beats · min−1) | 78.6 ± 16.0 | 58 – 115 | 77.4 ± 14.2 | 51 – 109 |
| RPE | 6.3 ± 1.5 | 3 – 8 | 4.1 ± 1.5 | 2 – 7.5 |
Table 2
Accelerometry and EMG data from exoskeleton and free weight workouts. Sets 1–4 entailed heavier loads (22.5, 34, 45.5, and 57 kg, respectively) per workout.
| Dependent variable (units) | Exoskeleton workout | Free weight workout | ||
|---|---|---|---|---|
| mean ± sd | range | mean ± sd | range | |
| Peak force set 1 (newtons) | 283 ± 25 | 257 – 338 | 329 ± 55 | 213 – 440 |
| Peak velocity set 1 (cm · sec−1) | 71 ± 31 | 39 – 118 | 96 ± 13 | 81 – 122 |
| Peak power set 1 (watts) | 169 ± 78 | 85 – 317 | 247 ± 52 | 187 – 349 |
| Peak EMG set 1 (μV) | 521 ± 143 | 275 – 680 | 322 ± 101 | 170 – 500 |
| Peak force set 2 (newtons) | 443 ± 43 | 390 – 514 | 486 ± 122 | 201 – 663 |
| Peak velocity set 2 (cm · sec−1) | 69 ± 24 | 38 – 124 | 89 ± 27 | 53 – 140 |
| Peak power set 2 (watts) | 251 ± 99 | 129 – 476 | 322 ± 89 | 180 – 479 |
| Peak EMG set 2 (μV) | 413 ± 231 | 95 – 700 | 350 ± 238 | 110 – 810 |
| Peak force set 3 (newtons) | 618 ± 70 | 531 – 789 | 673 ± 151 | 358 – 879 |
| Peak velocity set 3 (cm · sec−1) | 413 ± 231 | 95 – 700 | 350 ± 238 | 110 – 810 |
| Peak power set 3 (watts) | 352 ± 153 | 135 – 576 | 394 ± 95 | 282 – 531 |
| Peak EMG set 3 (μV) | 616 ± 306 | 300 – 1100 | 511 ± 321 | 130 – 1100 |
| Peak force set 4 (newtons) | 761 ± 101 | 657 – 1060 | 752 ± 125 | 479 – 1030 |
| Peak velocity set 4 (cm · sec−1) | 77 ± 28 | 37 – 124 | 86 ± 30 | 30 – 124 |
| Peak power set 4 (watts) | 387 ± 111 | 220 – 591 | 526 ± 202 | 170 – 734 |
| Peak EMG set 4 (μV) | 645 ± 331 | 100 – 1005 | 550 ± 378 | 80 – 1270 |
Table 3
Metabolic, HR, and RPE results, whereby dependent variable values from the exoskeleton and free weight workouts were compared to note the degree of similarity. Included are the number of subjects (n) who provided paired values for analysis.
| Dependent variable | r | t-tests | Cohen's d | n |
|---|---|---|---|---|
| pre-exercise [BLa−] | 0.01 | 0.11 | 0.04 | 14 |
| post-exercise [BLa−] | 0.51 | 0.56 | 0.26 | 14 |
| pre-exercise [C] | 0.07 | 0.32 | 0.13 | 14 |
| post-exercise [C] | 0.24 | 0.80 | 0.30 | 14 |
| peak O2 | 0.14 | 1.94 | 0.73 | 14 |
| pre-exercise HR | 0.57 | 1.50 | 0.37 | 14 |
| post-set 1 HR | 0.61 | 3.10 | 0.70 | 14 |
| post-set 2 HR | 0.79 | 3.80* | 0.65 | 14 |
| post-set 3 HR | 0.55 | 1.50 | 0.38 | 14 |
| post-set 4 HR | 0.50 | 3.10 | 0.79 | 14 |
| post-exercise HR | 0.78 | 1.70 | 0.37 | 14 |
| RPE | 0.51 | 5.40* | 1.17 | 14 |
Table 4
Accelerometry and EMG results, whereby dependent variables from the exoskeleton and free weight workouts were compared to note the degree of similarity. Included are the number of subjects (n) who provided paired values for analysis.
| Dependent variable | r | t-tests | Cohen's d | n |
|---|---|---|---|---|
| Peak force set 1 | 0.44 | 2.20 | 0.95 | 14 |
| Peak velocity set 1 | 0.34 | 2.40 | 0.91 | 13 |
| Peak power set 1 | 0.01 | 2.40 | 1.02 | 11 |
| Peak EMG set 1 | 0.66 | 2.30 | 1.31 | 11 |
| Peak force set 2 | 0.01 | 1.00 | 0.47 | 14 |
| Peak velocity set 2 | 0.20 | 1.50 | 0.73 | 13 |
| Peak power set 2 | 0.73 | 2.70 | 0.71 | 11 |
| Peak EMG set 2 | 0.05 | 0.20 | 0.46 | 11 |
| Peak force set 3 | 0.55 | 0.90 | 0.47 | 14 |
| Peak velocity set 3 | 0.31 | 2.30 | 0.55 | 13 |
| Peak power set 3 | 0.46 | 0.00 | 0.32 | 13 |
| Peak EMG set 3 | 0.12 | 0.30 | 0.16 | 13 |
| Peak force set 4 | 0.50 | 0.30 | 0.08 | 14 |
| Peak velocity set 4 | 0.38 | 0.70 | 0.32 | 13 |
| Peak power set 4 | 0.01 | 1.44 | 0.82 | 13 |
| Peak EMG set 4 | 0.28 | 0.01 | 0.27 | 13 |