
Table 1
Socio-demographic data and characteristics of traumatic exposure of adolescents enrolled in the study
| Variable | M (SD)/ Median (IQR)/ n (%) | P value | |
|---|---|---|---|
| PTSD | Non-PTSD | ||
| Age (years) | 15.87 (0.77) | 15.86 (0.76) | > .05 |
| Female gender | 38 (48.1%) | 29 (41.4%) | > .05 |
| Time since trauma, months | 8.0 (6.0–9.0) | 8.0 (6.0–9.0) | > .05 |
| Number of traumatic events exposed | 3.0 (2.0–4.0) | 2.0 (1.0–3.0) | > .05 |
| Characteristics of war-exposure: | |||
| - bombardments | 27 (34.1%) | 20 (28.5%) | > .05 |
| - rifle fire | 30 (37.9%) | 24 (30.3%) | > .05 |
| - injured | 7 (8.8%) | 5 (7.1%) | > .05 |
| - parents injured | 17 (21.5%) | 12 (17.1%) | > .05 |
| - saw dead bodies | 48 (60.7%) | 36 (51.4%) | > .05 |
| - living in shelters | 52 (65.8%) | 45 (64.2%) | > .05 |
| - house damaged | 30 (37.9%) | 25 (35.7%) | > .05 |
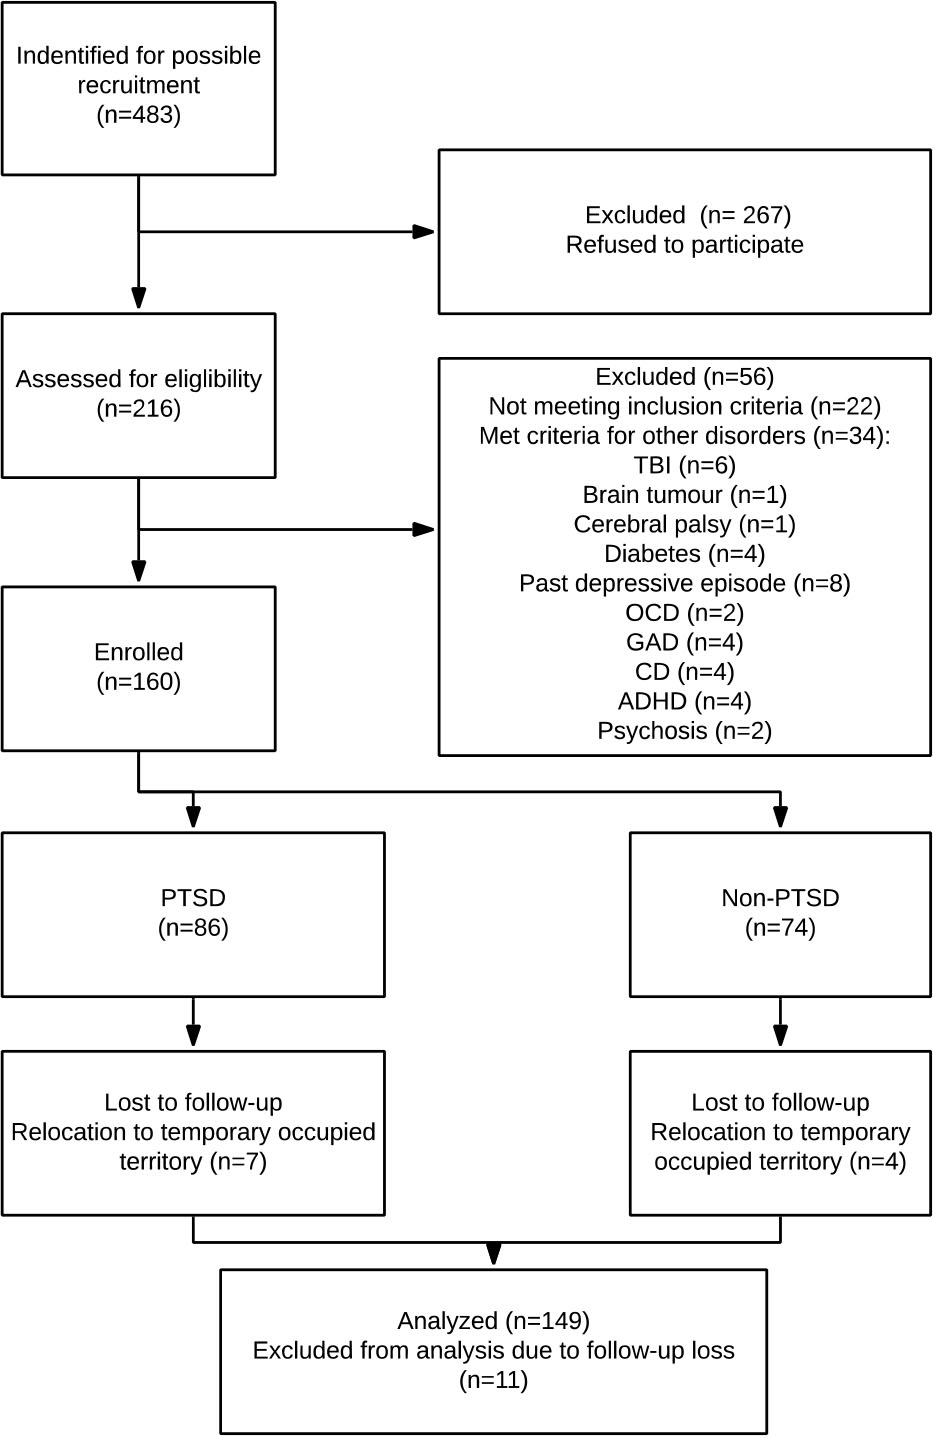
Figure 1
CONSORT diagram. TBI – traumatic brain injury; OCD – obsessive-compulsive disorder; GAD – generalized anxiety disorder; CD – conduct disorder; ADHD – attention deficit/hyperactivity disorder; PTSD – posttraumatic stress disorder.
Table 2
Description of mental health care provided in the community to adolescents with PTSD involved in the study
| Variable | % |
|---|---|
| Received TF-CBT | 32,9% |
| Received Fluoxetine | 20,25% |
| Being hospitalized | 6,3% |
| Received regular care | 46,8% |
[i] Note. TF-CBT = trauma-focused cognitive-behavioral therapy; regular care – receiving TF-CBT or Fluoxetine under regular supervision throughout the study.
Table 3
Characteristics of post-displacement traumatic exposure of adolescents at study endpoint (T2)
| Variable | M (SD)/ Median (IQR)/ n (%) | P value | |
|---|---|---|---|
| PTSD | Non-PTSD | ||
| Number of post-displacement traumatic events exposed | 0.0 (0.0–1.0) | 0.0 (0.0–1.0) | > .05 |
| Characteristics of post-displacement: | |||
| - bullying | 15 (18.9%) | 10 (14.2%) | > .05 |
| - loss of financial/social status | 18 (22.7%) | 13 (18.5%) | > .05 |
| - parents divorced | 7 (8.8%) | 4 (5.7%) | > .05 |
| - parent lost job | 11 (13.9%) | 8 (11.4%) | > .05 |
| - grandparent died | 1 (1.2%) | 1 (1.4%) | > .05 |
Table 4
Results of logistic regression predicting onset of depression in children exposed to war-related traumatic events
Table 5
Risk and protective factors for development of depression in adolescents with war-related PTSD
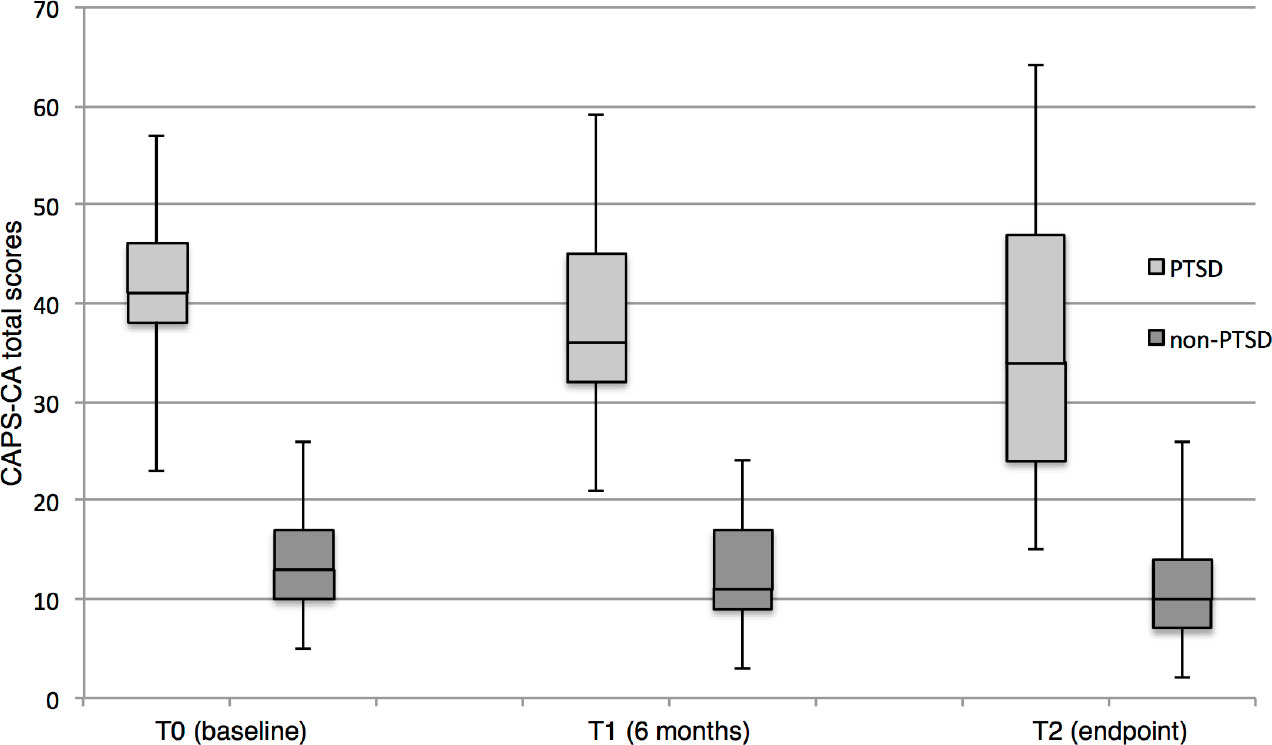
Figure 2
Changes in severity of PTSD on CAPS-CA in adolescents enrolled in the year long study
Note. PTSD –posttraumatic stress disorder; CAPS-CA - Clinician-administered ptsd scale child/adolescent version
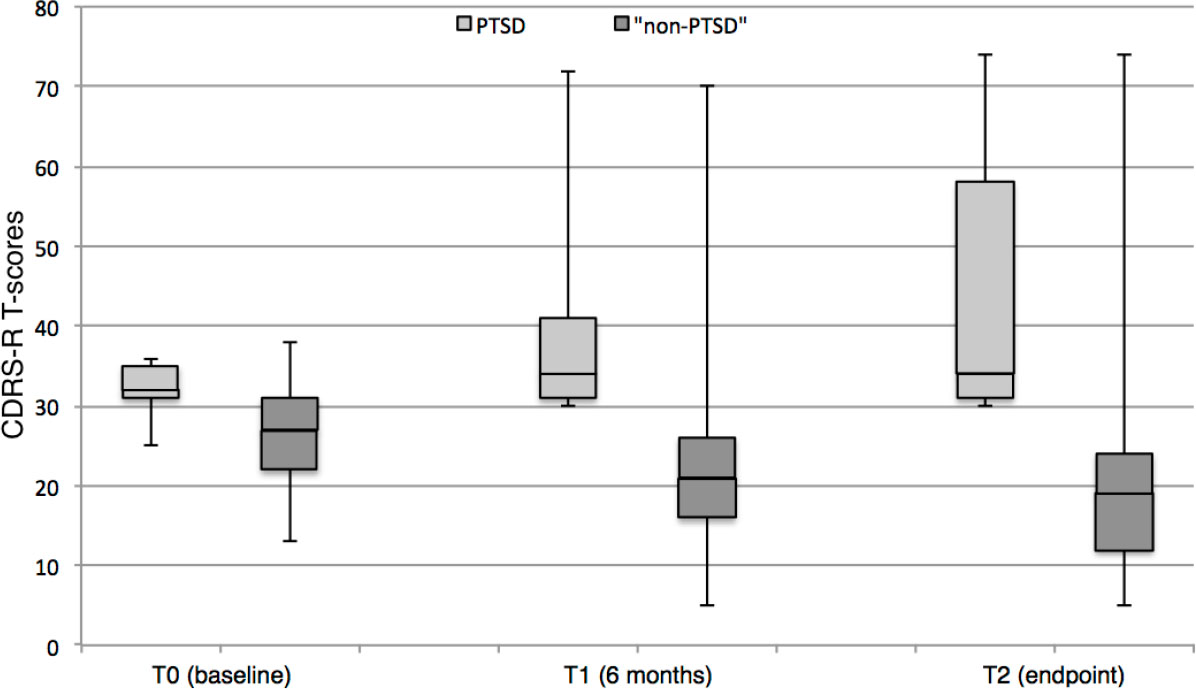
Figure 3
Changes in depression severity on CDRS-R in adolescents enrolled in the year long study
Note. CDRS-R - Children's depression rating scale-revised