
Figure 1
Descriptive statistics of all the three study samples: SHIP-2, SHIP-TREND-0 and GANI_MED_
| SHIP-2 (N = 1657) | SHIP-TREND-0 (N = 3278) | GANI_MED (N = 1742) | |
|---|---|---|---|
| Sex | |||
| females | 867 (52%) | 1651 (50%) | 717 (41%) |
| Age (mean ± sd) | 57 ± 13 (range: 31–93) | 51 ± 15 (range: 20–82) | 59 ± 48 (range: 19–92) |
| Smoking status | |||
| never | 639 (39.6%) | 1221 (37.3%) | 801 (46%) |
| ex | 688 (41.5%) | 1216 (37.1%) | 597 (34.3%) |
| current | 330 (19.9%) | 841 (25.7%) | 344 (19.8%) |
| BMI (mean ± sd) | 28.7 ± 4.7 (range: 19.7–49.4) | 28.4 ± 5.0 (range: 18.5–54.4) | 29.9 ± 5.2 (range: 18.9–59.1) |
| Depression score (mean | BDI-II | PHQ-9 | PHQ-9 |
| ± sd) | 6.1 ± 7 (range: 0-58) | 12.9 ± 3.6 (range: 9–35) | 15.0 ± 5.6 (range: 9–36) |
| CTQ sum score (mean ± sd) | 33.7 ± 9.4 (range: 25–119) | 33.1 ± 9.5 (range: 25–115) | 8.0 ± 3.0 (range: 5–25) |
| Emotional abuse | 6.2 ± 2.4 (range: 5–25) | 6.2 ± 2.4 (range: 5–25) | 1.3 ± 0.9 (range: 1–5) |
| 57.7% no emotional abuse | 60.7% no emotional abuse | 83.5% no emotional abuse | |
| Physical abuse | 5.8 ± 1.9 (range: 5–25) | 5.7 ± 1.9 (range: 5–25) | 1.4 ± 0.8 (range: 1–5) |
| 69.8% no physical abuse | 74.4% no physical abuse | 79.9% no physical abuse | |
| Sexual abuse | 5.2 ± 1.3 (range: 5–25) | 5.2 ± 1.3 (range: 5–25) | 1.1 ± 0.4 (range: 1–5) |
| 93,4% no sexual abuse | 94,7% no sexual abuse | 94,9% no sexual abuse | |
| Emotional neglect | 9.2 ± 4.4 (range: 5–25) | 9.0 ± 4.3 (range: 5–25) | 1.9 ± 1.1 (range: 1–5) |
| 23.1% no emotional neglect | 25.8% no emotional neglect | 44.6% no emotional neglect | |
| Physical neglect | 7.2 ± 2.5 (range: 5–25) | 7.0 ± 2.5 (range: 5–25) | 2.3 ± 1.3 (range: 1–5) |
| 37.9% no physical neglect | 41.1% no physical neglect | 39.6% no physical neglect | |
| Renal Insufficiency: 113 (6.49%) | |||
| Stroke: 254 (14.58%) | |||
| Metabolic Syndrome: | |||
| - Cardiology: 232 (13.32%) | |||
| Clinical cohorts | NA | NA | - Psychiatry: 163 (9.36%) |
| Fatty liver: 126 (7.23%) | |||
| Periodontal disease: 404 (23.19%) | |||
| Heart failure: 393 (22.56%) | |||
| COPD: 57 (3.27%) |
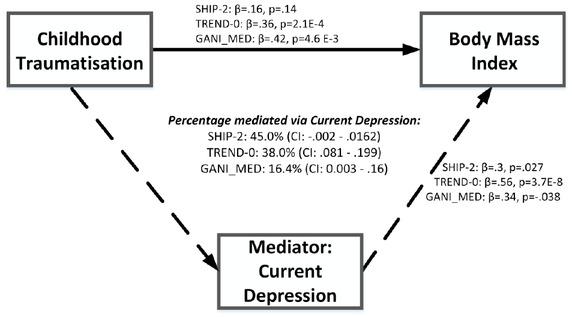
Associations between CTQ variables, depression scores (standardized coefficients) and BMI in SHIP-2, SHIP-TREND-0 and GANI_ MED_
| SHIP-2 (N=1657) | SHIP-TREND-0 (N=3278) | GANI_MED (N=1742) | |
|---|---|---|---|
| Direct effect of CTQ variables on BMI * | |||
| CTQ sum score | β = 0.16 ± 0.11, p = 0.14 | β = 0.36 ± 0.1, p < 0.001 | β = 0.42 ± 0.15, p = 0.005 |
| Emotional abuse score | β = 0.09 ± 0.12, p = 0.45 | β = 0.37 ± 0.11, p < 0.001 | β = 0.27 ± 0.16, p = 0.087 |
| Physical abuse score | β = 0.09 ± 0.12, p = 0.45 | β = 0.31 ± 0.11, p = 0.003 | β = 0.43 ± 0.16, p = 0.006 |
| Sexual abuse score | β = -0.07 ± 0.12, p = 0.56 | β = 0.06 ± 0.08, p = 0.45 | β = 0.30 ± 0.21, p = 0.15 |
| Emotional neglect score | β = 0.14 ± 0.11, p = 0.20 | β = 0.27 ± 0.09, p =0.003 | β = 0.37 ± 0.13, p = 0.005 |
| Physical neglect score | β = 0.26 ± 0.12, p = 0.028 | β = 0.31 ± 0.09, p = 0.001 | β = 0.10 ± 0.13, p = 0.42 |
| Direct effect of BDI-II / PHQ-9 on BMI* | |||
| BDI-II/PHQ-9 | β = 0.3 ± 0.14 ,p = 0.027 | β = 0.56 ± 0.1 , p < 0.001 | β = 0.34 ± 0.16, p = 0.038 |
| Mediation trough depression score* | |||
| Average mediated effect of | 0.079 (45%) | 0.137 (38%) | 0.08 (16.4%) |
| CTQ sum score by current depression | 95% CI = (-0.002, 0.162), p ≥ 0.05 | 95% CI = (0.081, 0.199), p < 0.05 | 95% CI = (0.003, 0.16), p < 0.05 |