
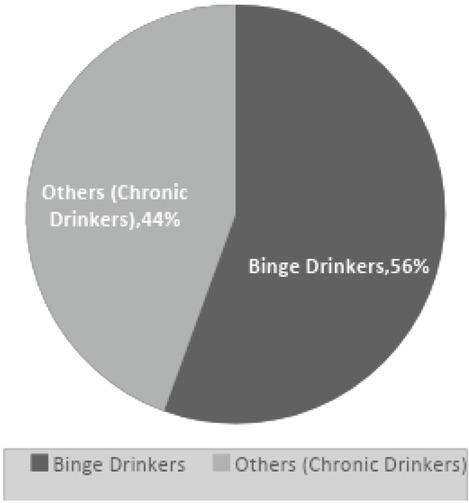
Figure 1
Characteristics of Binge Drinking among Participants
| Characteristic | Mean | Standard Deviation |
|---|---|---|
| Frequency | 2.17 | .834 |
| Quantity | 3.03 | .964 |
| Intensity | 2.53 | .507 |
Demographic Data for Participants
| Variable | Number of Participants | Percentage |
|---|---|---|
| Age (N = 30, Mean = 27.00, SD = 5.456) | ||
| 20–24 | 12 | 40% |
| 25–29 | 8 | 27% |
| 30–34 | 6 | 20% |
| ≥ 35 | 4 | 13% |
| 100% | ||
| Education Level Primary (1 ≤ 7 years of schooling) | 10 | 33.3% |
| Secondary (8 ≤ 12 years of schooling) | 13 | 43.3% |
| Tertiary (≥ 12 years of schooling) | 7 | 23.3% |
| 100% | ||
| Alcohol Drinking Days/week | 1 day | |
| Number of drinks/occasion | 6 drinks | |
| ≥Four drinks/occasion | Weekly |