
Table 1.
Details of the TCB samples (Contec; Fan et al., 2020).
| No. | Sample code | Surface area (m2/g) | Application |
|---|---|---|---|
| 1. | TCB-N330 | 76–80 | Medium-high reinforcement. Used as tread, carcass and sidewall compounds for tires and rubber goods. |
| 2. | TCB-N550 | 39–41 | Medium-high reinforcement. Used in inner liners, carcass and sidewalls for passenger tires and rubber goods. |
| 3. | TCB-N660 | 34–36 | Medium reinforcement. Used in inner liners, sidewalls, sealing rings, cable jackets, rubber moulding and extruded items. |
| 4. | TCB-N772 | 31–32 | Semi-reinforcement. Used as inner liners of tires and rubber goods. |
Table 2.
The 14C isotope concentrations are mentioned in pMC for the four different classification categories of TCB samples. δ13C obtained by IRMS (*) and from the AMS measurements (**). The results were corrected for isotope fractionation. The critical χ2 values for confidence level α = 0.01 and four measurements = 11.34, for three measurements = 9.21 and for confidence level α = 0.05 and four measurements = 7.81, for three measurements = 5.99. Bio-based carbon content was calculated according to (EN16640. 2017; CIO, 2022), 100 REF is used for the year 2022 (CIO, 2022).
| No. | Sample name | Lab code | Sample mass | Total Carbon (%) | δ13CVPDB (‰) | 14C conc. (pMC) | χ2 | Bio-based carbon content (%) |
|---|---|---|---|---|---|---|---|---|
| 1. | TCB-N330 | GdS-4543 | 6.08 g | - | −32.44 ± 0.11* | 0.589 ± 0.084 | 6.66 | 0.589 ± 0.084 |
| 2. | GdA-7138.1.1 | 1.81 mg | 99.75 ± 0.93 | −29.20** | 0.436 ± 0.033 | Without GdS-4543 | 0.436 ± 0.033 | |
| 3. | GdA-7138.1.2 | 0.99 mg | −30.60** | 0.410 ± 0.038 | 0.28 | 0.410 ± 0.038 | ||
| 4. | TCB-N550 | GdS-4552 | 4.02 g | - | −30.417 ± 0.072* | 0.189 ± 0.063 | 30.76 | 0.189 ± 0.063 |
| 5. | GdA-7137.1.2 | 0.98 mg | 97.5 ± 2.3 | −25.70** | 0.508 ± 0.033 | Without GdS-4552 | 0.508 ± 0.033 | |
| 6. | GdA-7137.1.3 | 2.05 mg | −28.80** | 0.500 ± 0.035 | 0.03 | 0.500 ± 0.035 | ||
| 7. | TCB-N660 | GdS-4554 | 3.91 g | - | −31.82 ± 0.44* | 0.908 ± 0.092 | 51.09 | 0.908 ± 0.092 |
| 8. | GdA-7139.1.1 | 2.19 mg | 98.1 ± 1.9 | −28.80** | 0.489 ± 0.033 | Without GdS-4554 | 0.489 ± 0.033 | |
| 9. | GdA-7139.1.2 | 1.90 mg | −36.60** | 0.350 ± 0.043 | 24.17 | 0.350 ± 0.043 | ||
| 10. | GdA-7139.1.5 | 1.09 mg | −29.30** | 0.600 ± 0.031 | 0.600 ± 0.031 | |||
| 11. | TCB-N772 | GdS-4555 | 3.89 g | - | −31.453 ± 0.020* | 0.124 ± 0.091 | 22.45 | 0.124 ± 0.091 |
| 12. | GdA-7140.1.2 | 2.03 mg | 98.9 ± 1.0 | −33.00** | 0.380 ± 0.043 | Without GdS-4555 | 0.380 ± 0.043 | |
| 13. | GdA-7140.1.3 | 2.03 mg | −32.90** | 0.350 ± 0.043 | 0.350 ± 0.043 | |||
| 14. | GdA-7140.1.4 | 1.01 mg | −28.90** | 0.470 ± 0.035 | 5.58 | 0.470 ± 0.035 |
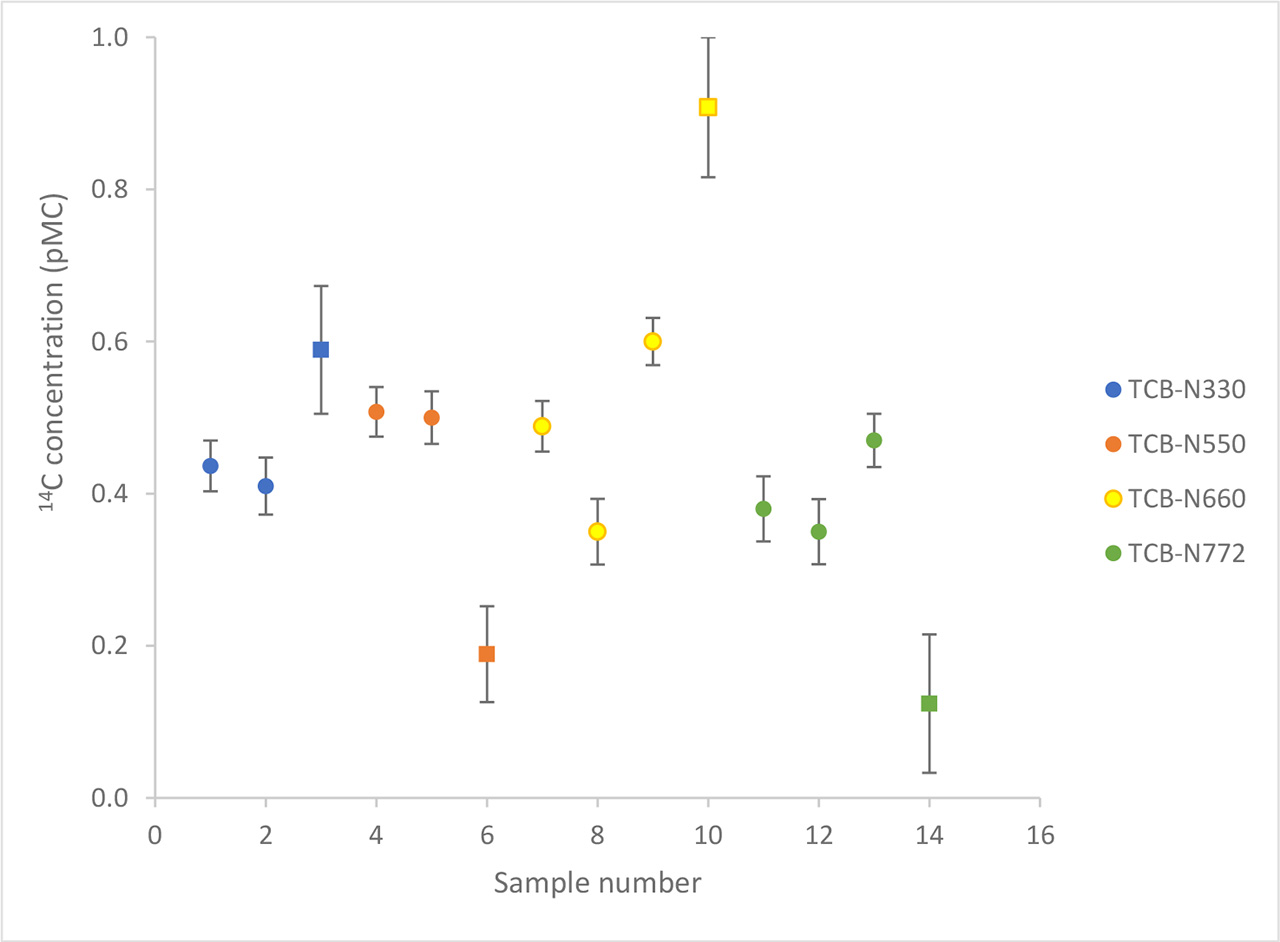
Fig 1.
Comparison between AMS and LSC 14C isotope measurements. ‘•’ AMS measurement results, ‘▪’ LSC measurement results.