
Table 1.
Subsequent decays of the uranium series from 226Ra to 210Pb.
| Parent isotope | Decay mode | Daughter isotope | Percentage of decay mode (%) | Half-life T1/2 | Weighted mean β− decay energy, keV | Q value (max energy), keV | Major decay branches (>0.5%) | ||
|---|---|---|---|---|---|---|---|---|---|
| Mean β−energy, keV | End-point energy, keV | Branching percentages (%) | |||||||
| 14C | β− | 14N | 100 | 5700(30) year | 49.47(10) | 156.475(4) | 49.47(10) | 156.475(4) | 100 |
| 226Ra | α | 222Rn | 100 | 1600(7) year | – | 4870.62(25) | 4601(1) | – | 6.16(3) |
| 4784.34(25) | 93.84(11) | ||||||||
| 222Rn | α | 218Po | 100 | 3.8222(9) day | – | 5590.4(3) | 5489.48(30) | – | 99.920(10) |
| 218Po | α | 214Pb | 99.980(2) | 3.097(12) min | – | 6114.75(9) | 6002.55(10) | – | 99.9789(20) |
| 218Po | β− | 218At | 0.020(2) | 3.097(12) min | – | 259(12) | – | – | – |
| 218At | α | 214Bi | 99.95(5) | 1.27(6) s | – | 6876.1(26) | 6654(5) | – | 6.90(10) |
| 6693(3) | 92.7(5) | ||||||||
| 218At | β− | 218Rn | 0.05(5) | 1.27(6) s | – | 2883(12) | – | – | – |
| 218Rn | α | 214Po | 100 | 33.75(15) ms | – | 7262.5(19) | 7129.1(19) | – | 99.870(4) |
| 214Pb | β− | 214Bi | 100 | 27.06(7) min | 224(5) | 1018(11) | 48.0(32) | 179(11) | 2.75(8) |
| 142.8(37) | 484(11) | 1.063(18) | |||||||
| 205.1(39) | 666(11) | 44.5(7) | |||||||
| 225.3(40) | 723(11) | 39.0(5) | |||||||
| 334.5(42) | 1018(11) | 12.7(9) | |||||||
| 214Bi | β− | 214Po | 99.9790(13) | 19.71(2) min | 641(6) | 3269(11) | 161.4(38) | 540(11) | 0.542(22) |
| 247.8(40) | 787(11) | 1.28(4) | |||||||
| 260.5(41) | 821(11) | 2.78(6) | |||||||
| 317.8(42) | 976(11) | 0.563(16) | |||||||
| 351.8(42) | 1065(11) | 5.56(5) | |||||||
| 356.1(43) | 1076(11) | 0.866(12) | |||||||
| 384.7(43) | 1150(11) | 4.33(4) | |||||||
| 424.2(44) | 1252(11) | 2.459(15) | |||||||
| 426.7(44) | 1258(11) | 1.433(11) | |||||||
| 433.1(44) | 1274(11) | 1.192(21) | |||||||
| 474.5(44) | 1379(11) | 1.589(17) | |||||||
| 491.6(44) | 1422(11) | 8.16(5) | |||||||
| 524.9(43) | 1504(11) | 16.90(11) | |||||||
| 539.0(45) | 1539(11) | 17.55(10) | |||||||
| 566.8(45) | 1608(11) | 0.57(5) | |||||||
| 614.9(46) | 1726(11) | 3.09(4) | |||||||
| 667.6(46) | 1854(11) | 0.90(5) | |||||||
| 683.3(46) | 1891(11) | 7.22(8) | |||||||
| 1007.1(47) | 2660(11) | 0.55(8) | |||||||
| 1268.4(48) | 3269(11) | 19.2(4) | |||||||
| 214Bi | α | 210Tl | 0.0210(13) | 19.9(4) min | – | 5621(3) | 5273(9) | – | 5.8(5) a |
| 5452(3) | 54(4) a | ||||||||
| 5516(3) | 39(3) a | ||||||||
| 214Po | α | 210Pb | 100 | 163.6(3) µs | – | 7833.46(6) | 7686.82(7) | – | 99.9895(6) |
| 210Tl | β− | 210Pb | 100 | 1.30(3) min | 1.18(16)∙103 | 5482(12) | 477(13) | 1380(30) | 2.0(10) |
| 568(14) | 1600(30) | 7.0(20) | |||||||
| 674(10) | 1860(24) | 24(5) | |||||||
| 743(11) | 2020(30) | 10(3) | |||||||
| 877.1(69) | 2413(17) | 10(3) | |||||||
| 1635(18) | 4210(40) | 30(6) | |||||||
| 1762.6(54) | 4386(12) | 20.0(20) | |||||||
| 210Pb | β− | 210Bi | 100 | 22.20(22) year | 6.1(6) | 63.5(5) | 4.16(13) | 17.0(5) | 84(3) |
| 16.16(13) | 63.5(5) | 16(3) | |||||||
| 210Pb | α | 206Hg | 1.9(3)∙10−6 | 22.20(22) year | – | 3792(20) | 3720(20) | – | – |
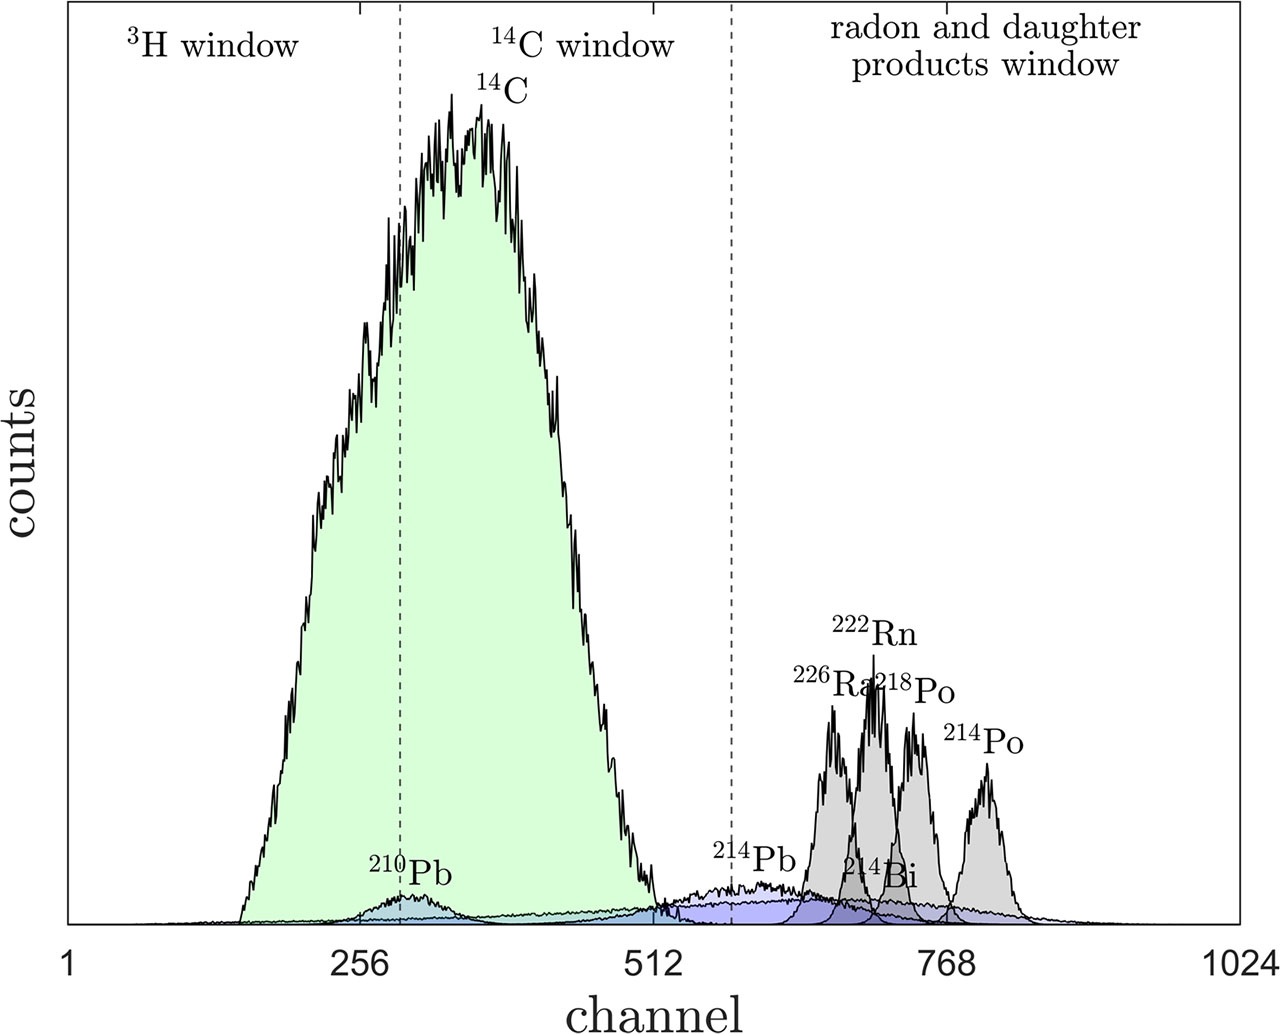
Fig 1.
Alpha and beta particle spectra of radioactive nuclides in a Quantulus 1220™ liquid scintillation counter with counting windows used at the Gliwice Laboratory (Poland). In most cases, peak from 210Pb would not be observed in radiocarbon dating due to its low probability.
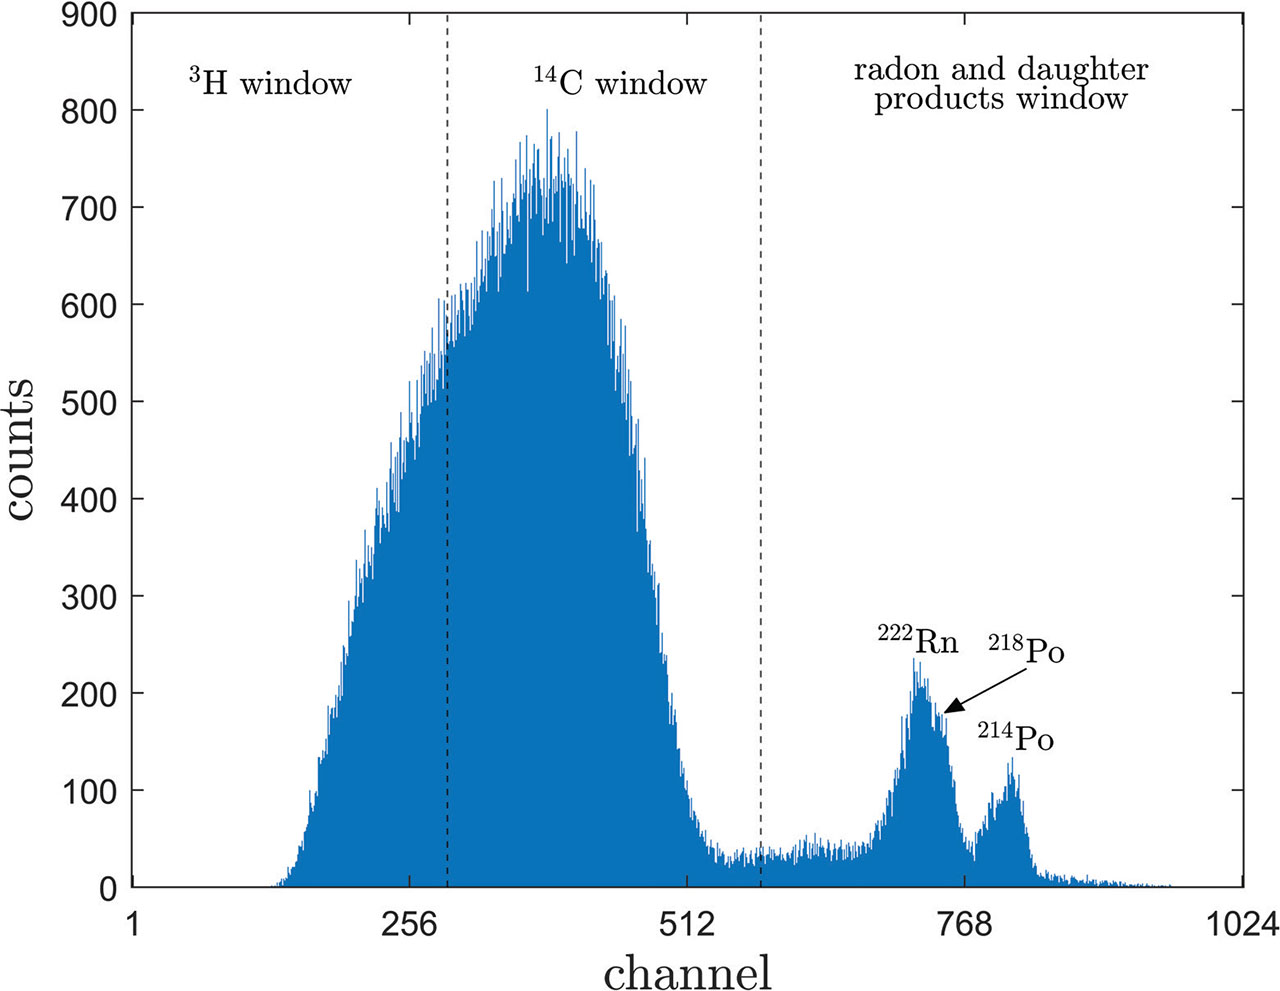
Fig 2.
Counts spectra for the GdS-4657 sample with counting windows used at the Gliwice Laboratory.
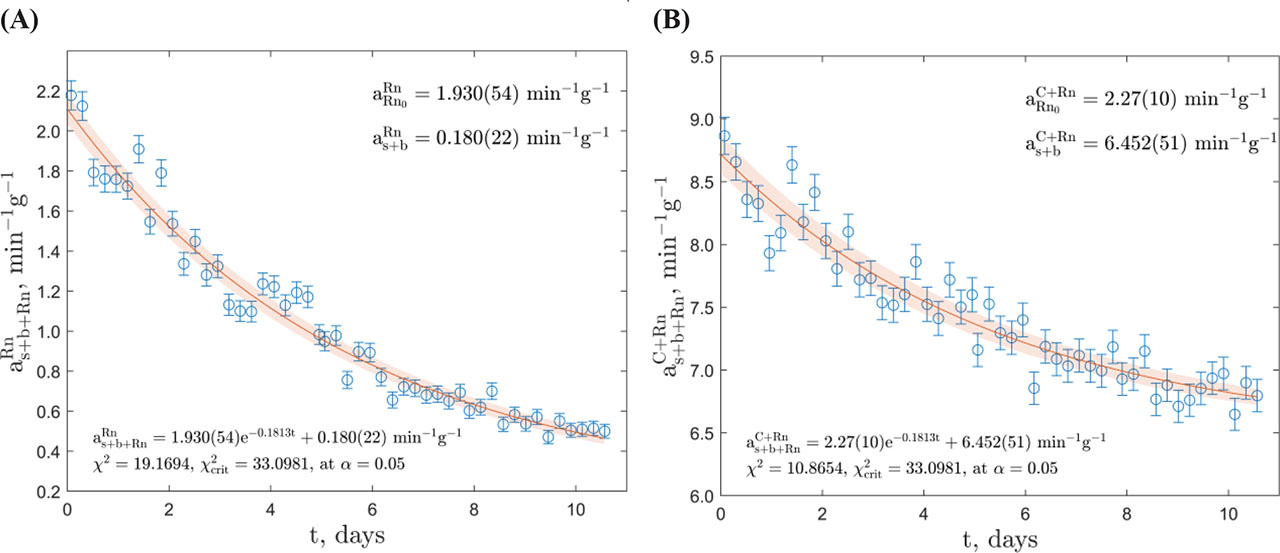
Fig 3.
Exponential function fitted into (A) – radon and daughter products window, (B) – combined 14C and radon and daughter products window. Fitted functions are shown with a 68.3% confidence band.
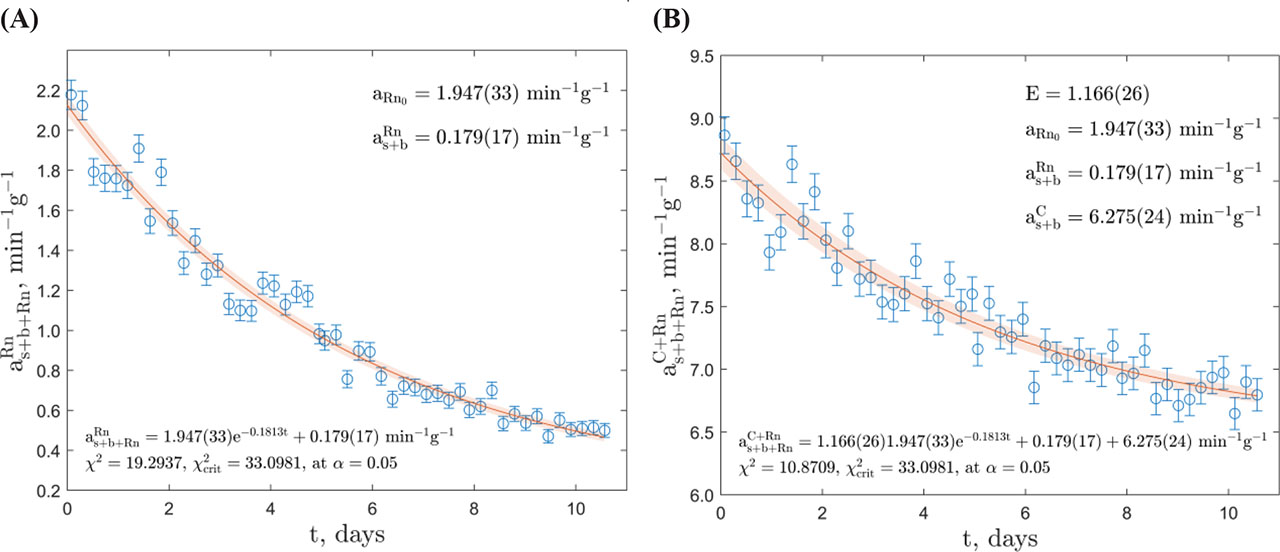
Fig 4.
The results of the solved system of equations for the GdS-4657 sample. (A) – Equation corresponding to the radon and daughter products window. (B) – Equation corresponding to the combined 14C and radon and daughter products window. The fitted functions for both equations are shown with a 68.3% confidence band.
Table 2.
The measurement results for sample without correction, with both methods of exponential corrections, and after aging process.
| Sample ID | SQP(E) | F14C | Radiocarbon age, 14C year | |
|---|---|---|---|---|
| GdS-4657 | 6.420(18) | 806.35(30) | 0.8318(45) | 1480(43) |
| Immediate, without correction | ||||
| GdS-4657 | 6.272(55) | 806.35(30) | 0.8120(79) | 1673(78) |
| Exponential correction | ||||
| Subtraction approach | ||||
| GdS-4657 | 6.275(24) | 806.35(30) | 0.8124(48) | 1669(48) |
| Exponential correction | ||||
| System of equations approach | ||||
| GdS-4684 | 6.345(31) | 809.89(44) | 0.8115(54) | 1678(53) |
| After aging process |
[i] SQP(E), sample quality parameter (external).
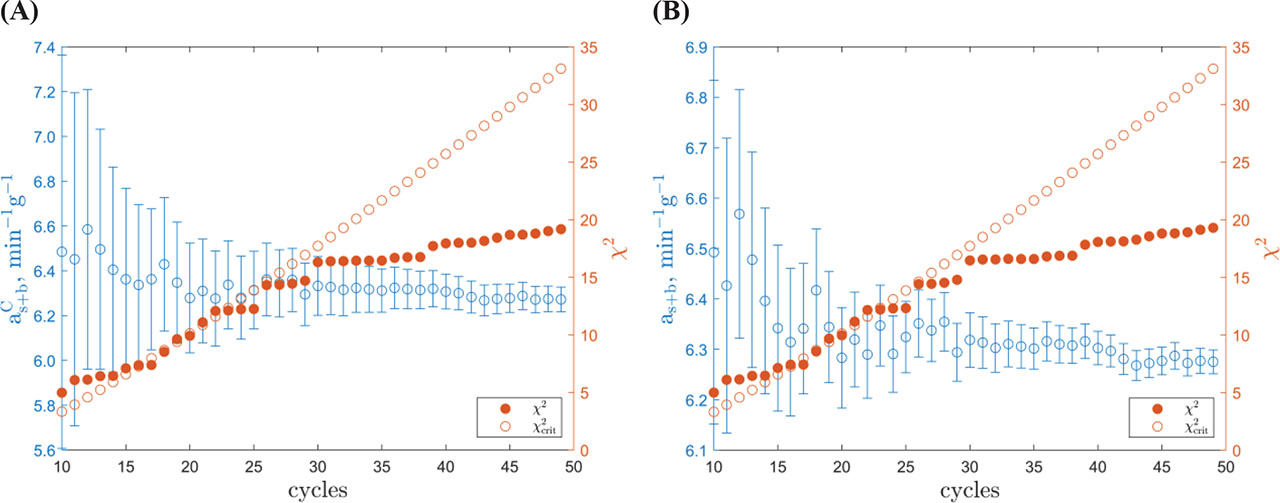
Fig 5.
Evolution of determined count rate, with a χ2 value versus at α = 0.05. Each data point represents a hypothetical scenario where measurements were terminated after a specific cycle, starting from the 10th cycle for the first point, the 11th cycle for the second point, the 12th cycle for the third point, and so on. (A) – Subtraction approach. (B) – System of equations approach.