
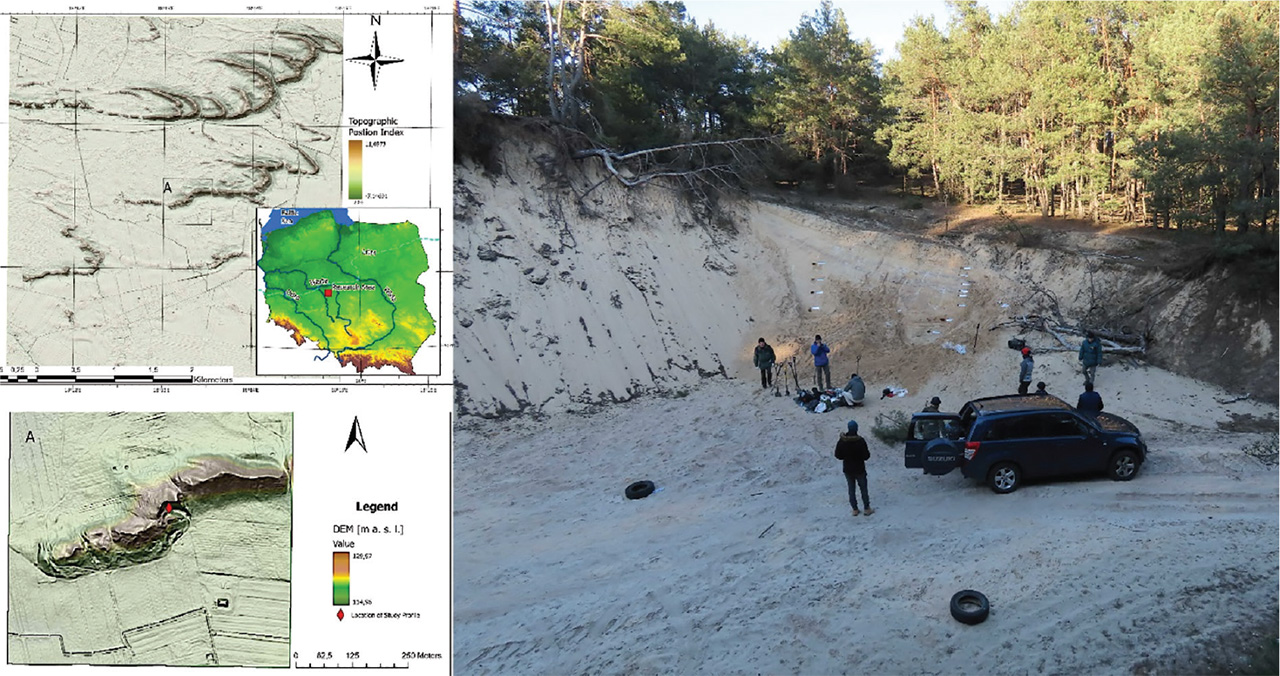
Fig 1.
Location map of Korzeniew site based on DEM (source: www.geoportal.gov.pl) with the aerial view of the investigated profile. DEM, digital elevation model.
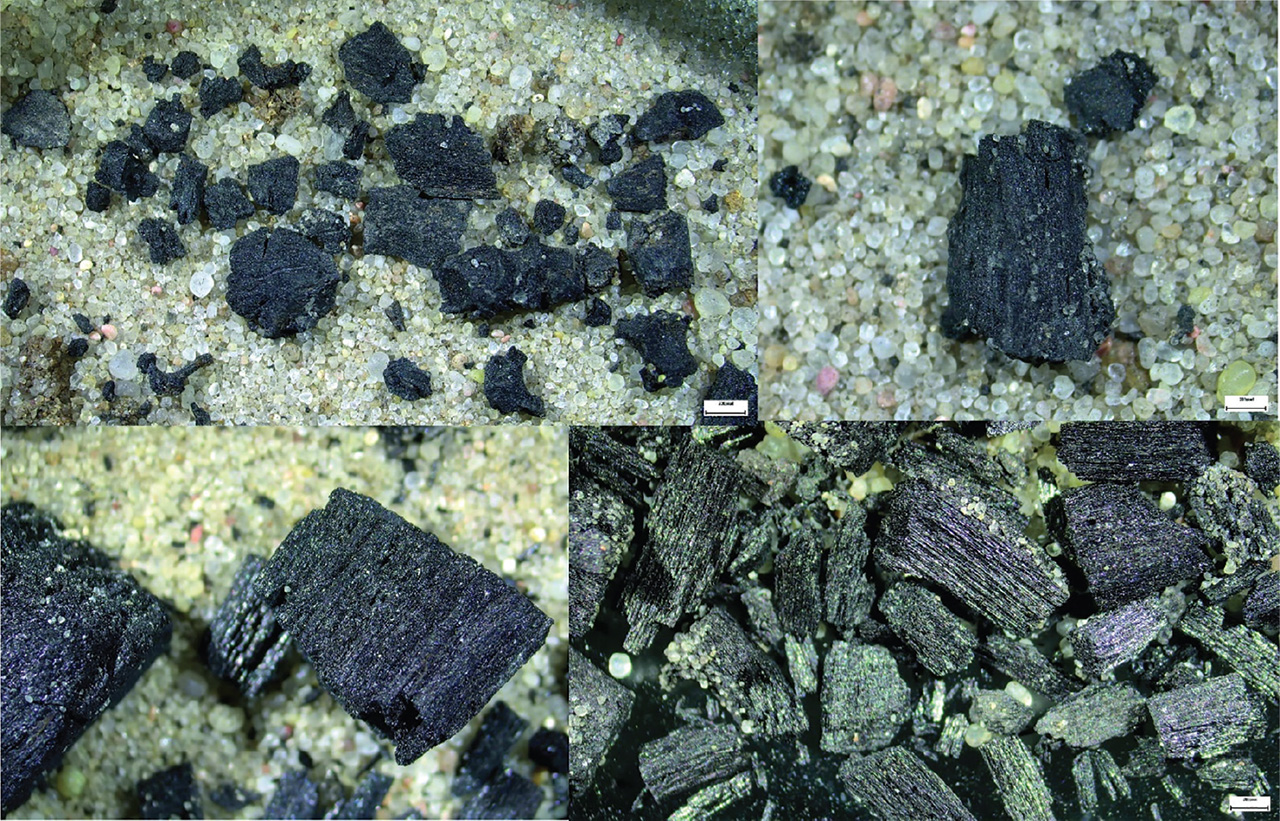
Fig 2.
Samples of pine charcoals separated for radiocarbon dating.
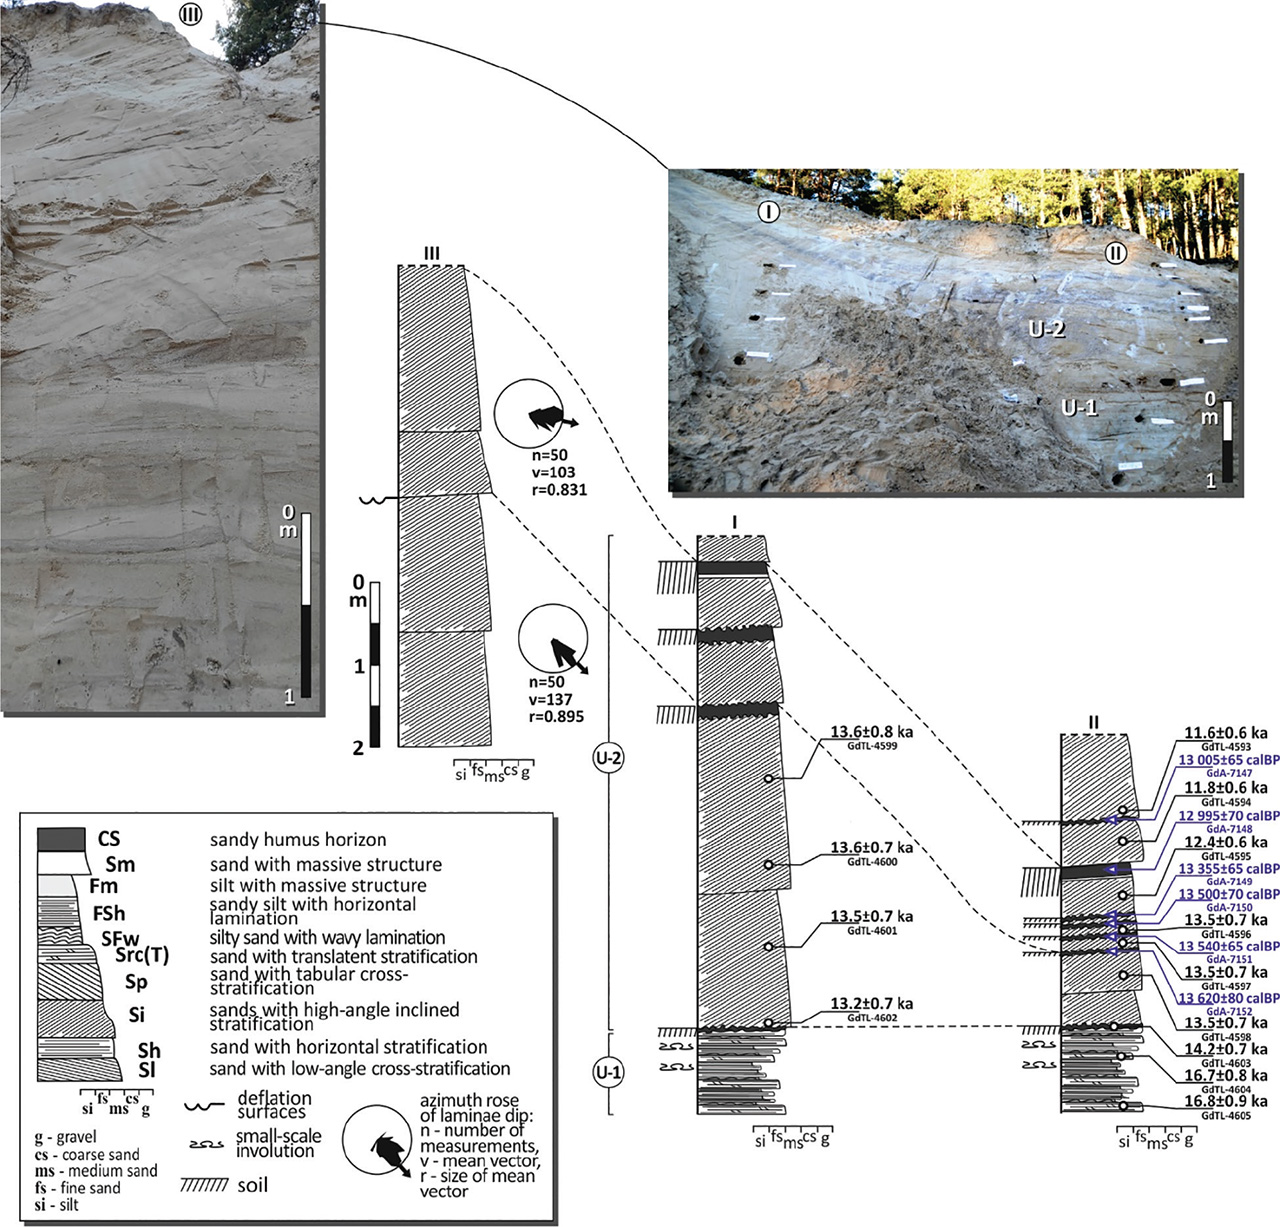
Fig 3.
Results of lithofacial analysis and 14C/OSL dating results in the Korzeniew site. CS, coarse sand; OSL, optically stimulated luminescence.
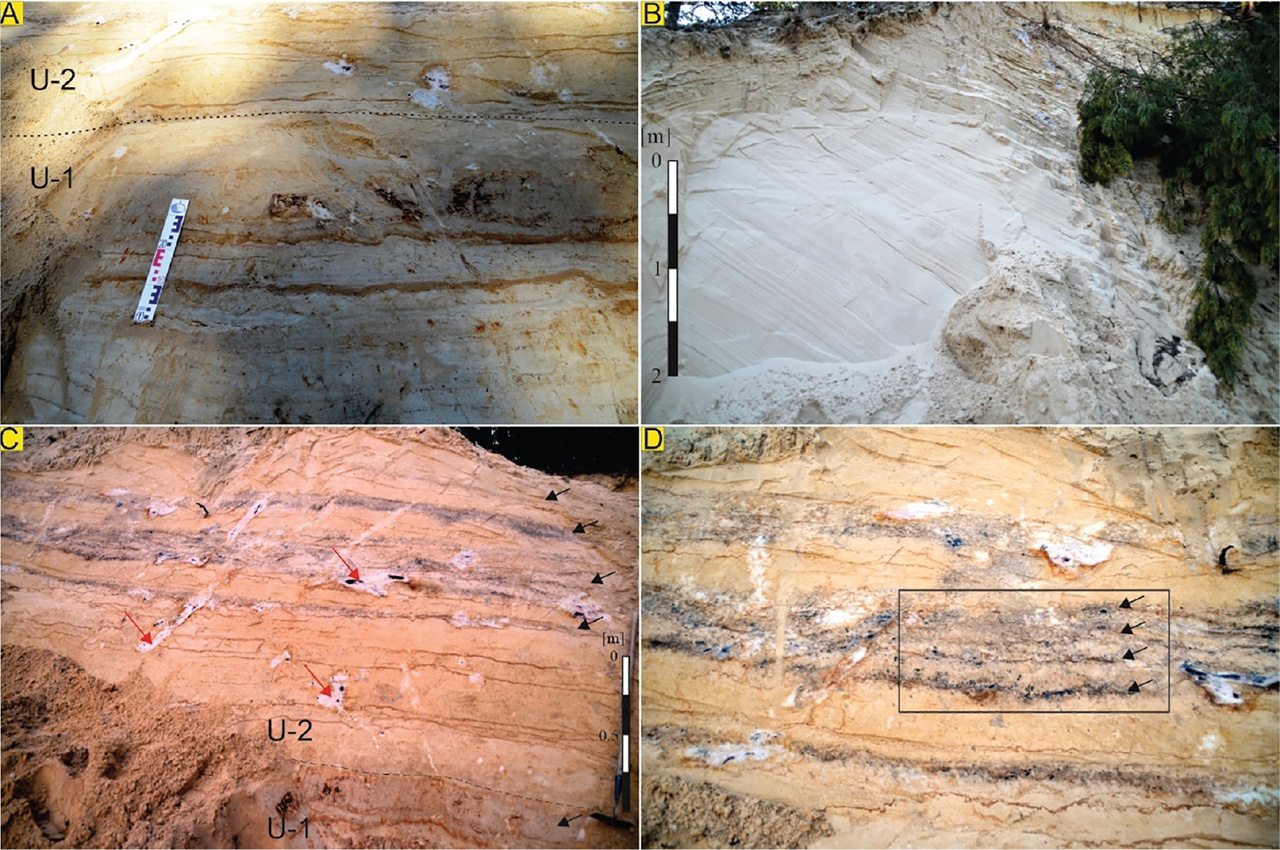
Fig 4.
(A) – Sandy–silty rhytmite with horizontal and wave lamination of the unit 1; (B) – inclined cross-stratification (Si) of the dune foreset (U-2) in the central part of the dune complex; (C) – Distal slope of the dune foreset with palaeosols (black arrows) and remnants after present-day root structures (red arrows); (D) – the composite palaeosol complex with four layers of charcoals (black arrows). Notice finger-like structure of the palaeosol below.
Table 1.
Radiocarbon dating results before and after calibration.
| Nr. | Korzeniew | Laboratory No. | Sampling depth (cm) | Age conventional 14C (BP) | Age calibrated 14C (BP) Prob. 68.2% | Age cal 14C (BP) Prob. 95.4% | Age calibrated 14C (BP) median |
|---|---|---|---|---|---|---|---|
| 1 | KOR_01 | GdA-7147.1.1 | 120 | 11,090 ± 55 | 13,095–12,930 | 13,105–12,840 | 13,005 ± 65 |
| 2 | KOR_02 | GdA-7148.1.1 | 200 | 11,070 ± 55 | 13,085–12,925 | 13,100–12,840 | 12,995 ± 70 |
| 3 | KOR_03 | GdA-7149.1.1 | 225 | 11,475 ± 60 | 13,435–13,300 | 13,475–13,185 | 13,355 ± 65 |
| 4 | KOR_04 | GdA-7150.1.1 | 250 | 11,640 ± 60 | 13,590–13,445 | 13,605–13,350 | 13,500 ± 70 |
| 5 | KOR_05 | GdA-7151.1.1 | 270 | 11,680 ± 55 | 13,595–13,480 | 13,745–13,415 | 13,540 ± 65 |
| 6 | KOR_06 | GdA-7152.1.1 | 310 | 11,760 ± 55 | 13,745–13,510 | 13,760–13,500 | 13,620 ± 80 |
Table 2.
All-important data for investigated luminescence samples: code, depth, radionuclide concentration, dose rate, equivalent dose (CAM model) and final age.
| Lab. Code | Sample ID | Sampling depth (cm) | U (Bq/kg) | Th (Bq/kg) | K (Bq/kg) | Dose rate (Gy/ka) | Equivalent dose (Gy) | OSL age (ka) |
|---|---|---|---|---|---|---|---|---|
| GdTL-4593 | KOR_1 | 75 | 3.5 ± 0.2 | 3.5 ± 0.3 | 145 ± 11 | 0.81 ± 0.04 | 9.4 ± 0.2 | 11.6 ± 0.6 |
| GdTL-4594 | KOR_2 | 125 | 4.5 ± 0.2 | 4.0 ± 0.4 | 172 ± 13 | 0.91 ± 0.04 | 10.7 ± 0.2 | 11.8 ± 0.6 |
| GdTL-4595 | KOR_3 | 190 | 3.7 ± 0.2 | 3.2 ± 0.3 | 167 ± 13 | 0.85 ± 0.04 | 10.5 ± 0.2 | 12.4 ± 0.6 |
| GdTL-4596 | KOR_4 | 225 | 3.1 ± 0.2 | 2.9 ± 0.3 | 174 ± 13 | 0.85 ± 0.04 | 11.4 ± 0.2 | 13.5 ± 0.7 |
| GdTL-4597 | KOR_5 | 260 | 5.2 ± 0.2 | 4.0 ± 0.3 | 183 ± 14 | 0.92 ± 0.05 | 12.4 ± 0.2 | 13.5 ± 0.7 |
| GdTL-4598 | KOR_6 | 300 | 4.9 ± 0.2 | 4.1 ± 0.3 | 183 ± 14 | 0.91 ± 0.04 | 12.2 ± 0.4 | 13.5 ± 0.7 |
| GdTL-4599 | KOR_7 | 300 | 2.8 ± 0.2 | 2.7 ± 0.3 | 148 ± 12 | 0.75 ± 0.04 | 10.1 ± 0.3 | 13.6 ± 0.8 |
| GdTL-4600 | KOR_8 | 400 | 3.3 ± 0.2 | 3.1 ± 0.3 | 167 ± 13 | 0.80 ± 0.04 | 10.8 ± 0.3 | 13.6 ± 0.7 |
| GdTL-4601 | KOR_9 | 500 | 4.9 ± 0.2 | 3.7 ± 0.3 | 175 ± 14 | 0.85 ± 0.04 | 11.4 ± 0.3 | 13.5 ± 0.7 |
| GdTL-4602 | KOR_10 | 575 | 8.8 ± 0.3 | 6.2 ± 0.4 | 249 ± 19 | 1.07 ± 0.05 | 14.1 ± 0.4 | 13.2 ± 0.7 |
| GdTL-4603 | KOR_11 | 600 | 7.4 ± 0.3 | 6.0 ± 0.3 | 241 ± 18 | 1.02 ± 0.05 | 14.4 ± 0.5 | 14.2 ± 0.7 |
| GdTL-4604 | KOR_12 | 630 | 3.9 ± 0.2 | 3.6 ± 0.3 | 154 ± 12 | 0.75 ± 0.04 | 12.3 ± 0.2 | 16.5 ± 0.8 |
| GdTL-4605 | KOR_13 | 660 | 4.2 ± 0.2 | 3.3 ± 0.3 | 152 ± 12 | 0.74 ± 0.04 | 12.3 ± 0.2 | 16.7 ± 0.9 |
[i] CAM, Central Age Model; OSL, optically stimulated luminescence.
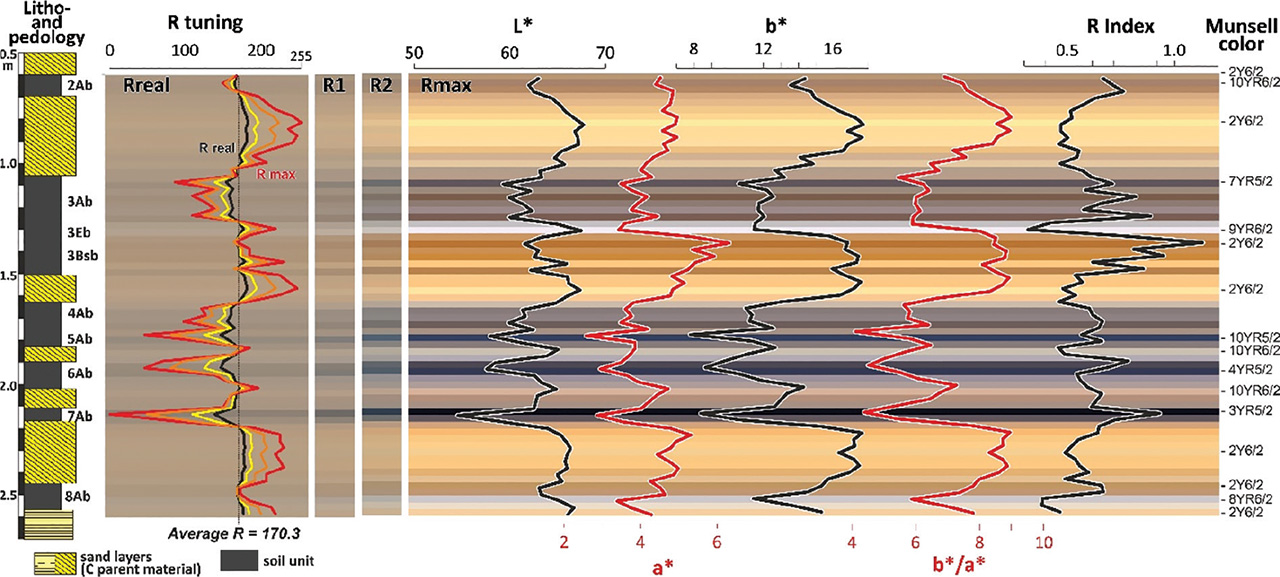
Fig 5.
Spectrophotometric characteristic of the sand–palaeosol sequence in the Korzeniew site.
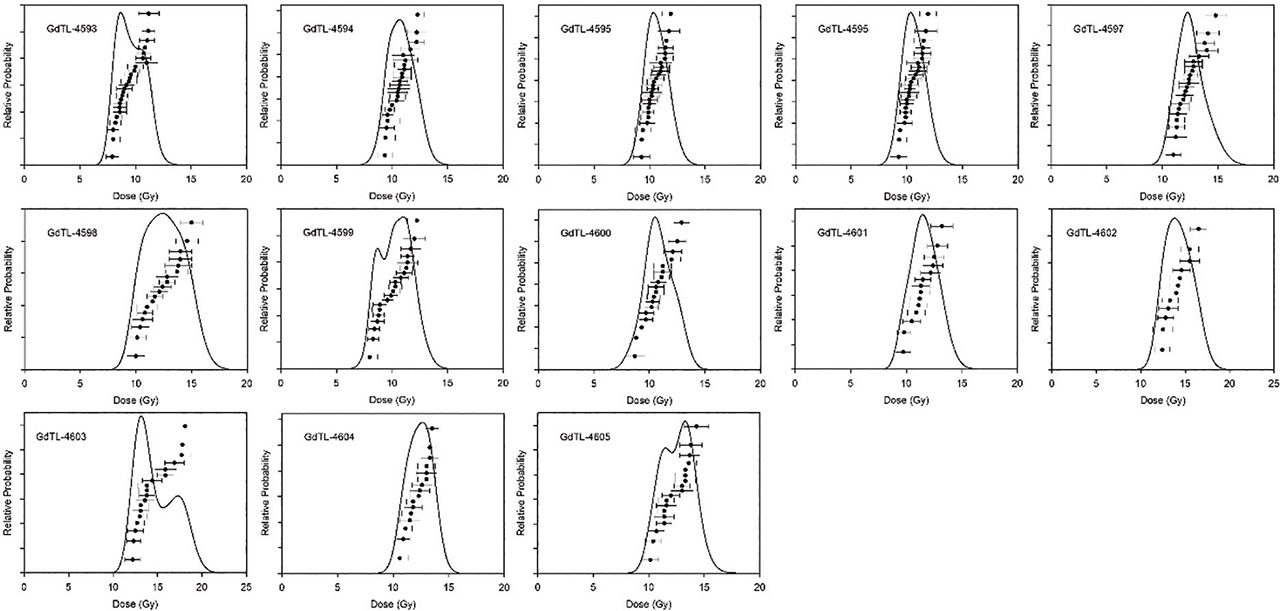
Fig 6.
Dose distributions for all investigated samples.
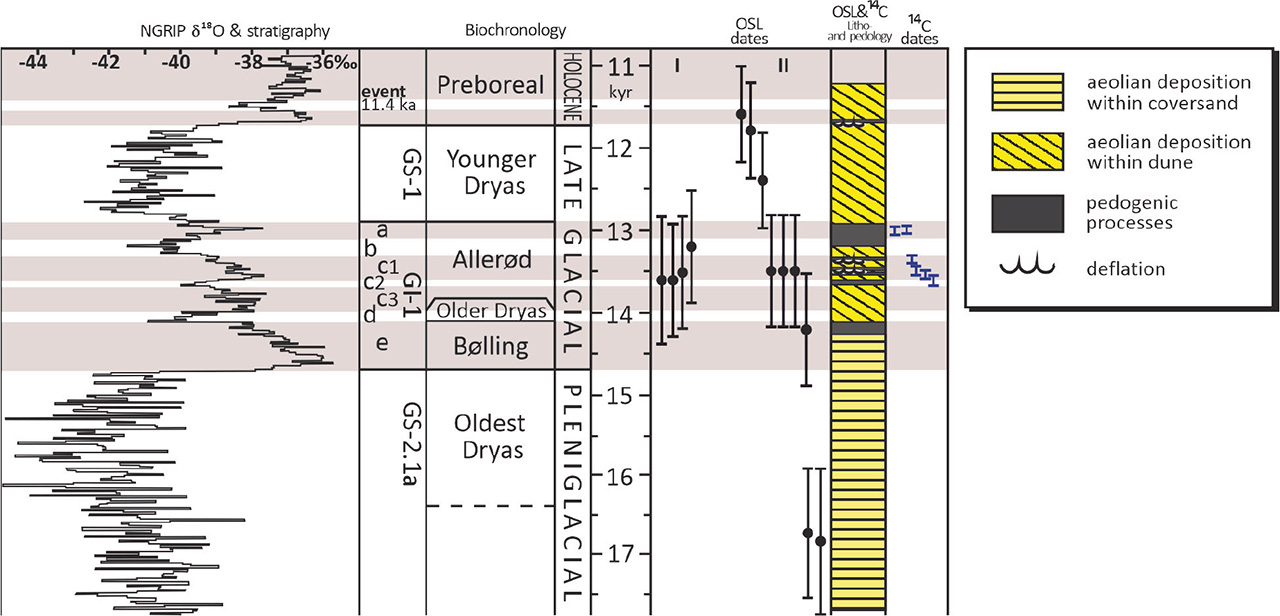
Fig 7.
Age model of depositional and soil processes in the Korzeniew site. 18O/16O ratio after Rasmussen et al. (2014). OSL, optically stimulated luminescence.