
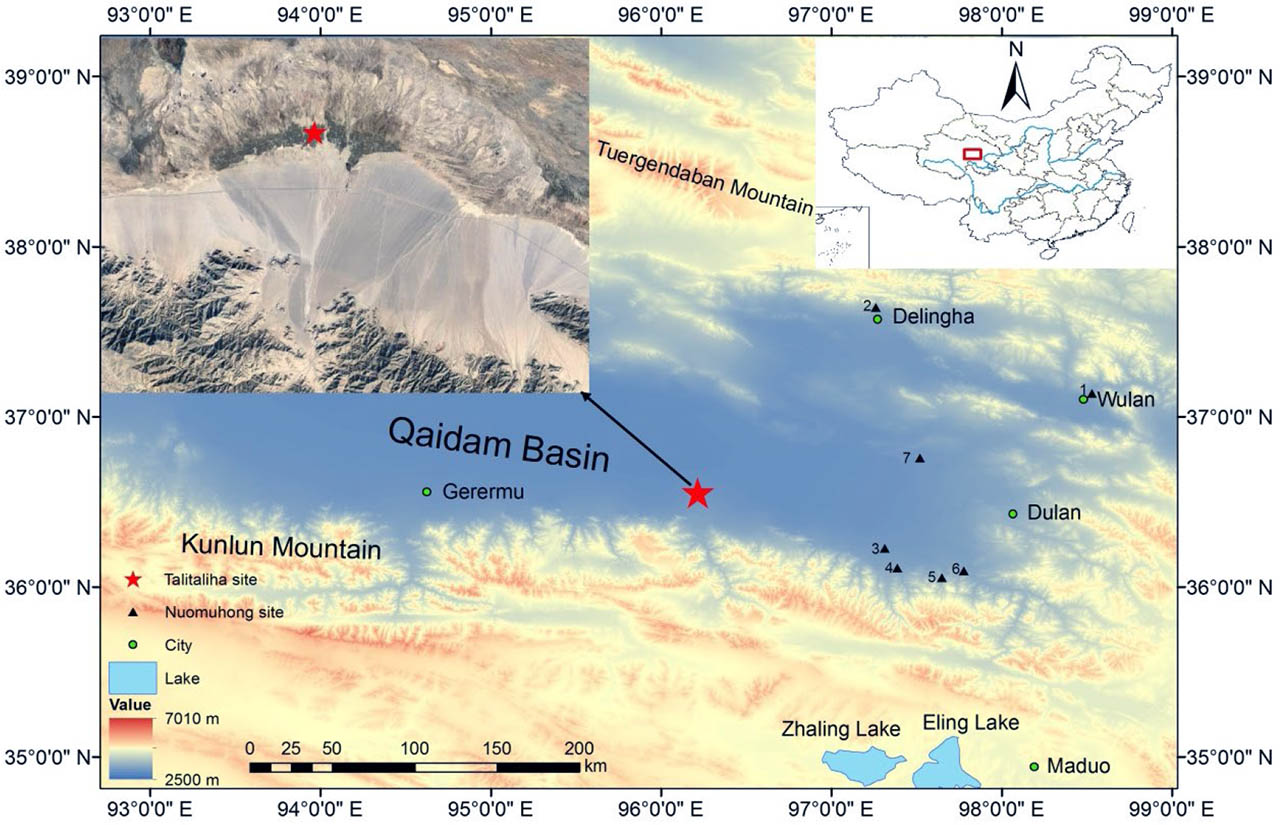
Fig. 1
Location of Talitaliha archaeological site in the Qaidam Basin. The site (red star symbol) is located at the edge of a huge proluvial fan. Black triangles represent other Nuomuhong culture sites in the Qaidam Basin: (1) Hongshanzuinanpo (Chen et al., 2015); (2) Baishuihexian; (3) Tawendaliha (Chen et al., 2015); (4) Xiariyamakebu (Chen et al., 2015); (5) Keer (Chen et al., 2015); (6) Shangchaikai; (7) Qiaohuerage.
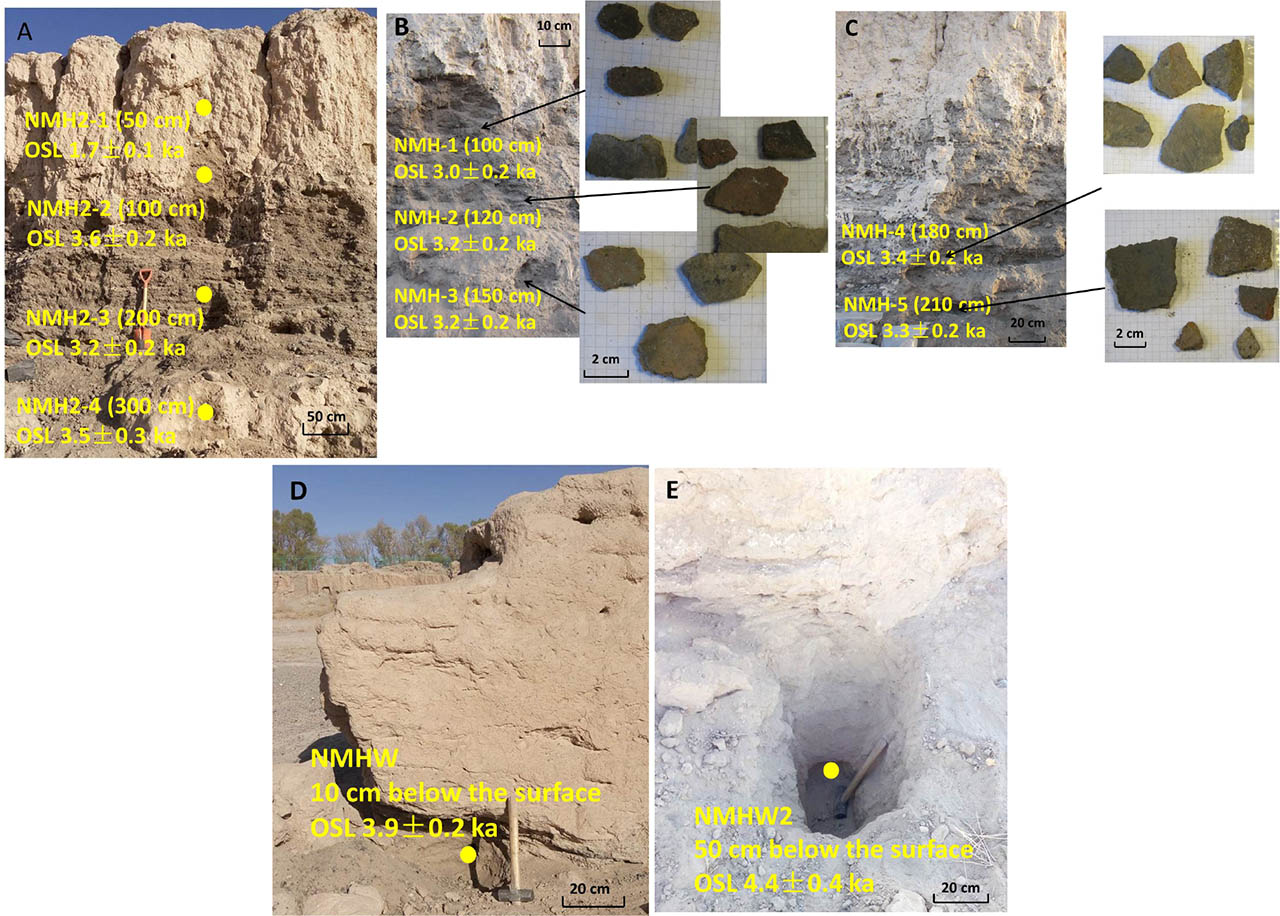
Fig. 2
Study section and sample locations. (A) Overview of the sampling section at Talitaliha site showing location of four OSL sandy loess samples. (B) and (C) Five groups of sand tempered grey ceramics were sampled for OSL from the thick culture layer. (D) and (E) Two OSL sandy loess samples were taken from below the earth wall, located in the south of the site, to provide a lower dating limit for the Talitaliha site.
Table 1
Sequential steps followed in this study for the measurement of single-aliquot regenerative (SAR) and post-IR IRSL (pIR50IR290).
| Step | Ceramic sample | Stratigraphic sediment sample | ||||
|---|---|---|---|---|---|---|
| Quartz OSL | Observed | K-feldspar pIRIR | Observed | Quartz OSL | Observed | |
| 1 | Give dose, Di (i=0, 1, 2, 3…) | Give dose, Di (i=0, 1, 2, 3…) | Give dose, Di (i=0,1,2,3…) | |||
| 2 | Preheat (200°C, 10 s) | Preheat (320°C, 60 s) | Preheat (260°C, 10 s) | |||
| 3 | IRSL (50°C, 200 s) | Lx,IR 50 | ||||
| 4 | OSL (125°C, 40 s) | Lx | IRSL (290°C, 200 s) | Lx,pIRIR 290 | OSL (125°C, 40 s) | Lx |
| 5 | Test dose | Test dose | Test dose | |||
| 6 | Cut-heat (160°C) | Cut-heat (320°C, 60 s) | Cut-heat (220°C) | |||
| 7 | IRSL (50°C, 200 s) | Tx,IR 50 | ||||
| 8 | OSL (125°C, 40 s) | Tx | IRSL (290°C, 200 s) | Tx,pIRIR 290 | OSL (125°C, 40 s) | Tx |
| 9 | OSL (280°C, 40 s) | IRSL (325°C, 200 s) | OSL (280°C, 40 s) | |||
| 10 | Return to step 1 | Return to step 1 | Return to step 1 | |||
Table 2
Concentrations of U, Th and K in ceramic, sediment and sandy loess samples.
| Sample | Depth (cm) | Sample type | ICP-MS | NAA | ||||
|---|---|---|---|---|---|---|---|---|
| U (ppm) | Th (ppm) | K (%) | U (ppm) | Th (ppm) | K (%) | |||
| NMH-1 | 100 | ceramic | 2.39±0.30 | 16.32±0.80 | 3.01±0.06 | 2.05±0.09 | 13.40±0.36 | 3.16±0.08 |
| Sed-1 | 100 | sandy loess | 3.62±0.40 | 8.94±0.60 | 1.97±0.04 | 1.82±0.10 | 9.44±0.33 | 1.90±0.06 |
| NMH-2 | 120 | ceramic | 3.00±0.30 | 15.25±0.80 | 3.17±0.06 | 2.34±0.09 | 13.60±0.37 | 3.13±0.08 |
| Sed-2 | 120 | sandy loess | 3.30±0.40 | 9.65±0.60 | 1.92±0.40 | 1.78±0.09 | 10.66±0.36 | 1.93±0.06 |
| NMH-3 | 150 | ceramic | 2.87±0.30 | 21.78±0.90 | 3.72±0.06 | 2.68±0.10 | 21.00±0.53 | 3.77±0.08 |
| Sed-3 | 150 | sandy loess | 3.31±0.40 | 14.08±0.70 | 2.20±0.05 | 0.83±0.04 | 10.00±0.34 | 2.08±0.06 |
| NMH-4 | 180 | ceramic | 5.04±0.50 | 11.44±0.70 | 3.39±0.06 | 4.78±0.15 | 13.00±0.35 | 3.55±0.08 |
| Sed-4 | 180 | sandy loess | 3.12±0.40 | 8.52±0.60 | 1.83±0.04 | 2.76±0.10 | 12.00±0.34 | 1.82±0.06 |
| NMH-5 | 210 | ceramic | 3.08±040 | 20.97±0.90 | 3.54±0.06 | 2.76±0.10 | 18.60±0.48 | 3.58±0.08 |
| Sed-5 | 210 | sandy loess | 2.55±0.30 | 8.97±0.60 | 1.95±0.04 | 2.79±0.11 | 12.20±0.34 | 1.97±0.06 |
| NMH2-1 | 50 | sandy loess | 2.29±0.40 | 10.91±0.70 | 2.17±0.04 | |||
| NMH2-2 | 100 | sandy loess | 3.22±0.40 | 6.87±0.60 | 1.81±0.04 | |||
| NMH2-3 | 200 | sandy loess | 2.78±0.40 | 6.96±0.60 | 1.95±0.04 | |||
| NMH2-4 | 300 | sandy loess | 2.39±0.40 | 12.83±0.70 | 1.96±0.04 | |||
| NMHW | 10 | sandy loess | 1.71±0.30 | 8.76±0.60 | 2.04±0.04 | |||
| NMHW2 | 50 | sandy loess | 1.82±0.30 | 12.86±0.70 | 2.21±0.04 | |||
Table 3
Calculated quartz and feldspar dose rates for ceramics measured by inductively coupled mass spectrometry (ICP-MS) and neutron activation analysis (NAA), and for stratigraphic samples from the culture layer and below the earth wall measured by ICP-MS.
| Sample | Depth (cm) | Sample type | Water content (%) | ICP-MS | NAA | ||||||
|---|---|---|---|---|---|---|---|---|---|---|---|
| Beta (Gy/ka) | Gamma (Gy/ka) | Quartz dose rate (Gy/ka) | K-feldspar dose rate (Gy/ka) | Beta (Gy/ka) | Gamma (Gy/ka) | Quartz dose rate (Gy/ka) | K-feldspar dose rate (Gy/ka) | ||||
| NMH-1 | 100 | ceramic | 5±4 | 3.19±0.06 | 1.79±0.004 | 4.33±0.19 | 5.21±0.20 | 3.20±0.06 | 1.65±0.002 | 4.30±0.19 | 5.17±0.20 |
| Sed-1 | 100 | sandy loess | 5±4 | 2.33±0.05 | 1.31±0.005 | 2.15±0.05 | 1.26±0.002 | ||||
| NMH-2 | 120 | ceramic | 5±4 | 3.37±0.06 | 1.84±0.004 | 4.46±0.20 | 5.34±0.20 | 3.19±0.06 | 1.64±0.002 | 4.31±0.19 | 5.18±0.20 |
| Sed-2 | 120 | sandy loess | 5±4 | 2.26±0.05 | 1.29±0.005 | 2.18±0.05 | 1.29±0.002 | ||||
| NMH-3 | 150 | ceramic | 5±4 | 3.97±0.06 | 2.28±0.004 | 5.24±0.23 | 6.10±0.24 | 3.79±0.07 | 1.94±0.002 | 4.84±0.22 | 5.71±0.22 |
| Sed-3 | 150 | sandy loess | 5±4 | 2.61±0.05 | 1.58±0.005 | 2.24±0.52 | 1.32±0.002 | ||||
| NMH-4 | 180 | ceramic | 5±4 | 3.73±0.06 | 1.93±0.006 | 4.66±0.21 | 5.53±0.21 | 3.66±0.07 | 1.74±0.002 | 4.68±0.21 | 5.55±0.22 |
| Sed-4 | 180 | sandy loess | 5±4 | 2.13±0.05 | 1.20±0.005 | 2.16±0.05 | 1.29±0.002 | ||||
| NMH-5 | 210 | ceramic | 5±4 | 3.84±0.06 | 2.22±0.005 | 4.73±0.21 | 6.22±0.27 | 3.62±0.07 | 1.85±0.002 | 4.68±0.21 | 6.04±0.27 |
| Sed-5 | 210 | sandy loess | 5±4 | 2.16±0.04 | 1.19±0.004 | 2.28±0.05 | 1.33±0.002 | ||||
| NMH2-1 | 50 | sandy loess | 5±4 | 2.36±0.05 | 1.31±0.007 | 3.62±0.17 | |||||
| NMH2-2 | 100 | sandy loess | 5±4 | 2.08±0.05 | 1.13±0.005 | 3.14±0.15 | |||||
| NMH2-3 | 200 | sandy loess | 5±4 | 2.14±0.05 | 1.12±0.006 | 3.31±0.16 | |||||
| NMH2-4 | 300 | sandy loess | 5±4 | 2.28±0.05 | 1.41±0.006 | 3.55±0.17 | |||||
| NMHW | 10 | sandy loess | 5±4 | 2.11±0.04 | 1.11±0.005 | 3.31±0.15 | |||||
| NMHW2 | 50 | sandy loess | 5±4 | 1.36±0.04 | 1.36±0.005 | 3.70±0.17 | |||||
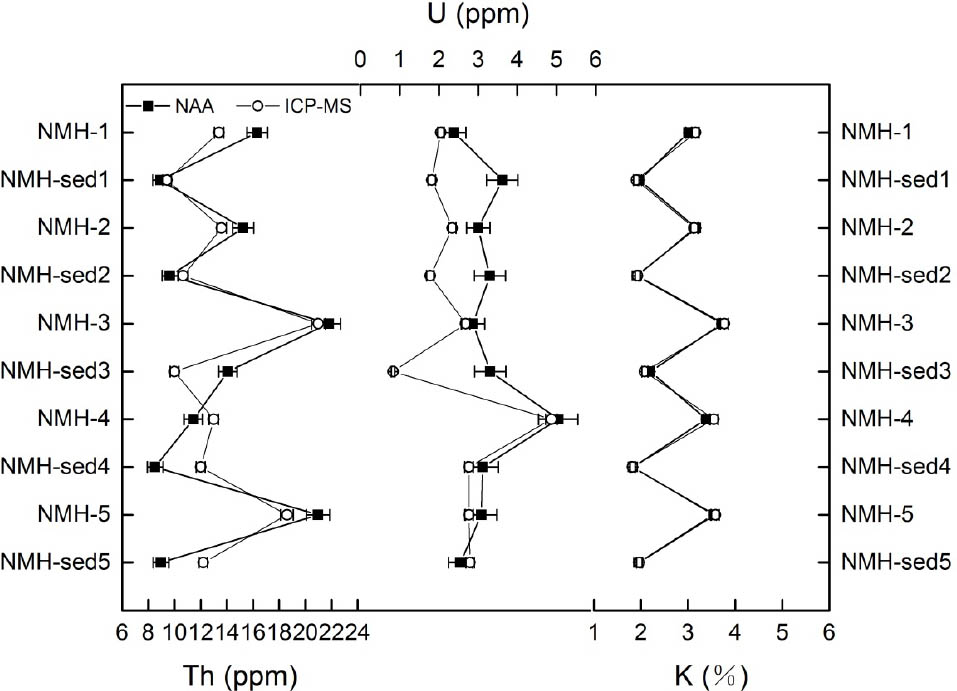
Fig. 3
Comparison of U, Th and K content of ceramics (NMH1–5) and surrounding sediment (sed1–5) as measured by inductively coupled mass spectrometry (ICP-MS) and neutron activation analysis (NAA).
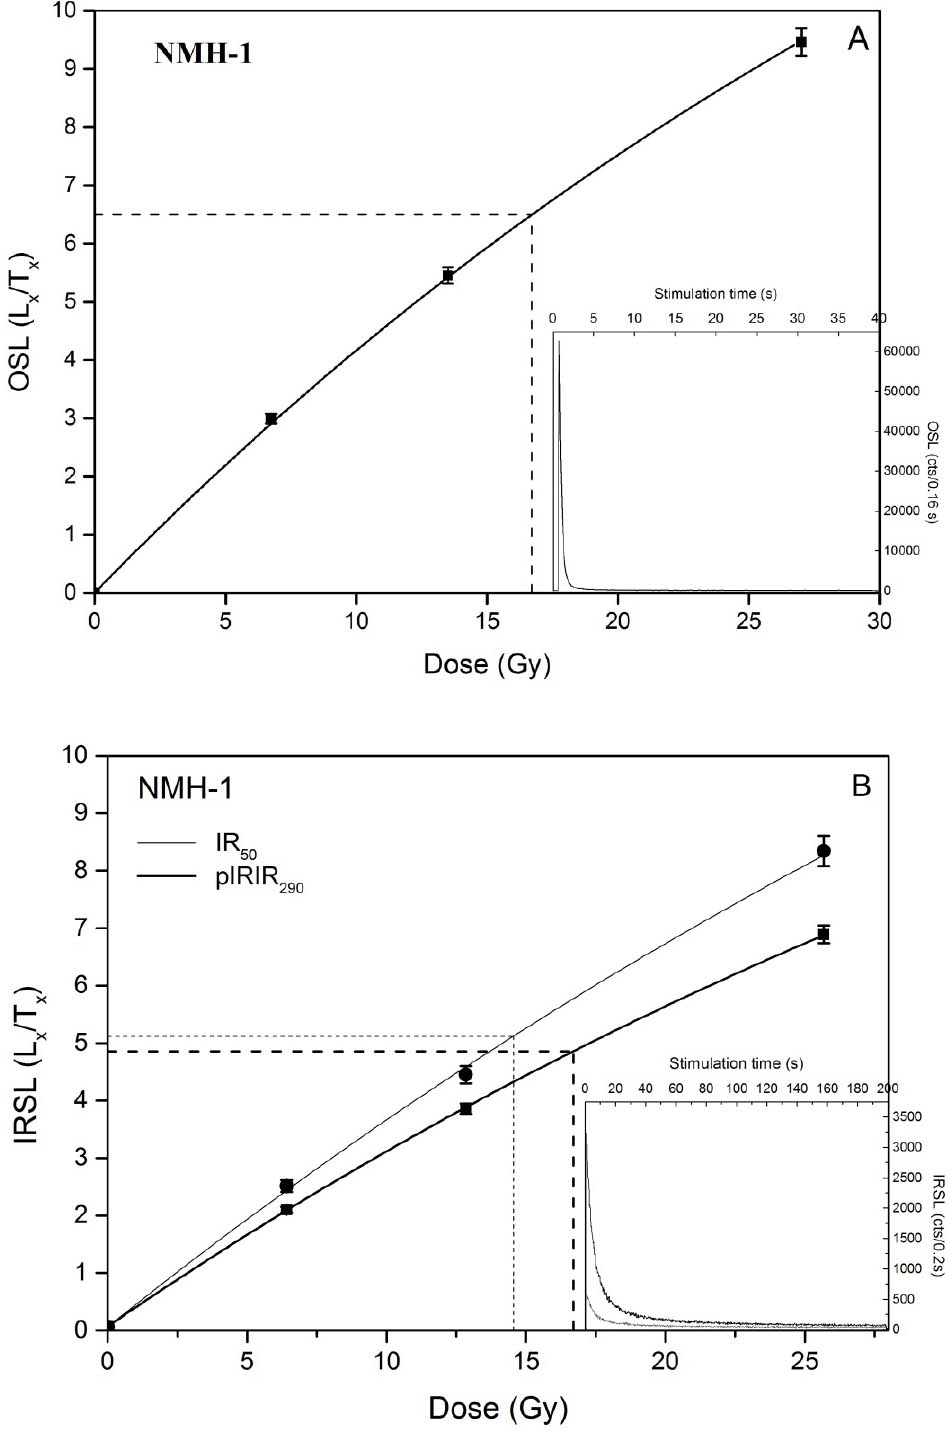
Fig. 4
Luminescence characteristics of quartz OSL and K-feldspar post-IR IRSL (pIRIR) signals from ceramic, and of the quartz OSL from stratigraphy sample. (A) Best fit growth curve using an exponential function for quartz from sample NMH-1, with a natural stimulation curve inset. (B) Best fit growth curves using an exponential function for coarse-grained K-feldspar from sample NMH-1, with a natural stimulated curve of IRSL and pIRIR290 inset.
Table 4
Quartz OSL and K-feldspar pIRIR290 dating results for five ceramic samples and quartz OSL results for six sandy loess samples from Talitaliha site. Samples NMH2-1, NMH2-2, NMH2-3 and NMH2-4 are from the culture layer and samples NMHW and NMHW2 are from the surface layer.
| Sample | Depth | Sample | Quartz | Feldspar | ||||||
|---|---|---|---|---|---|---|---|---|---|---|
| Discs | De (Gy) | OD (%) | Age (ka) | Cups | De (Gy) | OD (%) | Age (ka) | |||
| NMH-1 | 100 | ceramic | 21 | 12.93±0.45 | 16.20±5.15 | 3.0±0.2 | 12 | 17.19±0.16 | 1.00±0.54 | 3.3±0.1 |
| NMH-2 | 120 | ceramic | 21 | 14.13±0.41 | 17.53±9.70 | 3.2±0.2 | 12 | 18.37±0.29 | 3.38±1.80 | 3.4±0.2 |
| NMH-3 | 150 | ceramic | 21 | 16.55±0.19 | 9.03±1.27 | 3.2±0.2 | 12 | 20.59±0.34 | 4.43±1.01 | 3.4±0.2 |
| NMH-4 | 180 | ceramic | 15 | 15.89±0.49 | 11.70±1.28 | 3.4±0.2 | 12 | 19.09±0.19 | 1.95±1.01 | 3.5±0.2 |
| NMH-5 | 210 | ceramic | 21 | 15.83±0.37 | 17.25±5.47 | 3.3±0.2 | 12 | 18.75±0.18 | 0.50±0.43 | 3.0±0.1 |
| NMH2-1 | 50 | sandy loess | 18 | 6.13±0.30 | 1.32±0.73 | 1.7±0.1 | ||||
| NMH2-2 | 100 | sandy loess | 27 | 11.26±0.16 | 4.70±3.32 | 3.6±0.2 | ||||
| NMH2-3 | 200 | sandy loess | 30 | 10.78±0.12 | 1.23±1.01 | 3.2±0.2 | ||||
| NMH2-4 | 300 | sandy loess | 18 | 12.54±0.78 | 3.28±1.27 | 3.5±0.2 | ||||
| NMHW | 10 | sandy loess | 18 | 12.79±0.50 | 2.26±1.11 | 3.9±0.2 | ||||
| NMHW2 | 50 | sandy loess | 18 | 16.15±1.15 | 7.50±7.50 | 4.4±0.4 | ||||
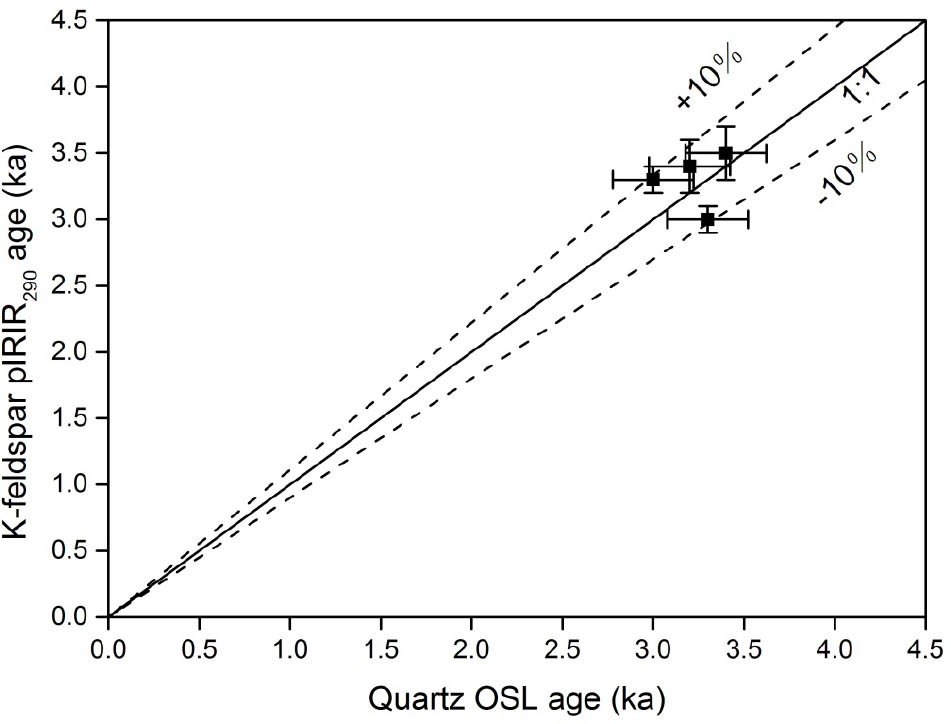
Fig. 5
omparison of quartz OSL ages and K-feldspar pIRIR290 ages from Talitaliha. Solid line represents 1:1 and dashed lines represent ±10% deviation.
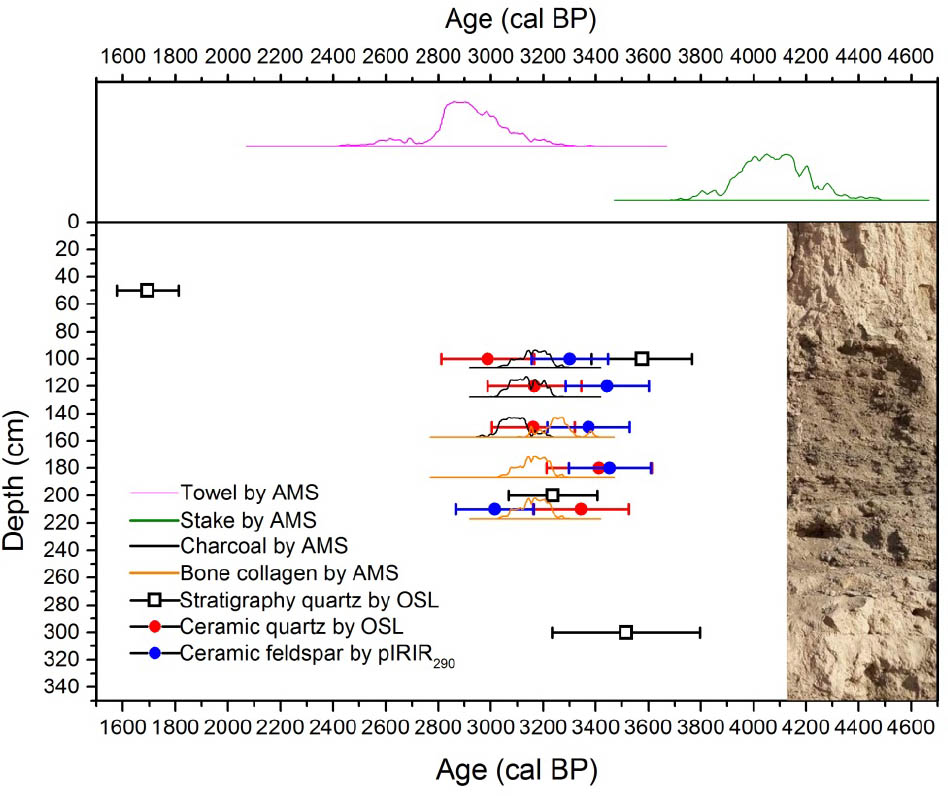
Fig. 6
Comparison of luminescence ages for ceramics and stratigraphy samples with calibrated radiocarbon ages for Talitaliha site. Age determinations from this study are consistent with the 14C age of the towel (the pink line) (IA, CASS 1991). The green line represents the 14C age of the stake, which is influenced by the “old wood” effect (Dong et al., 2014).
Table 5
Calibrated radiocarbon dates from Talitaliha site. There is good agreement of ages from charcoal and bone. As explained in the text, when cross-checking with OSL dates from the site, 65 years was added to the calibrated 14C result.
| Sample | Lab number | Depth (cm) | Dated material | 14C age (BP) | Calibrated age (cal BP) | Method | |
|---|---|---|---|---|---|---|---|
| 1 Sigma | 2 Sigma | ||||||
| NMHC-1 | Beta-491058 | 100 | charcoal | 2940±30 | 3176±52 | 3151±95 | AMS |
| NMHC-2 | Beta-491059 | 120 | charcoal | 2920±30 | 3106±40 | 3130±96 | AMS |
| NMHC-3 | Beta-491060 | 150 | charcoal | 3000±30 | 3253±44 | 3229±89 | AMS |
| NMHB-1 | Beta-491061 | 150 | bone | 2890±30 | 3082±47 | 3070±77 | AMS |
| NMHB-2 | Beta-491062 | 180 | Bone | 2940±30 | 3176±52 | 3151±95 | AMS |
| NMHB-3 | Beta-491063 | 210 | bone | 2940±30 | 3176±52 | 3151±95 | AMS |
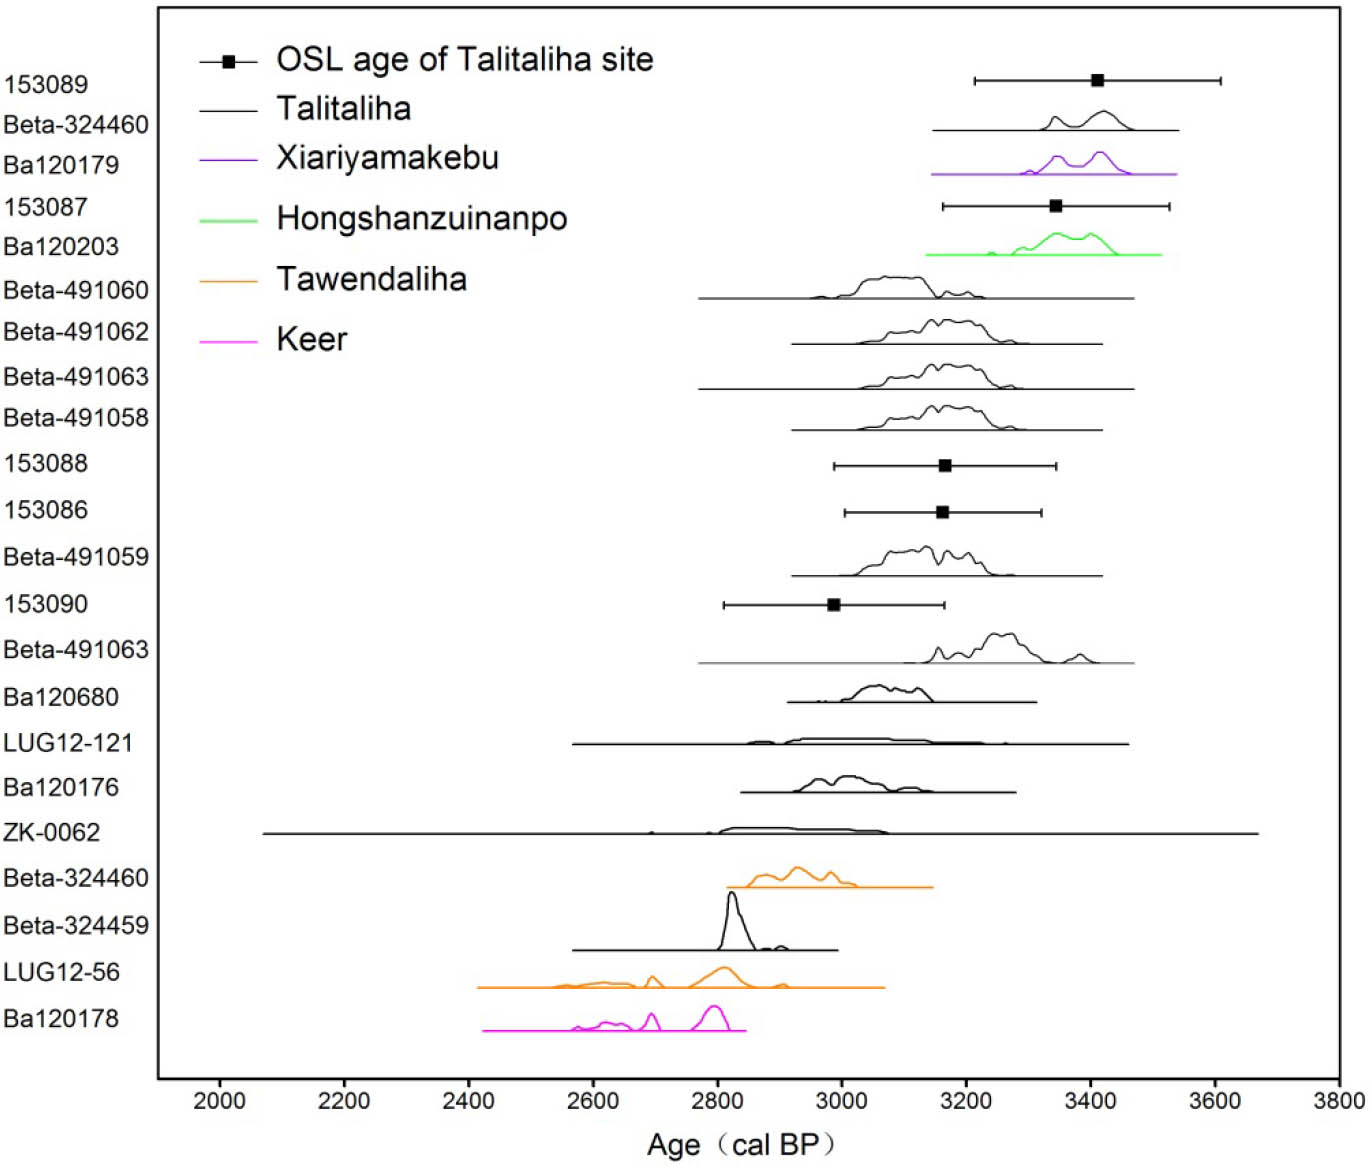
Fig. 7
Comparison of quartz OSL ages from this study with calibrated radiocarbon ages from typical Nuomuhong sites in the Qaidam Basin. All ages show good agreement, ranging between 3400–2450 cal yr BP. Note*: Samples Beta-324460 (barley), BA120179 (wheat), BA120203 (barley), Beta-324459 (barley) and BA120178 (barley) are from Chen et al. (2015); samples BA120176 (barley) and LUG12-121 (charcoal) are from Dong et al. (2014); samples LUG12-56 (charcoal), BA120680 (charcoal) and Beta324460 (charcoal) are from Dong et al. (2016); and sample ZK-0062 (charcoal) is from IA, CASS (1991).