
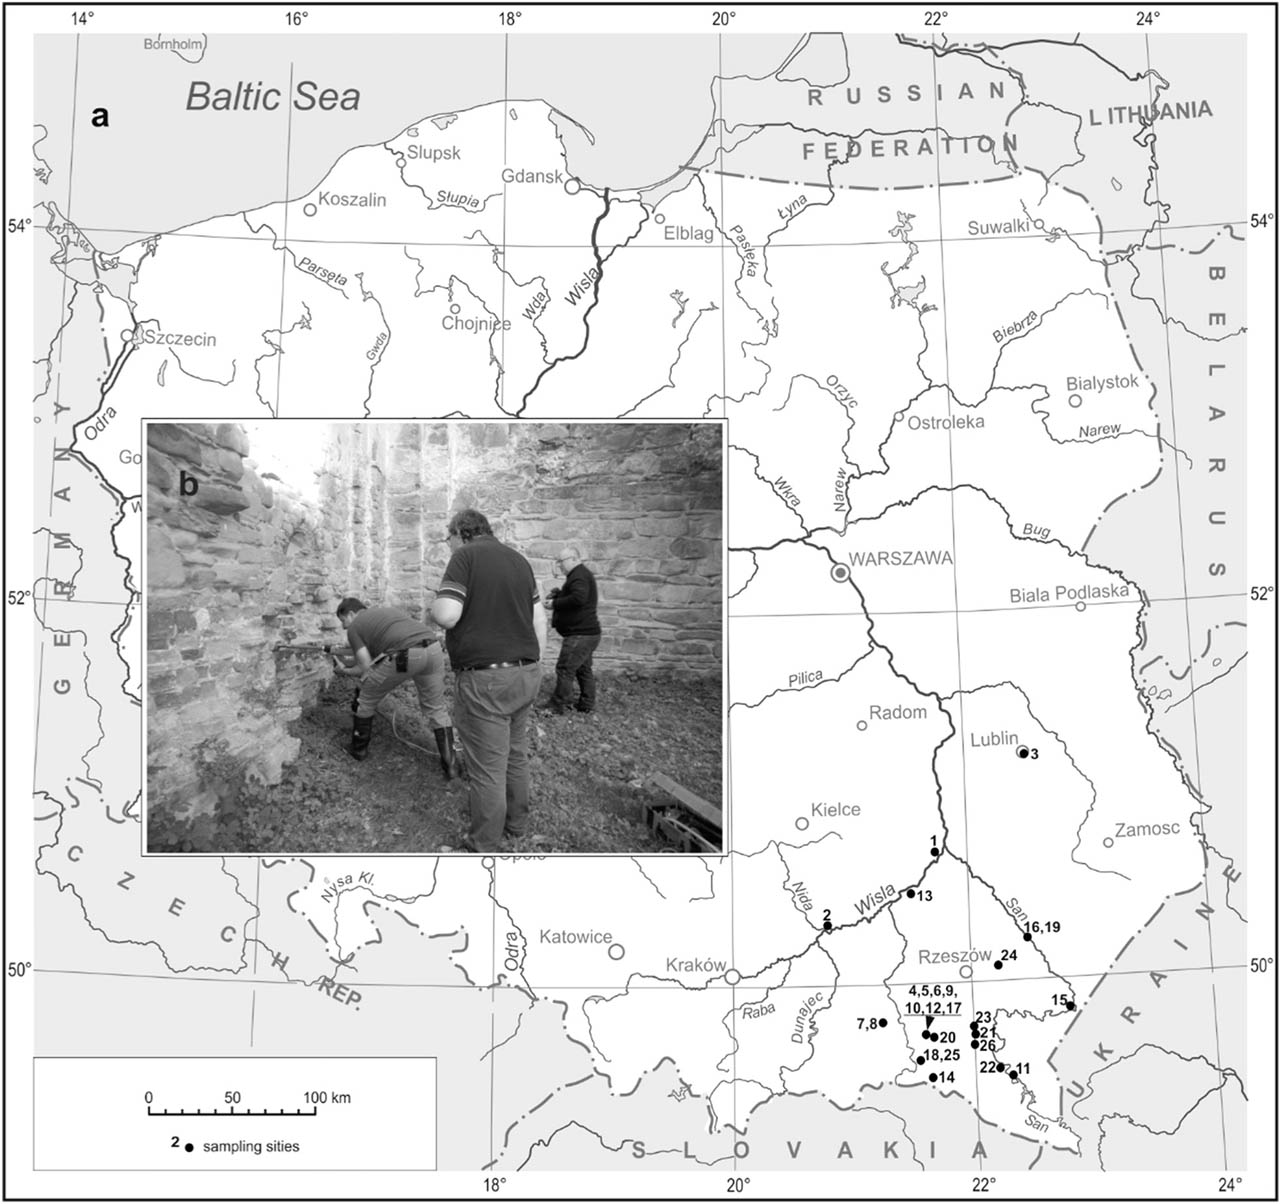
Fig 1
(a) Location of sites selected for archeomagnetic studies in SE Poland and listed in Table 1. (b) Drilling of bricks in the ruins of Discalced Carmelites monastery at Zagórz (locality no. 22).
Table 1
Brick buildings in SE Poland and characteristic inclinations of geomagnetic field isolated from them and recalculated for the city of Rzeszów geographic coordinates.
| Nr | Site, brick building | Geographic coordinates | Age | N | n | I | sd/α95 | |
|---|---|---|---|---|---|---|---|---|
| 1 | Sandomierz, Dominican monastery | 50.6765 | 21.7443 | 1235 ± 5 | 3 | 9 | 63.1 | 5.2 |
| 2 | Nowy Korczyn, Franciscan monastery | 50.2978 | 20.8056 | 1255 ± 5 | 2 | 4 | 64.5 | 5.1 |
| 3 | Lublin, Dominican monastery | 51.2478 | 22.5699 | 1342 ± 5 | 1 | 4 | 55.0 | 1.6 |
| 4 | Krosno, defensive wall in Subcarpathian Museum | 49.6956 | 21.7637 | 1350 ± 10 | 1 | 10 | 58.8 | 4.2 |
| 5 | Krosno, town hall | 49.6940 | 21.7649 | 1360 ± 10 | 1 | 8 | 60.7 | 1.7 |
| 6 | Krosno, Franciscan monastery | 49.6937 | 21.7667 | 1425 ± 10 | 4 | 5 | 67.2 | 2.1 |
| 7 | Biecz, defensive wall | 49.7311 | 21.2474 | 1430 ± 10 | 2 | 4 | 65.0 | 2.3 |
| 8 | Biecz, church Corpus Christi | 49.7306 | 21.2473 | 1460 ± 20 | 3 | 9 | 64.3 | 1.5 |
| 9 | Krosno, defensive wall near Franciscan monastery | 49.6832 | 21.7670 | 1490 ± 10 | 3 | 25 | 67.1 | 1.2 |
| 10 | Krosno, Mayor's tenement house | 49.6936 | 21.7659 | 1510 ± 10 | 4 | 4 | 62.2 | 6.4 |
| 11 | Lesko, castle | 49.4695 | 22.3254 | 1520 ± 10 | 4 | 11 | 62.6 | 6.1 |
| 12 | Krosno, tenement house, Rynek 14 | 49.6935 | 21.7643 | 1560 ± 10 | 2 | 4 | 62.8 | 1.2 |
| 13 | Baranów Sandomierski, castle | 50.5018 | 21.5355 | 1570 ± 10 | 3 | 12 | 71.1 | 9.8 |
| 14 | Jaśliska, town hall | 49.4410 | 21.8028 | 1580 ± 20 | 2 | 6 | 67.8 | 0.9 |
| 15 | Bolestraszyce, chapel | 49.8168 | 22.8595 | 1600 ± 15 | 1 | 4 | 72.5 | 1.6 |
| 16 | Leżajsk, basilica | 50.2705 | 22.4077 | 1610 ± 10 | 3 | 12 | 68.0 | 1.7 |
| 17 | Krosno, belfry of parish church | 49.6944 | 21.7641 | 1635 ± 10 | 4 | 5 | 71.2 | 6.6 |
| 18 | Dukla, palace (basements) | 49.5568 | 21.6849 | 1640 ± 10 | 3 | 28 | 68.7 | 0.5 |
| 19 | Leżajsk, defensive wall | 50.2701 | 22.4089 | 1642 ± 5 | 1 | 3 | 66.9 | 1.2 |
| 20 | Krościenko Wyżne, mansion ruins | 49.6810 | 21.8076 | 1650 ± 10 | 3 | 6 | 68.7 | 5.5 |
| 21 | Brzozów, church | 49.6951 | 22.0189 | 1670 ± 10 | 2 | 8 | 66.0 | 9.9 |
| 22 | Zagórz, Discalced Carmelites monastery | 49.5007 | 22.2720 | 1710 ± 5 | 4 | 14 | 69.5 | 3.8 |
| 23 | Stara Wieś, Jesuit monastery | 49.7136 | 22.0139 | 1740 ± 10 | 2 | 6 | 72.8 | 2.6 |
| 24 | Łańcut, castle | 50.0681 | 22.2347 | 1772 ± 5 | 4 | 16 | 70.7 | 5.4 |
| 25 | Dukla, customs chamber | 49.5540 | 21.6842 | 1780 ± 10 | 2 | 18 | 62.9 | 1.6 |
| 26 | Wzdów, palace | 49.6430 | 22.0011 | 1790 ± 5 | 3 | 9 | 59.2 | 9.8 |
[i] N- number of bricks, n – number of specimens, I – mean inclination of geomagnetic field, sd/α95 – standard deviation (statistics for mean from more than one brick) or radius of the cone of 95% confidence (statistics for mean from one brick).
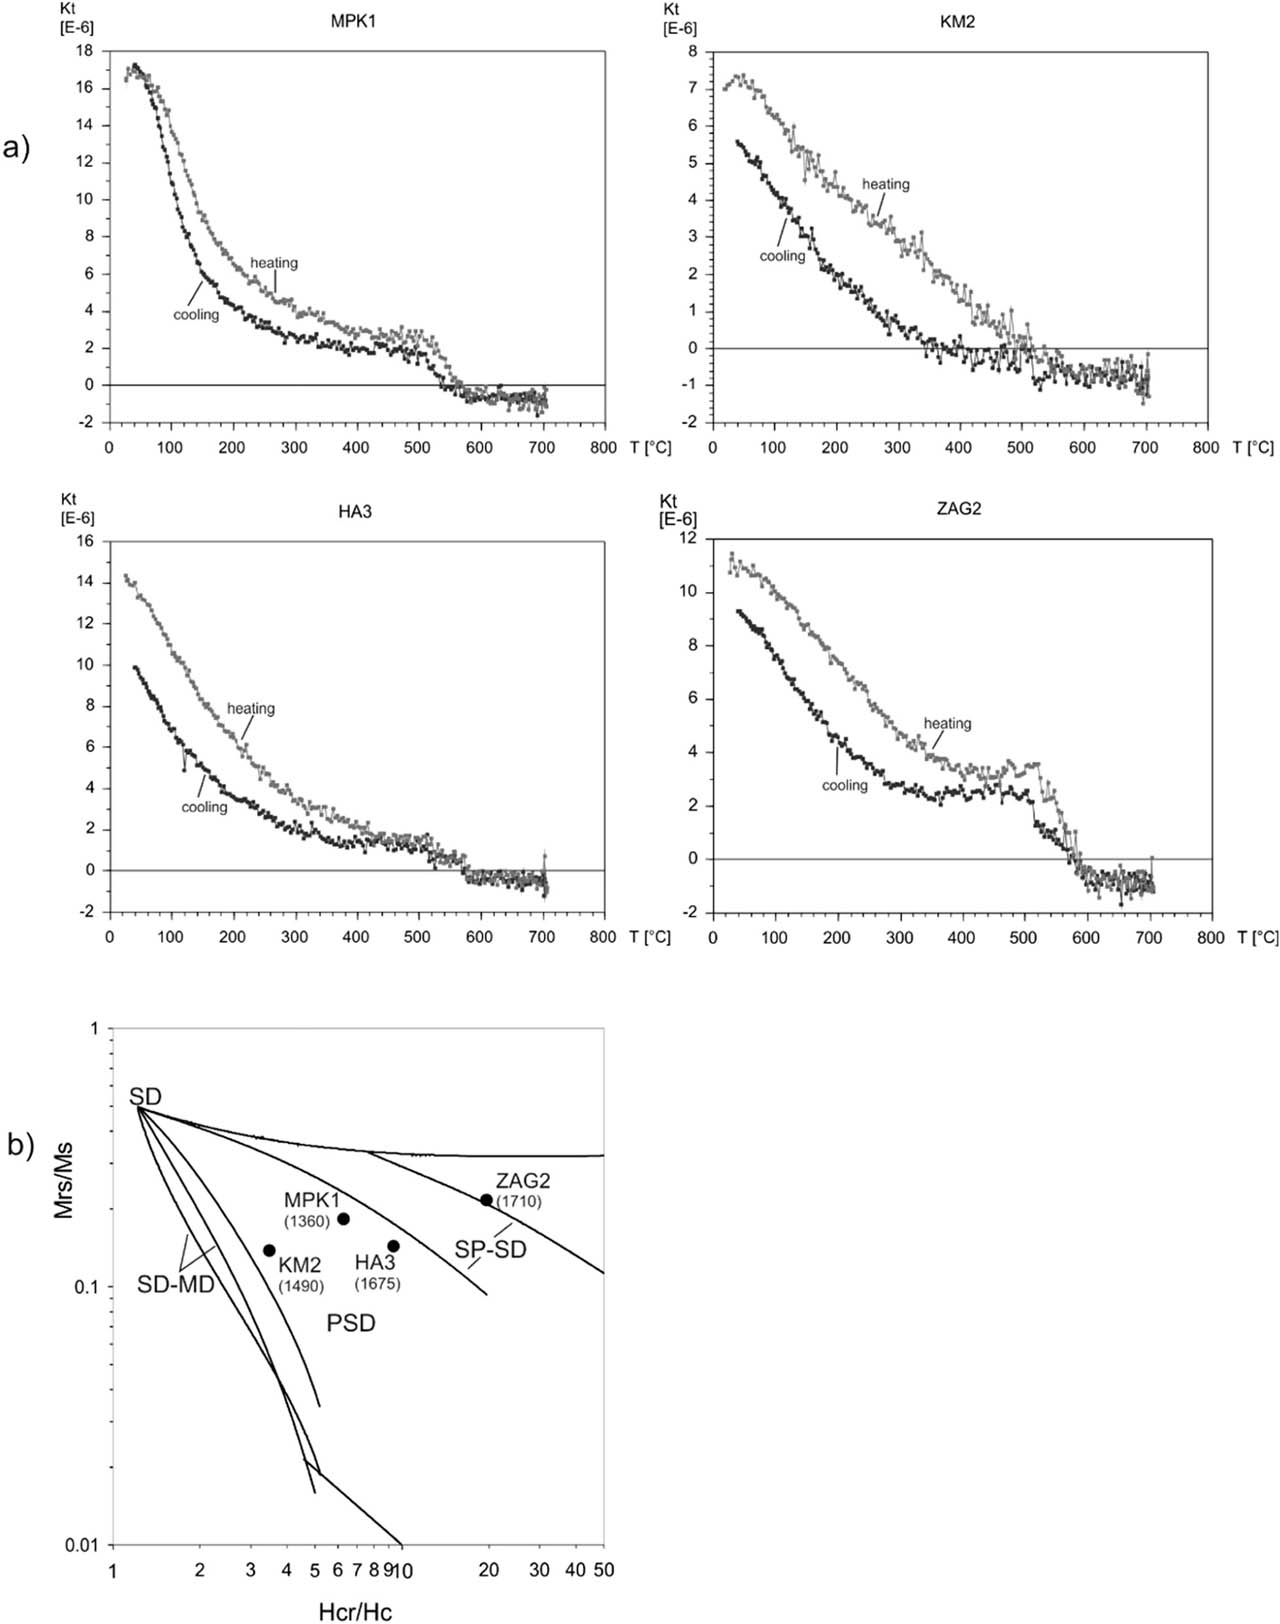
Fig 2
(a) Changes of magnetic susceptibility during heating and cooling at 20–700 °C range observed in selected brick samples from historical buildings of SE Poland (MPK1 – Krosno, defensive wall; KM2 – Krosno, defensive wall near Franciscan monastery; ZAG2 – Zagórz, Discalced Carmelites monastery; HA – Haczów, mansion). (b) Day plot (Day et al., 1977) for the same brick samples. Hysteresis parameters: Mrs/Ms versus Hcr/Hc rations for single-domain (SD), pseudo-single domain (PSD) and multi-domain (MD) grains, indicated by broken lines (SD/MD and SD/superpara-magnetic (SP) grains) are shown after Dunlop (2002).
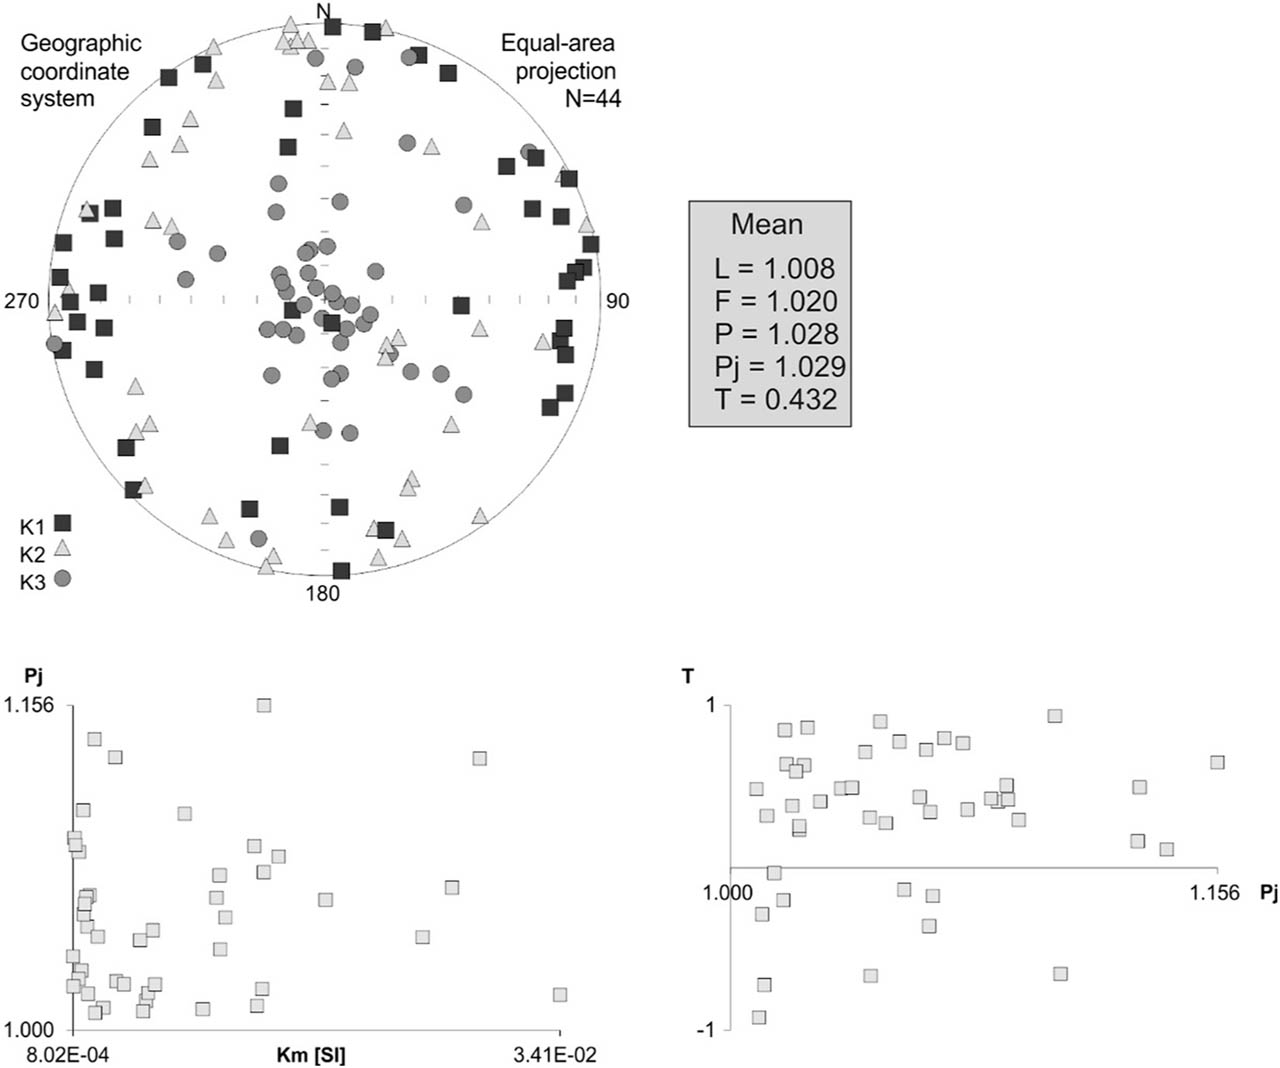
Fig 3
Results of the AMS studies of 44 brick samples presented as equal area projection of AMS principal axes and relationships between the AMS parameters T (shape parameter), Pj (corrected anisotropy factor), and Km (volume magnetic susceptibility). The mean values of L (lineation), F (foliation), P (anisotropy factor), Pj, and T are listed in the table.
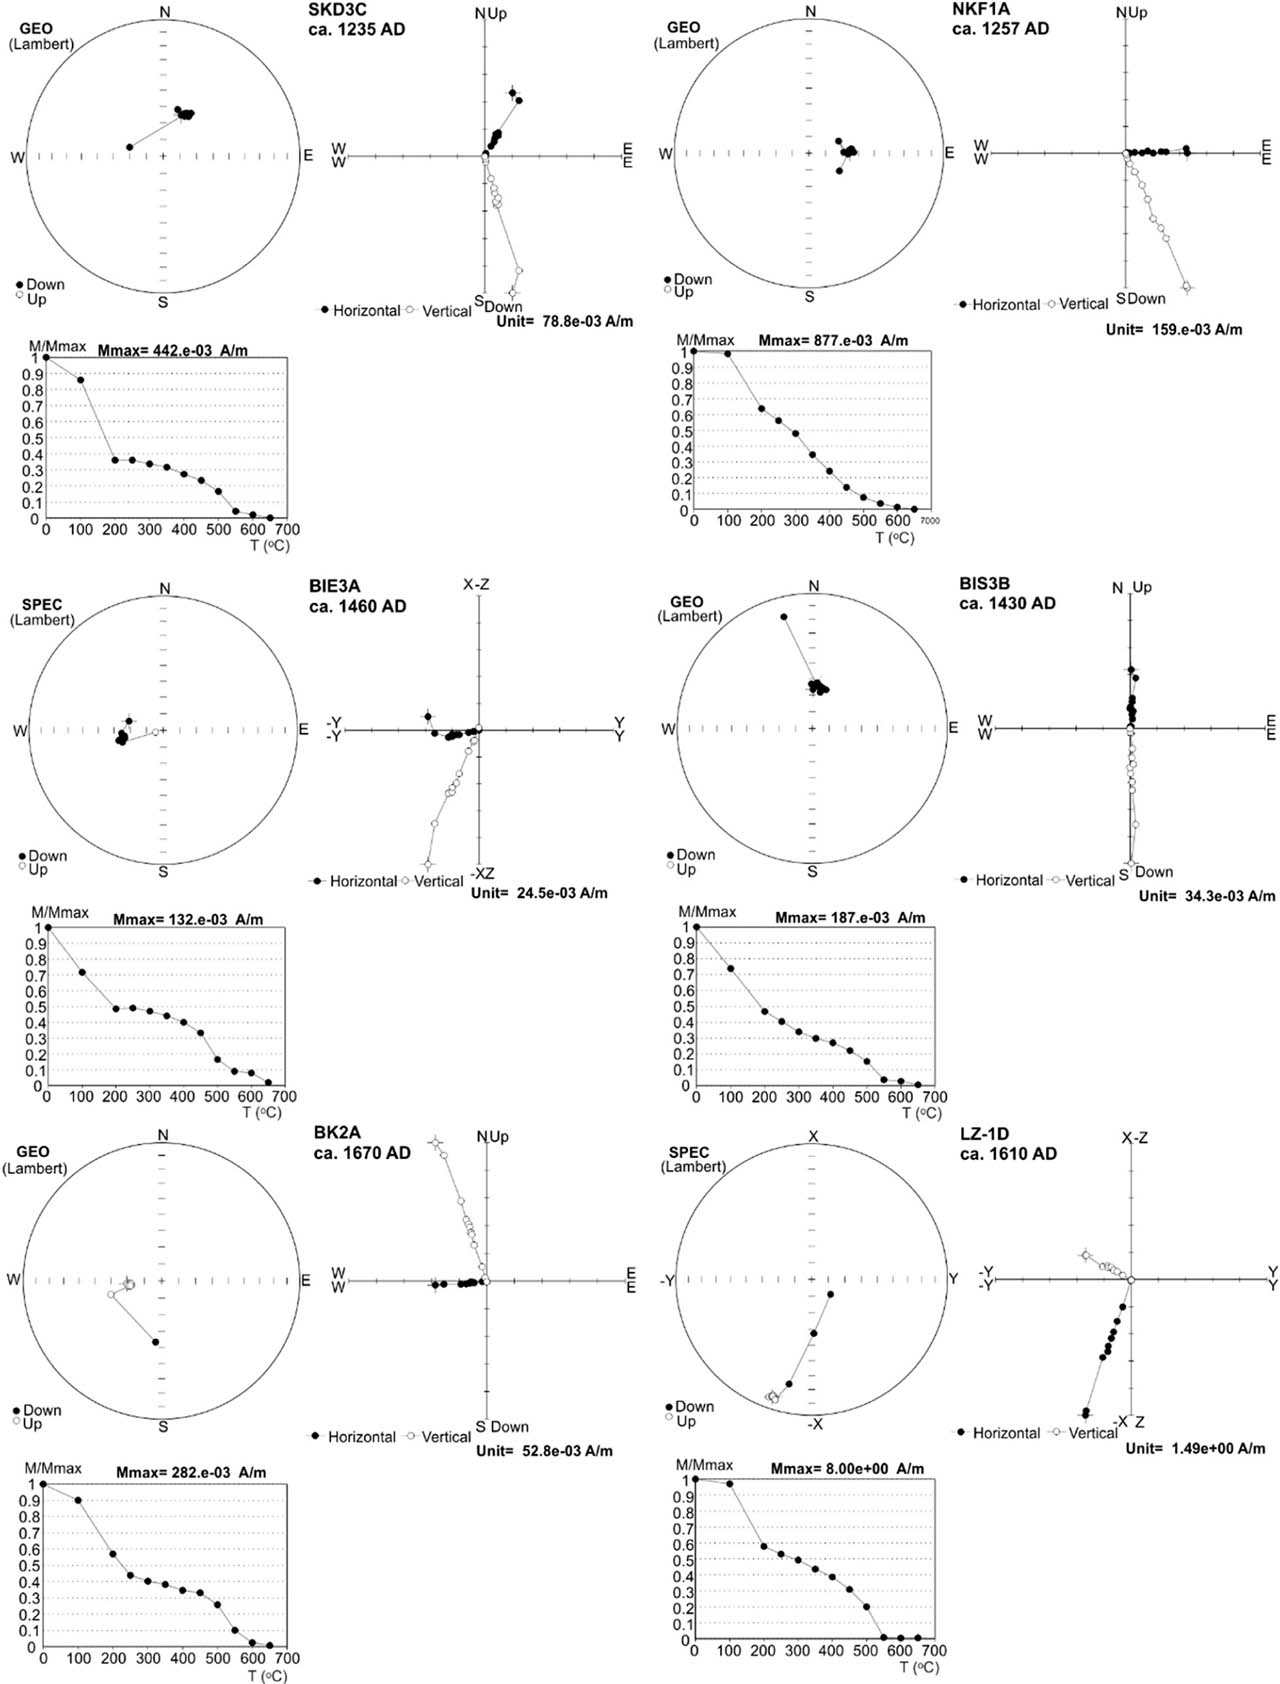
Fig 4
Results of thermal demagnetization of representative brick samples from SE Poland (demagnetization paths, intensity decay curves and orthogonal plots). SKD3C – Sandomierz, Dominican monastery; NKF1A – Nowy Korczyn, Franciscan monastery; BIE3A – Biecz, church Corpus Christi; BIS3B – Biecz, defensive wall; BK2A – Brzozów, church; LZ-1D – Leżajsk, basilica.
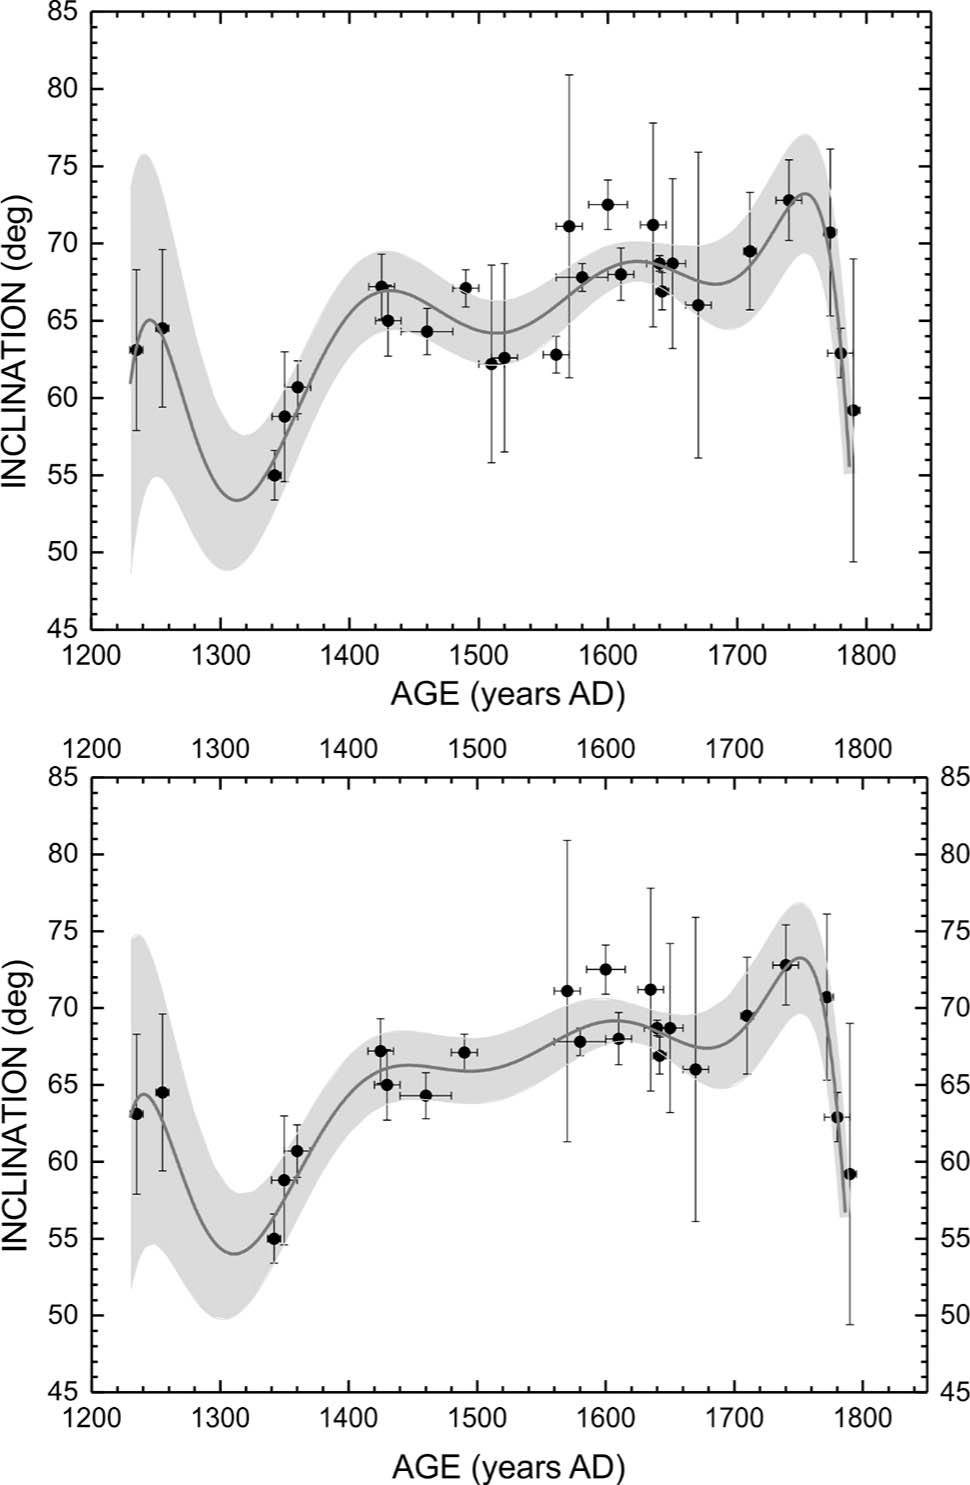
Fig 5
Two inclination curves at the Rzeszów reference site presented with grey belt of 95% confidence of polynomial of 8th degree fitting. The lower curve was calculated without data obtained from sites 10, 11, and 12 (see text and Table 1). The age and inclination errors for the data from each archeomagnetic site are presented by bars.
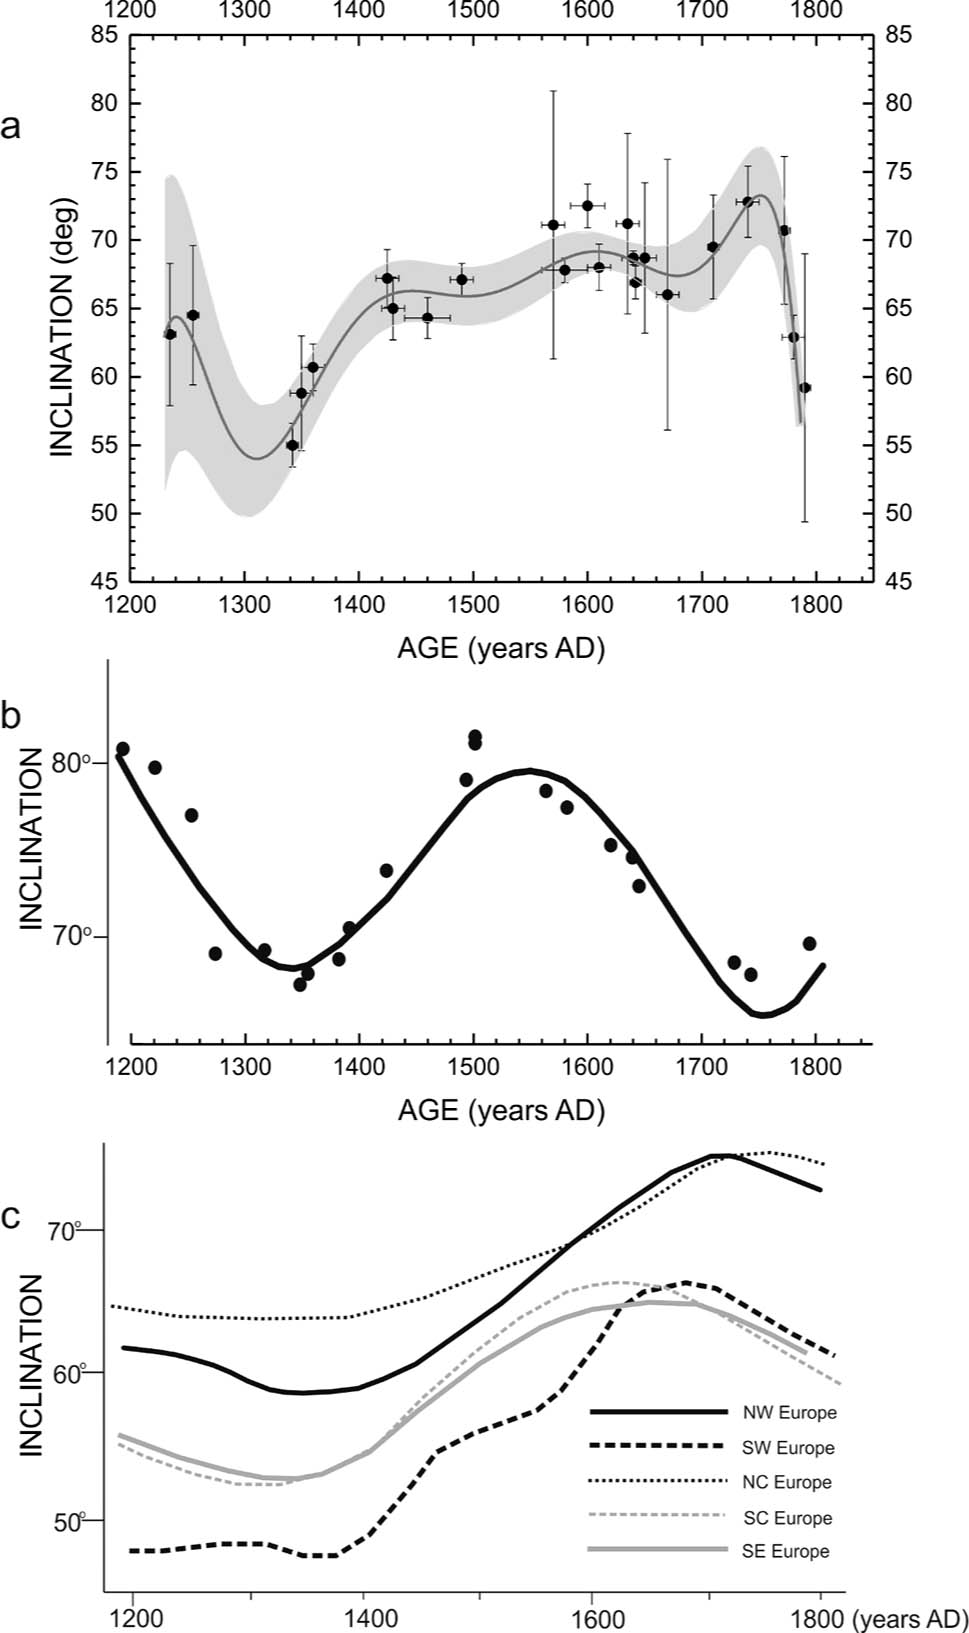
Fig 6
The regional curves of secular variations of inclination between 1200 and 1800 AD for Rzeszów (a), Gdańsk (b), after Czyszek and Czyszek (1987), and for five other regions of Europe (c), after Schneep (2008) and Pavón-Carrasco et al. (2009).
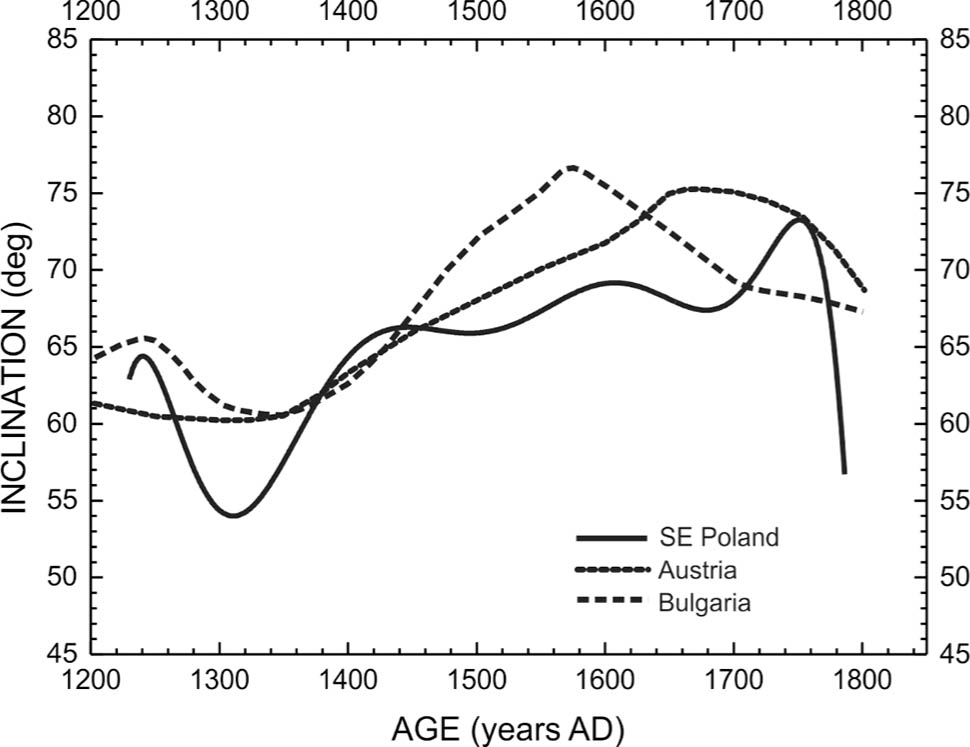
Fig 7
The regional curves of secular variations of inclination between 1200 and 1800 AD for SE Poland (this study), Austria (Schneep et al., 2015), and Bulgaria (Kovacheva et al., 2014).