
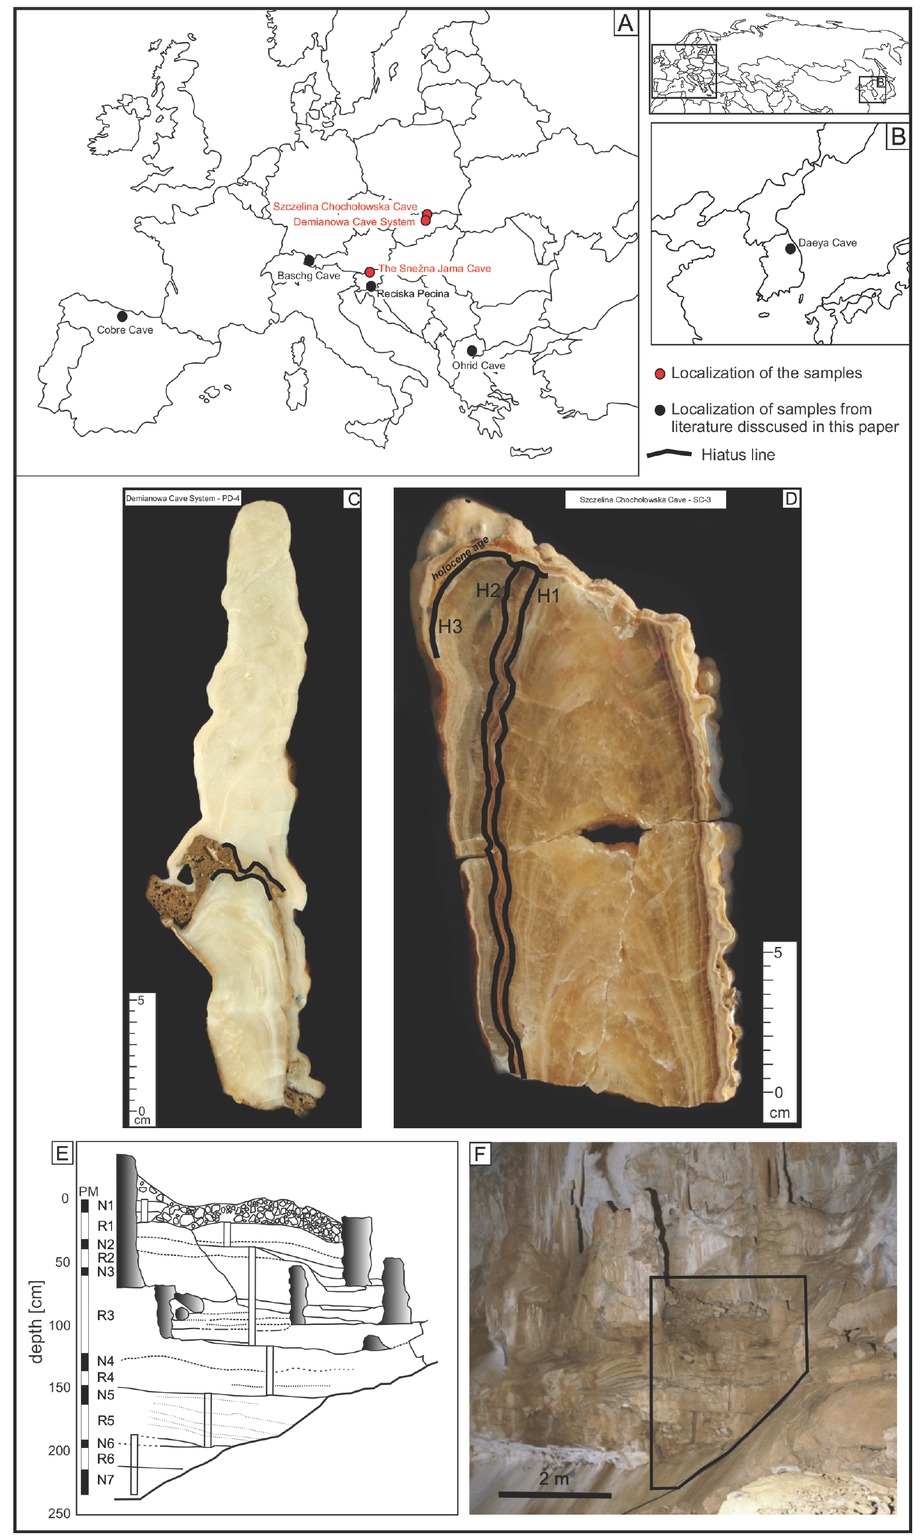
Fig 1
Sample localization: A – map of Central Europe; B – map of Korea; C – PD-4 stalagmite (photo by J. Pawlak); D – SC-3 stalagmite (photo by J. Pawlak); E – sketch of the LDH profile with sampled sections (rectangles) and principal hiatuses (lines); F – LDH flowstone.
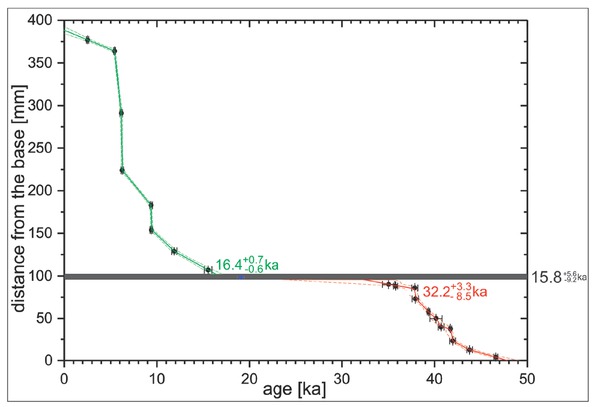
Fig 2
Age-depth models for the PD-4 stalagmite with estimated hiatus duration.
Table 1
U-series dating results for the SC-3 and PD-4 stalagmites.
| sample | H [mm] | U [ppm] | 234U/238U AR | 230Th/234U AR | 230Th/232Th AR | Age [ka] |
|---|---|---|---|---|---|---|
| SC-5 | 182±1 | 1.038 ± 0.002 | 1.158 ± 0.002 | 0.970 ± 0.005 | 7842 ± 46 | 290 ± 7 |
| SC-6 | 192±1 | 0.610 ± 0.002 | 1.105 ± 0.002 | 0.944 ± 0.004 | 45 ± 0.2 | 273 ± 5 |
| SC-8 | 198.5±1 | 1.000 ± 0.006 | 1.158 ± 0.002 | 0.936 ± 0.005 | 3345 ± 21 | 254 ± 5 |
| SC-9 | 200±1 | 0.941 ± 0.002 | 1.100 ± 0.002 | 0.915 ± 0.008 | 9078 ± 90 | 242 ± 7 |
| PD4-1 | 4±1 | 1.659 ± 0.003 | 1.143 ± 0.001 | 0.351 ± 0.001 | 374 ± 2 | 46.6 ± 0.2 |
| PD4-2 | 12.5±1 | 2.000 ± 0.01 | 1.197 ± 0.003 | 0.334 ± 0.002 | 654 ± 4 | 43.8 ± 0.3 |
| PD4-3 | 23±1 | 3.335 ± 0.006 | 1.182 ± 0.003 | 0.322 ± 0.002 | 2401 ± 18 | 41.9 ± 0.3 |
| PD4-4 | 38±1 | 2.578 ± 0.004 | 1.161 ± 0.001 | 0.320 ± 0.001 | 2254 ± 8 | 41.7 ± 0.2 |
| PD4-5 | 40±1 | 2.330 ± 0.01 | 1.185 ± 0.003 | 0.314 ± 0.002 | 2960 ± 17 | 40.7 ± 0.3 |
| PD4-6 | 50±1 | 1.840 ± 0.01 | 1.179 ± 0.003 | 0.311 ± 0.005 | 832 ± 13 | 40.1 ± 0.7 |
| PD4-7 | 58±1 | 3.540 ± 0.007 | 1.152 ± 0.001 | 0.305 ± 0.001 | 781 ± 3 | 39.3 ± 0.1 |
| PD4-8 | 73±1 | 2.111 ± 0.004 | 1.149 ± 0.002 | 0.295 ± 0.002 | 2352 ± 19 | 37.9 ± 0.3 |
| PD4-9 | 86±1 | 3.700 ± 0.020 | 1.142 ± 0.001 | 0.297 ± 0.001 | 210 ± 1 | 37.8 ± 0.3 |
| PD4-10 | 88±1 | 2.320 ± 0.004 | 1.160 ± 0.002 | 0.282 ± 0.002 | 220 ± 2 | 35.8 ± 0.2 |
| PD4-11 | 90±1 | 2.318 ± 0.010 | 1.203 ± 0.004 | 0.277 ± 0.005 | 1043 ± 17 | 35 ± 0.7 |
| PD4-12 | 107±1 | 0.751 ± 0.005 | 1.269 ± 0.007 | 0.133 ± 0.003 | 81 ± 2 | 15.5 ± 0.4 |
| PD4-13 | 129±1 | 1.479 ± 0.009 | 1.219 ± 0.004 | 0.103 ± 0.002 | 671 ± 15 | 11.9 ± 0.3 |
| PD4-14 | 154±1 | 1.183 ± 0.007 | 1.215 ± 0.004 | 0.082 ± 0.001 | 338 ± 4 | 9.4 ± 0.2 |
| PD4-15 | 183±1 | 1.386 ± 0.008 | 1.235 ± 0.003 | 0.084 ± 0.001 | 332 ± 6 | 9.3 ± 0.2 |
| PD4-16 | 224±1 | 1.243 ± 0.007 | 1.242 ± 0.002 | 0.056 ± 0.001 | 585 ± 14 | 6.3 ± 0.2 |
| PD4-17 | 291±1 | 1.467 ± 0.009 | 1.249 ± 0.002 | 0.055 ± 0.001 | 667 ± 13 | 6.2 ± 0.2 |
| PD4-18 | 364±1 | 1.469 ± 0.008 | 1.277 ± 0.003 | 0.049 ± 0.001 | 293 ± 6 | 5.4 ± 0.1 |
| PD4-19 | 377±1 | 2.088 ± 0.013 | 1.302 ± 0.007 | 0.023 ± 0.001 | 115 ± 6 | 2.5 ± 0.1 |
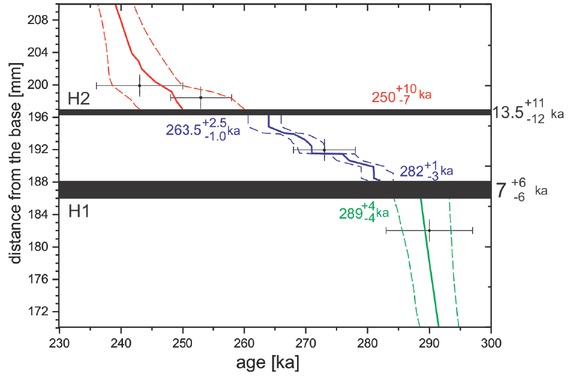
Fig 3
Age-depth models for the SC-3 stalagmite with the estimated durations of the hiatuses H1 and H2: A – the age-depth model chart of the whole profile; B– enlarged H1 and H2 zones; age-depth model for the oldest deposition phase (green lines); age-depth model for the deposition phase between H1 and H2 (blue lines); and age-depth model for the youngest deposition phase (red lines).
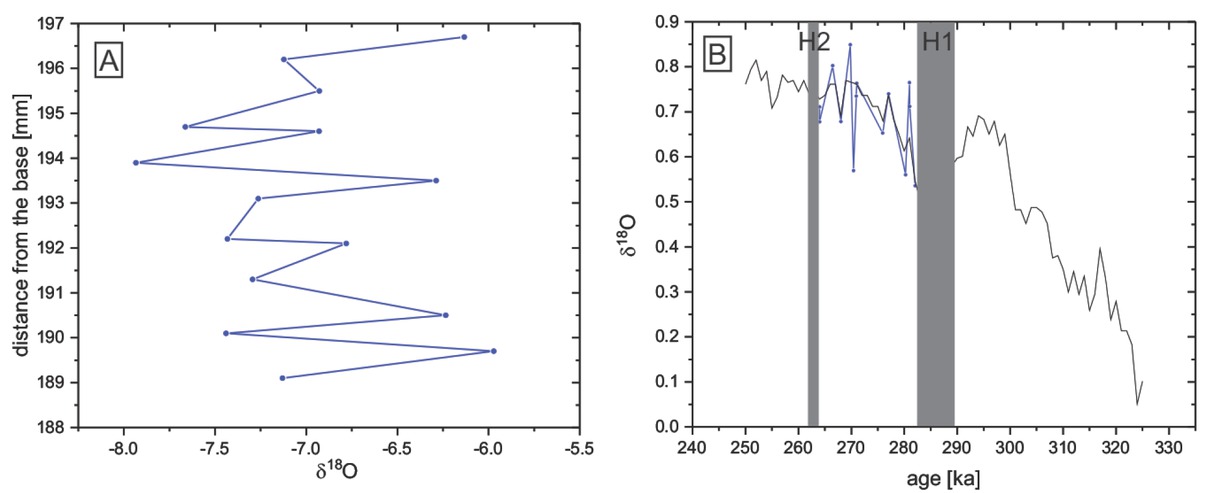
Fig 4
The δ18O data for the SC-3 profile: A – the δ18O record in the depth scale; B – the result of the correlation with the LR04 record.
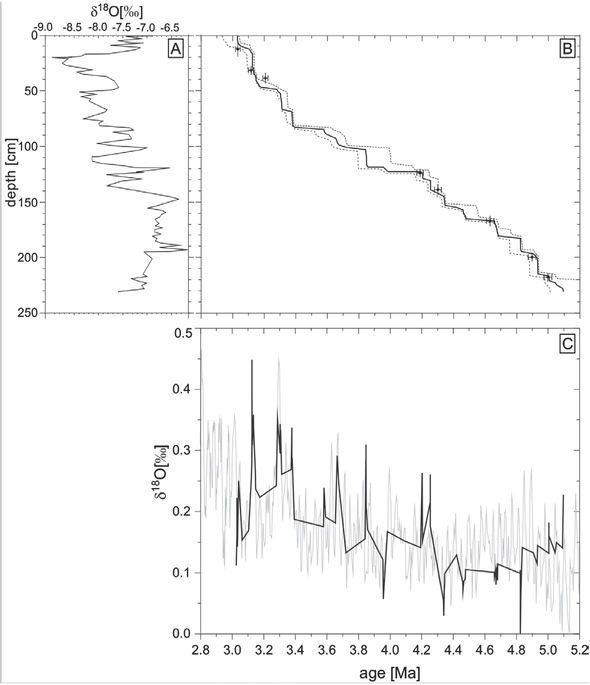
Fig 5
The results of OIS for the LDH profile: A – the δ18O record of the LDH profile in a depth scale; B – age-depth models estimated based on the OIS and the PM approaches (black lines); C – the δ18O record of LDH placed in both age scales and compared with the LR04 record (gray line).
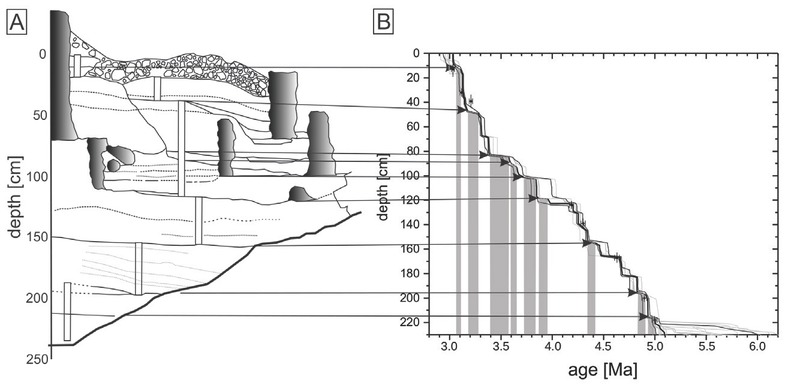
Fig 6
LDH profile: A – sketch of the LDH profile with sampled sections (rectangles) and principal hiatuses (lines); B – the result of OIS and the PM age-depth modeling, with detected hiatuses and their duration (gray rectangles). Arrows show the relation between the hiatuses visible in the profile and the hiatuses detected by the model.
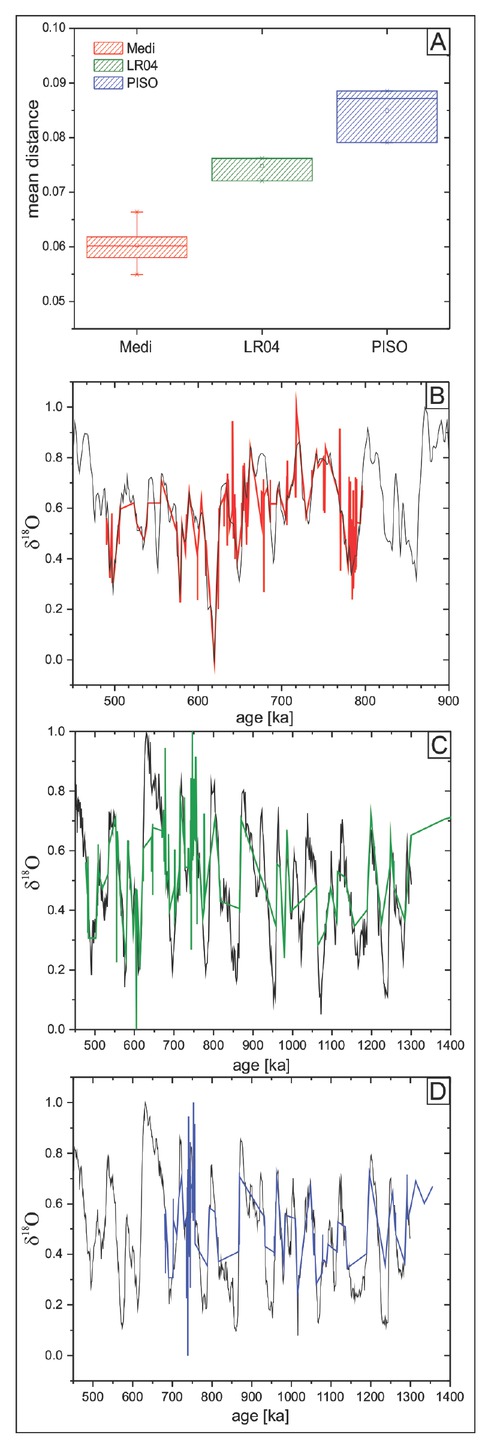
Fig 7
The results of testing reference curves: A – quality indicators for the series of test correlations with different reference curves; B – Reciska Pecina curve correlated with the MEDI curve (Wang et al. 2010); C – Reciska Pecina curve correlated with the LR04 curve (Lisiecki & Raymo 2005); D – Reciska Pecina curve correlated with the PISO curve (Channell et al. 2009).
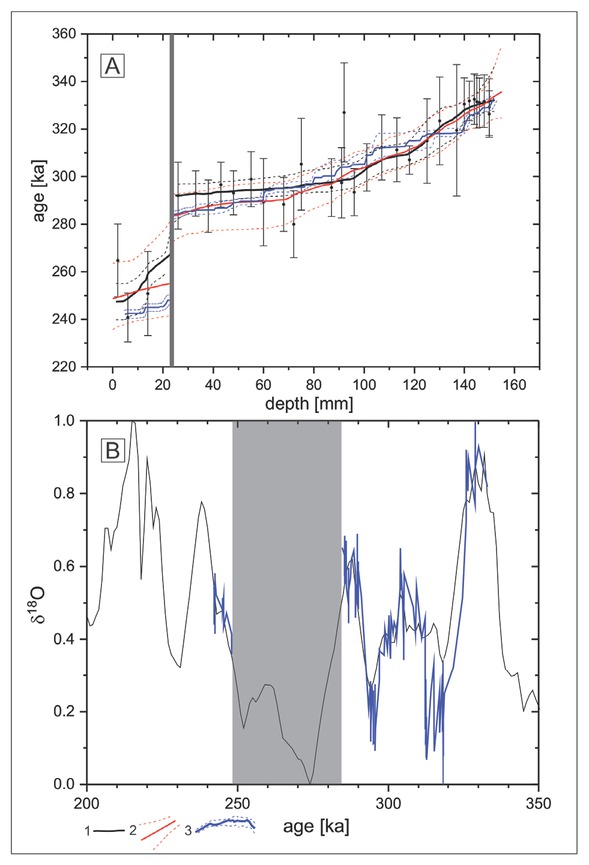
Fig 8
The comparison of age-depth models for stalagmites from an unsurveyed Macedonian cave located near Lake Ohrid (Regattieri et al. 2018): A – the results of age-depth model estimation – (1) age-depth model made by the authors; (2) age-depth model made by MOD-AGE; (3) age-depth model made by the OIS approach; B – the result of the correlation with the MEDI record (Wang et al. 2010).
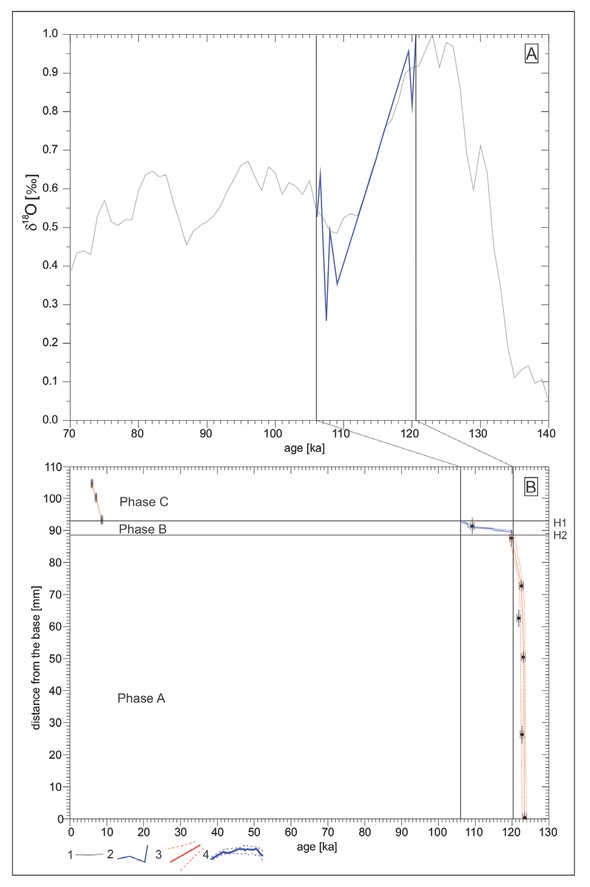
Fig 9
The result of correlation of the DY-1 δ18O record with the LR04 record: A – the δ18O record correlated with LR04; B – age-depth model estimated for phase B (blue lines) and age-depth models estimated for phases A and C based on the U-series ages (data from Jo et al. 2011) – (1) LR04 record; (2) DY-1 δ18O record; (3) age-depth model made by the authors (Jo et al. 2011); (4) age-depth model made by the OIS approach.
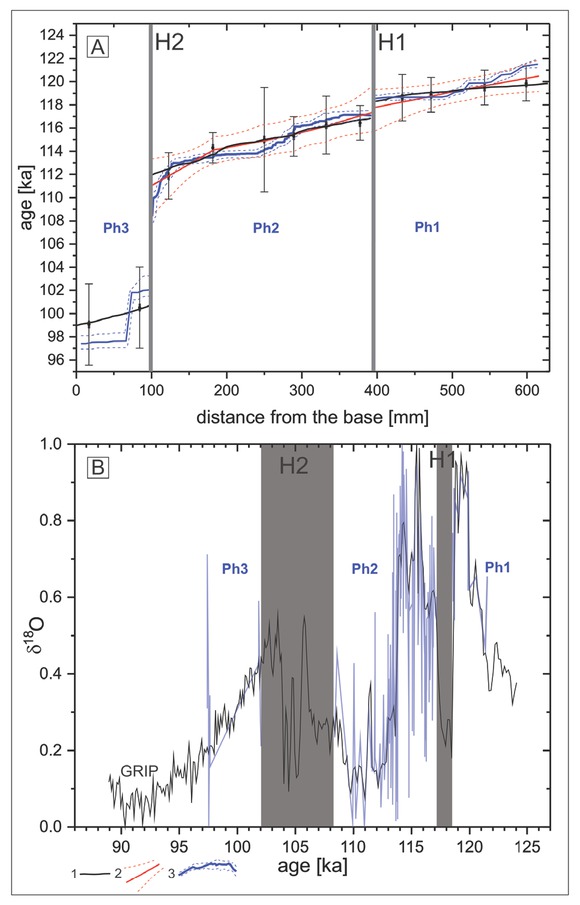
Fig 10
The comparison of age-depth models for stalagmites from Spanish Cobra Cave (Rossi et al. 2014): A – the results of age-depth model estimation – (1) age-depth model made by the authors, fluorescence lamina counting (Fl); (2) age-depth model made by MOD-AGE; (3) age-depth model made by the OIS approach; B – the result of the correlation with the GRIP record.
Table 2
Position of magnetozones in the LDH profile.
| Age* | Polarity | Magnetozone | Paleomagnetic benchmarks | ||
|---|---|---|---|---|---|
| [Ma] | chron* | Symbol | Depth** [cm] | Age*** [Ma] | |
| (2.581–) <3.03 | C2An.1n | N1 | |||
| N1/R1 | 13 ± 4 | 3.03 ± 0.03 | |||
| 3.03–3.12 | C2An.1r | R1 | |||
| R1/N2 | 32 ± 1 | 3.12 ± 0.03 | |||
| 3.12–3.21 | C2An.2n | N2 | N2/R2 | 39 ± 2 | 3.21 ± 0.035 |
| 3.21–3.33 | C2An.2r | R2 | R2/N3 | 53 ± 2 | 3.33 ± 0.035 |
| 3.33–3.60 | C2An.3n | N3 | N3/R3 | 60 ± 1 | 3.60 ± 0.04 |
| 3.60–4.19 | C2Ar | R3 | R3/N4 | 124 ± 1 | 4.19 ± 0.04 |
| 4.19–4.30 | C3n.1n | N4 | N4/R4 | 139 ± 2 | 4.30 ± 0.045 |
| 4.30–4.49 | C3n.1r | R4 | R4/N5 | 151 ± 4 | 4.49 ± 0.045 |
| 4.49–4.63 | C3n.2n | N5 | N5/R5 | 167 ± 2 | 4.63 ± 0.05 |
| 4.63–4.80 | C3n.2r | R5 | R5/N6 | 195 ± 2 | 4.80 ± 0.05 |
| 4.80-4.90 | C3n.3n | N6 | N6/R6 | 200 ± 1 | 4.90 ± 0.05 |
| 4.90–4.98 | C3n.3r | R6 | R6/N7 | 218 ± 1 | 4.98 ± 0.05 |
| >4.98(–5.23) | C3n.4n | N7 | |||
[i] Explanations: N– normal polarity, R– reverse polarity; *after Ogg (2012); ** depth with error; *** age with assumed age uncertainty (for explanations, see the text). PM benchmarks marked as italic are located at hiatuses and were not included into PM+OIS chronology
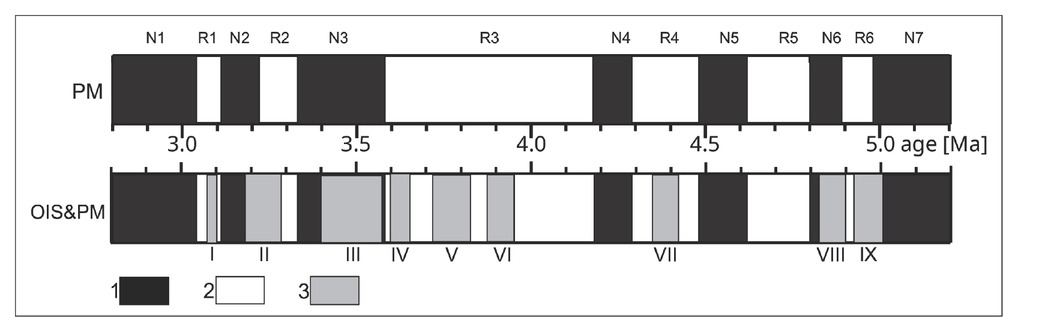
Fig 11
The comparison of the GPTS record (Ogg 2012) with the time scale of the LDH section obtained by integrated OIS and PM chronology: 1 – normal polarity, 2 – reverse polarity, 3 – non-deposition time (hiatus).