
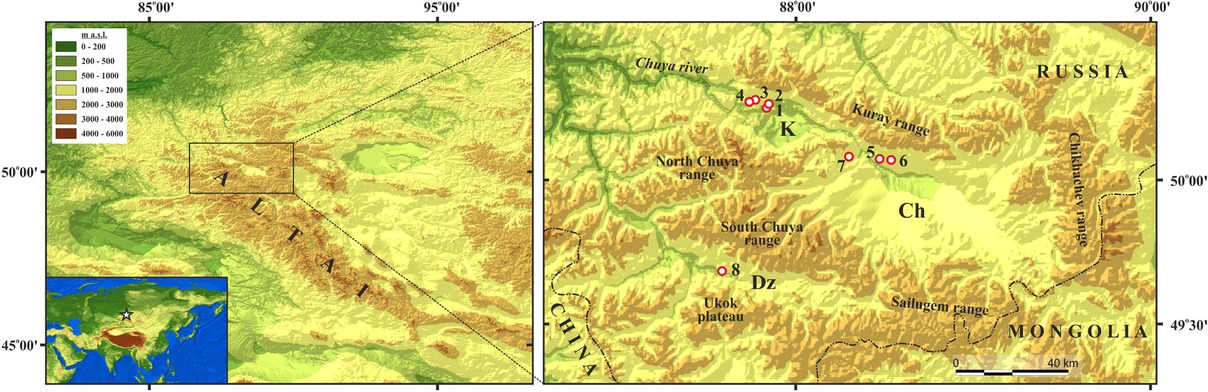
Fig 1
Location of the SE Altai within the Altai Mountains. The acronyms indicate the names of the largest intermountain depressions: Ch – Chuya, K – Kurai; Dz – Dzhazator valley. Red circles show the location of studied sections.
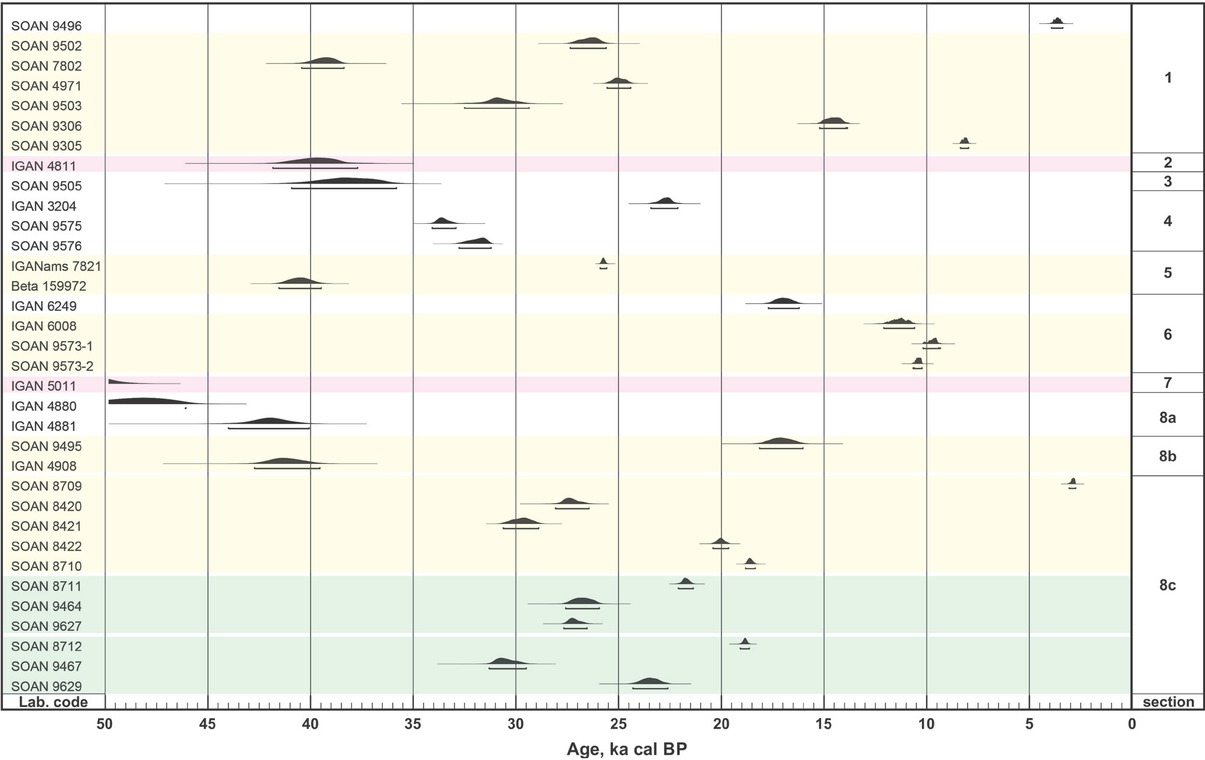
Fig 2
Multiplot view of analyzed radiocarbon ages. Dating results are marked as follows: red – for the samples collected in ancient (Upper Oligocene– Low Miocene peat and brown coal-bearing) deposits; yellow – for the samples collected from the single pack of sediments; and green – for dating results of humic acids obtained from one sample.
Table 1
Radiocarbon dating results. Dating material is marked as co – coal; ha – humic acids; pp – paleopeat; toc – total organic carbon. Dates marked with asterisk are results of dating of humic acids obtained from one sample.
| Laboratory code | Studied sections (fig. 1) | Applied technique | Dating material | 14C yr BP | Cal BP (2σ) | Confidence intervals % | Description |
|---|---|---|---|---|---|---|---|
| SOAN 9496 | 1 | LSC | ha | 3380±115 | 3920-3370 | 95.4 | Fossil soil in subaerial pack above lacustrine deposits |
| SOAN 9502 | 1 | LSC | pp | 22070±450 | 27350-25600 | 95.4 | Inclusions of peat in the upper diluvial pack |
| SOAN 7802 | 1 | LSC | ha | 34750±480 | 40430-38370 | 95.4 | Inclusions diluvial pack of organic matter in the middle part of upper |
| SOAN 4971 | 1 | LSC | ha | 20750±220 | 25560-24410 | 95.4 | Fragment diluvial pack of charcoal (Vysotsky in 2009the middle ) part of upper |
| SOAN 9503 | 1 | LSC | pp | 26715±700 | 32500-29360 | 95.4 | Inclusions of peat at the bottom of the upper diluvial pack |
| SOAN 9306 | 1 | LSC | ha | 12400±195 | 15220-13920 13890-13860 | 94.8 0.6 | Organic fragments in the lower diluvial pack (after Vysotsky in Agatova et al., 2020) |
| SOAN 9305 | 1 | LSC | ha | 7320±110 | 8370-7950 | 95.4 | Organic Vysotsky fragments in Agatova in et the allower ., 2020diluvial ) pack (after |
| IGAN 4811 | 2 | LSC | pp | 35090±950 | 41830-37700 | 95.4 | Upper Formation Oligocene–Low Miocene peat of Koshagach |
| SOAN 9505 | 3 | LSC | ha | 33790±1095 | 40930-35820 | 95.4 | Thin flowing peat paleolake layer in sediments of the Early Holocene |
| IGAN 3204 | 4 | LSC | ha | 18800±270 | 23420-22110 | 95.4 | Upper peat layer (after Rogozhin et al. 2008) |
| SOAN 9575 | 4 | LSC | ha | 29375±285 | 34070-32910 | 95.4 | Middle peat layer |
| SOAN 9576 | 4 | LSC | ha | 27970±320 | 32760-31200 | 95.4 | Lower peat layer |
| SOAN 9689 | 5 | LSC | ha | - | - | - | Silt loams at the same location as Beta 159972 sample (not enough material – 0.4g of ha from a 3-kg sample) |
| IGANAMS 7821 | 5 | AMS | toc | 21410±60 | 25900-25580 | 95.4 | Silt loams at the same location as Beta 159972 sample |
| Beta 159972 | 5 | AMS | ha | 35870±490 | 41540-39470 | 95.4 | Layer profile of (Herget, organic 2005 sediment, ) probably part of paleosol |
| IGAN 6249 | 6 | LSC | ha | 13990±270 | 17710-16210 | 95.4 | Horizon [В] of fossil soil at the bottom of proluvial–colluvial pack |
| IGAN 6008 | 6 | LSC | co | 9830±230 | 12100-10580 | 95.4 | Lens of charcoals under fossil soil |
| SOAN 9573-1 | 6 | LSC | co | 8635±150 | 101809350--9400 9330 | 95.1 0.3 | Lens of charcoals under fossil soil |
| SOAN 9573-2 | 6 | LSC | ha | 9220±95 | 1066010610--10620 10220 | 1.9 93.5 | Matrix in lens of charcoals under fossil soil |
| IGAN 5011 | 7 | LSC | co | 50120±2300 | - | - | Upper shagach Oligocene–Formation Low from Miocene Taldy–Dyurgun brown coal deposit of Ko |
| IGAN 4880 | 8a | LSC | pp | 44790±1400 | - | - | Upper layer of brown coal |
| IGAN 4881 | 8a | LSC | co | 37570±1100 | 44000-40060 | 95.4 | Lower layer of brown coal |
| SOAN 9495 | 8b | LSC | pp | 14085±400 | 18140-16020 | 95.4 | Upper horizon (among three) interlayers within the peat |
| IGAN 4908 | 8b | LSC | pp | 36680±910 | 42730-39550 | 95.4 | Lower horizon (among three) interlayers within the peat |
| SOAN 8709 | 8c | LSC | ha | 2760±80 | 3070-2740 | 95.4 | Upper partly exhumed at the surface organic mineral layer |
| SOAN 8420 | 8c | LSC | ha | 23100±415 | 28080-26440 | 95.4 | |
| SOAN 8421 | 8c | LSC | ha | 25530±355 | 30620-28880 | 95.4 | |
| SOAN 8422 | 8c | LSC | ha | 16600±140 | 20410-19640 | 95.4 | |
| SOAN 8710 | 8c | LSC | ha | 15330±110 | 18820-18340 | 95.4 | |
| SOAN 8711* | 8c | LSC | ha | 17940±120 | 22090-21370 | 95.4 | Layers of organic mineral matter with inclusions of |
| organic material (mainly fragments of peat and some- | |||||||
| SOAN 9464* | 8c | LSC | ha | 22475±450 | 27570-25940 | 95.4 | times lignitized wood) affected by solifluction |
| SOAN 9627* | 8c | LSC | ha | 22880±280 | 27670-26540 | 95.4 | |
| SOAN 8712** | 8c | LSC | ha | 15600±100 | 19080-18630 | 95.4 | |
| SOAN 9467** | 8c | LSC | ha | 26400±500 | 31300-29500 | 95.4 | |
| SOAN 9629** | 8c | LSC | ha | 19480±360 | 24310-22600 | 95.4 |
Table 2
OSL dating results. The dose rate was determined based on the radioisotope content measurements. The equivalent doses were calculated using central age model (Galbraith et al., 1999). OSL age is given with 1σ standard deviation except samples GdTL 3125 and GdTL 3126 (2σ).
| Laboratory code | Sample location (fig. 1) | U (Bq/kg) | Th (Bq/kg) | K (Bq/kg) | Dose rate (Gy/ka) | Equivalent dose (Gy) | OSL Age (ka) | Number of aliquots | Water content | Sample description |
|---|---|---|---|---|---|---|---|---|---|---|
| GdTL 2590 | 1 | 29.1±0.8 | 22.4±0.5 | 434±14 | 2.21±0.08 | 42.0±1.8 | 19.0±1.1 | 13 | 18±5% | Sandy layer at the top of cross-bedded diluvial pack (Fig. 3) |
| GdTL 2591 | 1 | 25.3±0.6 | 20.0±0.4 | 485±15 | 2.23±0.08 | 35.9±3.5 | 16.0±1.7 | 20 | 18±5% | Sandy zons of layer loams between (Fig. 3) hori- |
| GdTL 3125 | 3 | 16.6±0.4 | 21.4±0.6 | 480±23 | 2.06±0.09 | 19.6±1.5 | 9.41±1.68 | 12 | 18±5% | Lacustrine peaty layer sands (Fig. below 5) the |
| GdTL 3126 | 3 | 17.3±0.4 | 21.9±0.7 | 486±26 | 2.11±0.09 | 23.6±1.5 | 11.12±1.74 | 14 | 18±5% | Lacustrine peaty layer sands (Fig. above 5) the |
| GdTL 3424 | 5 | 17.2±0.8 | 24.0±1.2 | 501±42 | 2.20±0.18 | 81.2±2.7 | 37.0±3.1 | 27 | 15±5% | Sandy of sliding layer proluvium at the bottom (Fig. 7) |
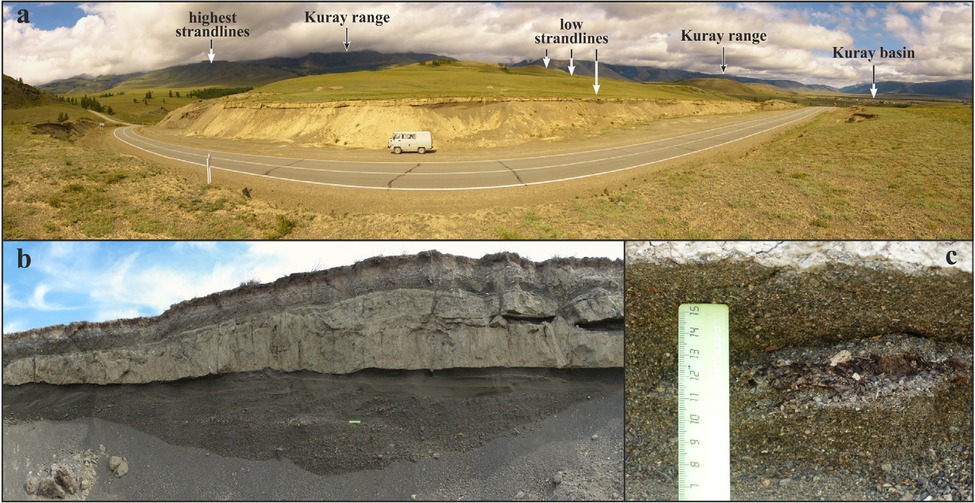
Fig 3
Geomorphological position of Section 1 (a), west–east stretch of sediments (b) along the roadcut in a strandline at altitude of ~1570 m a.s.l. and numerous fragments of organic matter (c) presented in diluvial deposits as inclusions. Field car is 2 m high and 4 m long.
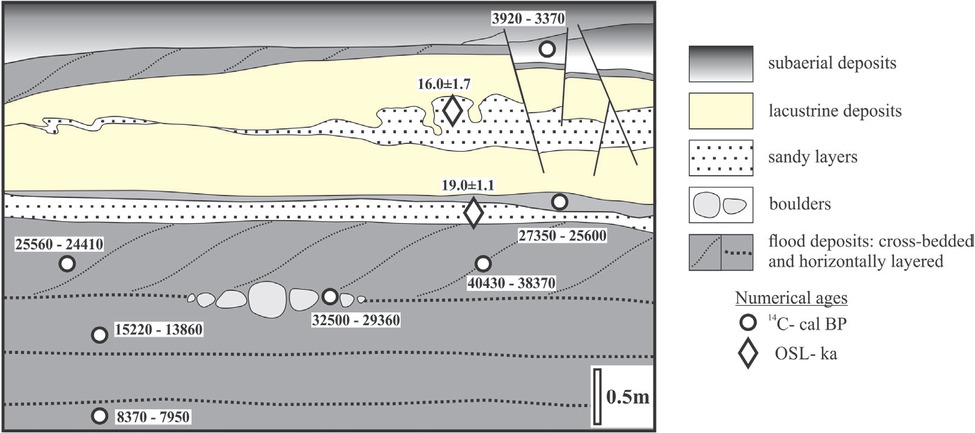
Fig 4
Generalized scheme of sedimentary records in Section 1 and available numerical ages.
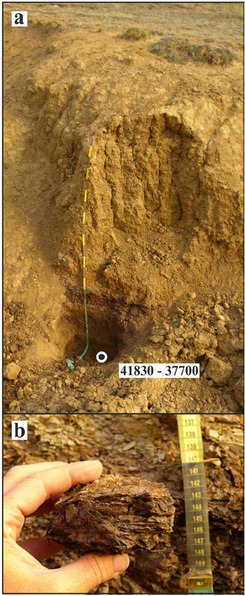
Fig 5
The Upper Oligocene–Low Miocene peat and brown coal-bearing deposits exposed in Section 2. General view of the outcrop in a dry gully (a) and sample of ancient peats from the lower part of the section (b).
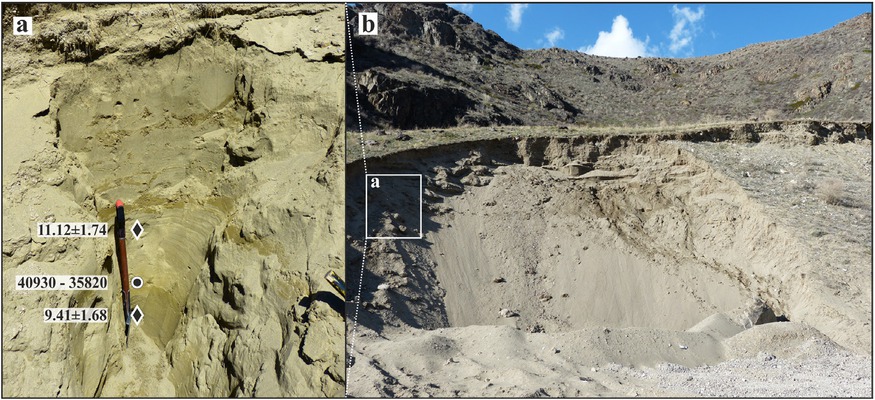
Fig 6
General view of the outcrop (b), exposed sediments, and obtained numerical ages (b) for Section 3. Sample location and calculated ages are indicated by rectangle for OSL (ka) and by circle for 14C (cal BP) dates.
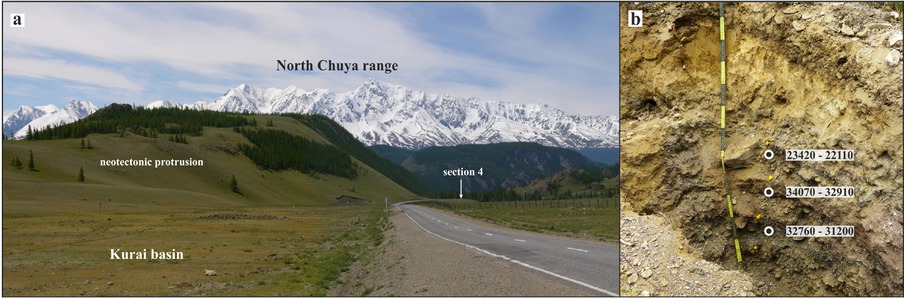
Fig 7
Geomorphological position of Section 4 (a). View to southwest along the “Chuya-highway”. North Chuya range in the background. Exposed sediments and available radiocarbon dates for peaty-rich layers (b).
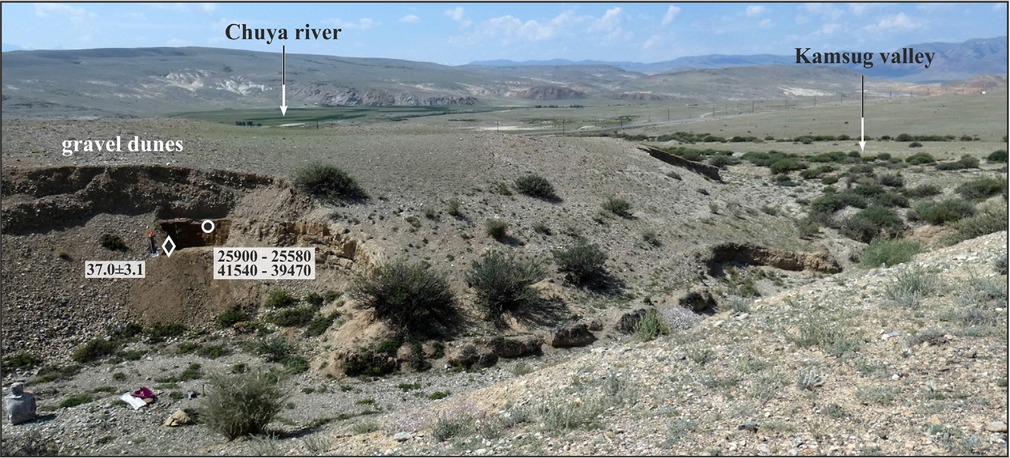
Fig 8
Geomorphological position of Section 5. Sample location and obtained numerical ages are indicated by rectangle for OSL (ka) and by circle for 14C (cal BP) dates.
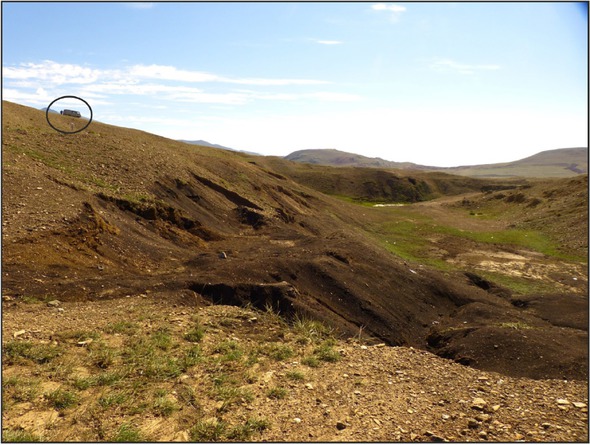
Fig 9
Taldy–Dyurgun brown coal deposit.
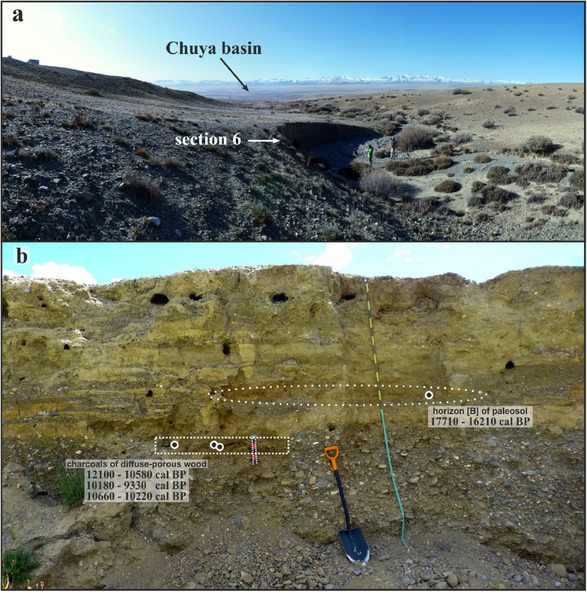
Fig 10
Geomorphological position (a), exposed sediments, and obtained radiocarbon ages (b) for Section 6.
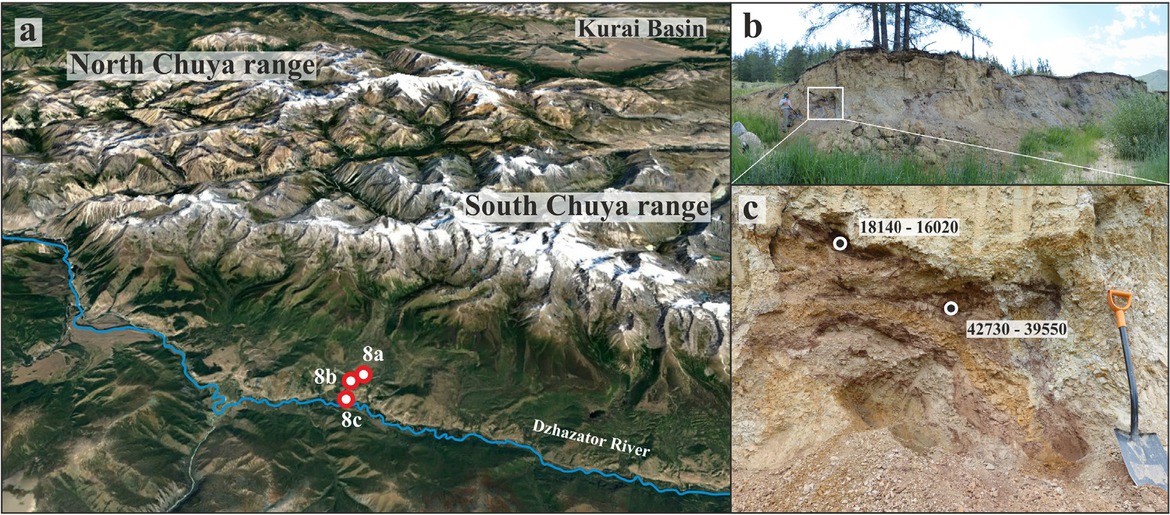
Fig 11
Google image of studied sites in the Dzhazator River valley (a); exposed sediments and obtained radiocarbon ages for Section 8b (b, c).
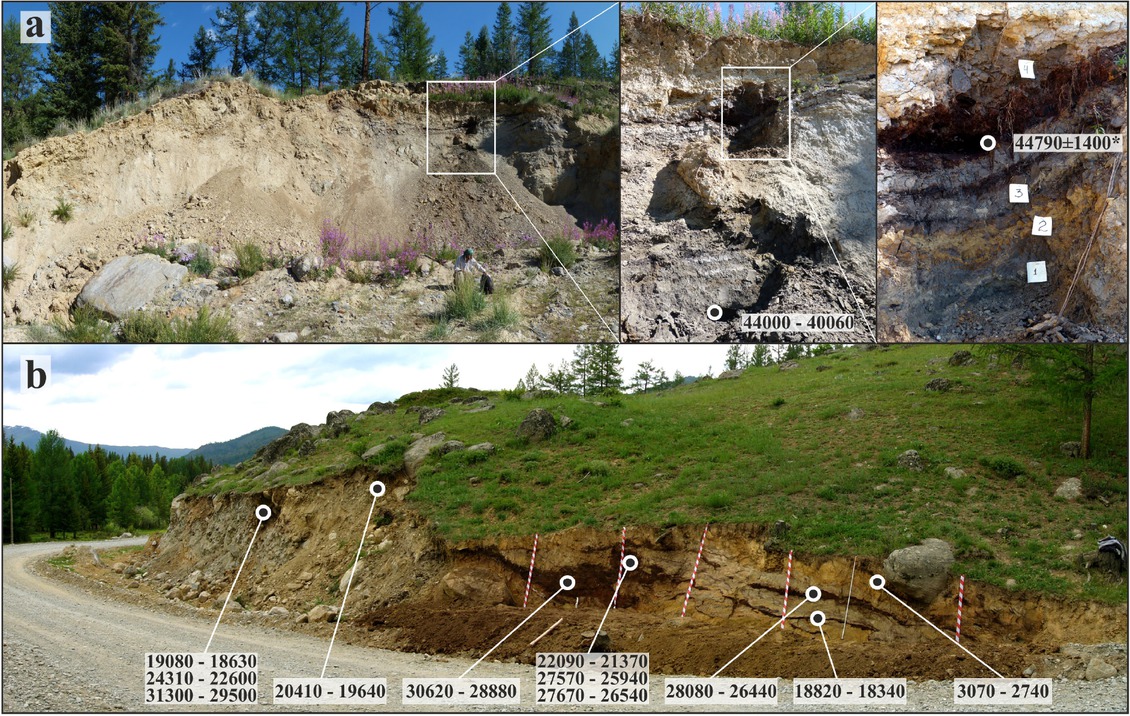
Fig 12
Exposed sediments and obtained radiocarbon ages for Section 8c (a); redeposited organic mineral material and obtained radiocarbon ages for Section 8a (b).
* indicates uncalibrated 14C age for sample IGAN 4880 (see Table 1)