
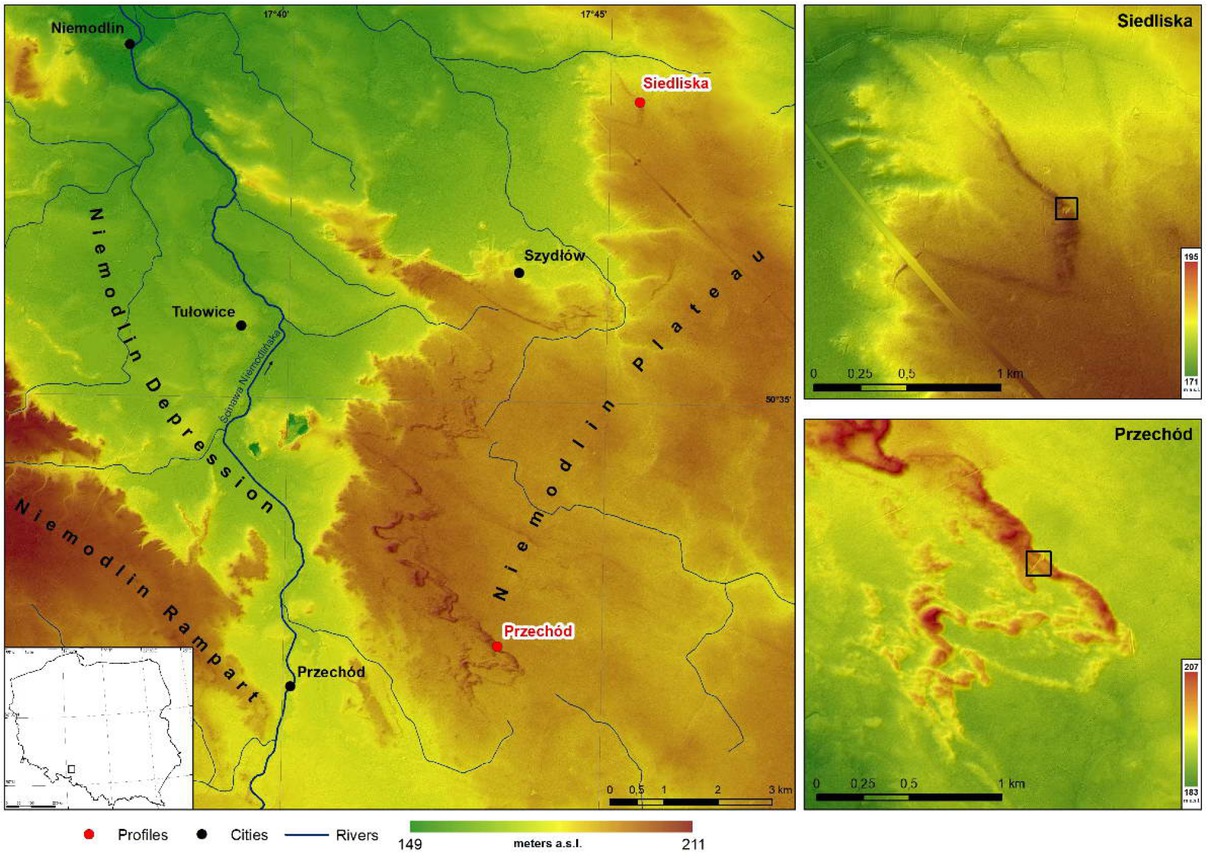
Fig 1
Microregions of the Niemodlin Plain and location of investigated sites, Siedliska and Przechód, with digital elevation model (DEM).
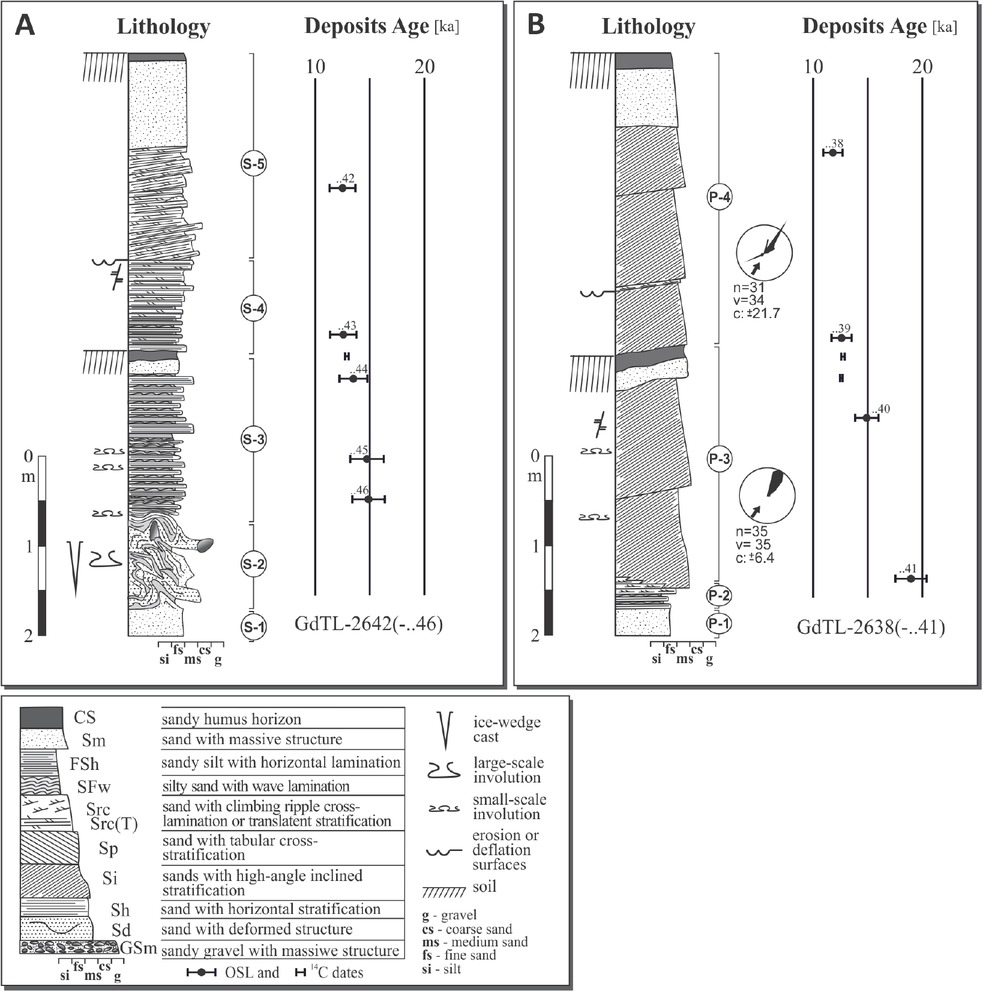
Fig 2
Sedimentary succession, radiocarbon and OSL ages of deposits at Siedliska (A) and Przechód (B) sites.
Table 1
Basic information about investigated samples. Dose rate values obtained with different system detectors and final Bayesian estimation. Final obtained age using CAM model.
| Sampling depth | Dose rate (Gy/ka) | ||||||
|---|---|---|---|---|---|---|---|
| Lab.code | Sample ID | (cm) | Water content (%) | Gamma spectrometry | μDose system | Bayesian averaging | OSL age (ka) |
| GdTL-2638 | Przechód_12 | 120 | 7±3 | 1.06±0.08 | 0.88±0.07 | 0.98±0.05 | 11.85±0.91 |
| GdTL-2639 | Przechód_36 | 360 | 7±3 | 0.90±0.07 | 0.89±0.07 | 0.89±0.04 | 12.68±1.00 |
| GdTL-2640 | Przechód_45 | 450 | 7±3 | 0.81±0.06 | 0.58±0.06 | 0.74±0.04 | 14.88±1.11 |
| GdTL-2641 | Przechód_60 | 600 | 7±3 | 0.74±0.05 | 0.62±0.06 | 0.70±0.04 | 18.96±1.46 |
| GdTL-2642 | Siedliska_150 | 150 | 7±3 | 0.94±0.07 | 0.85±0.07 | 0.92±0.05 | 12.39±0.98 |
| GdTL-2643 | Siedliska_320 | 320 | 7±3 | 0.90±0.07 | 0.91±0.07 | 0.90±0.05 | 12.47±1.04 |
| GdTL-2644 | Siedliska_365 | 365 | 7±3 | 1.33±0.10 | 1.34±0.08 | 1.35±0.06 | 13.21±1.04 |
| GdTL-2645 | Siedliska_425 | 425 | 7±3 | 1.11±0.09 | 1.08±0.07 | 1.10±0.06 | 14.26±1.27 |
| GdTL-2646 | Siedliska_450 | 450 | 7±3 | 1.37±0.11 | 1.33±0.08 | 1.37±0.07 | 14.50±1.21 |
Table 2
Calibrated 14C ages of charcoals. The age was calibrated using OxCal program v4.2, (Bronk Ramsey, 2009 and Southon et al., 2013) with calibration curve IntCal13 (Reimer et al., 2013).
| No. | Sample name | Age 14C (BP) | Range of calendar (calibrated) age 68% confidence level | Range of calendar (calibrated) age 95% confidence level |
|---|---|---|---|---|
| 1 | Przechód _top | 11270 ± 170 | 13320BP - 12960BP | 13450BP - 12780BP |
| 2 | Przechód_bottom | 10780 ± 80 | 12750BP - 12640BP | 12810BP - 12560BP |
| 3 | Siedliska | 10915 ± 45 | 12800BP - 12730BP | 12880BP - 12700BP |
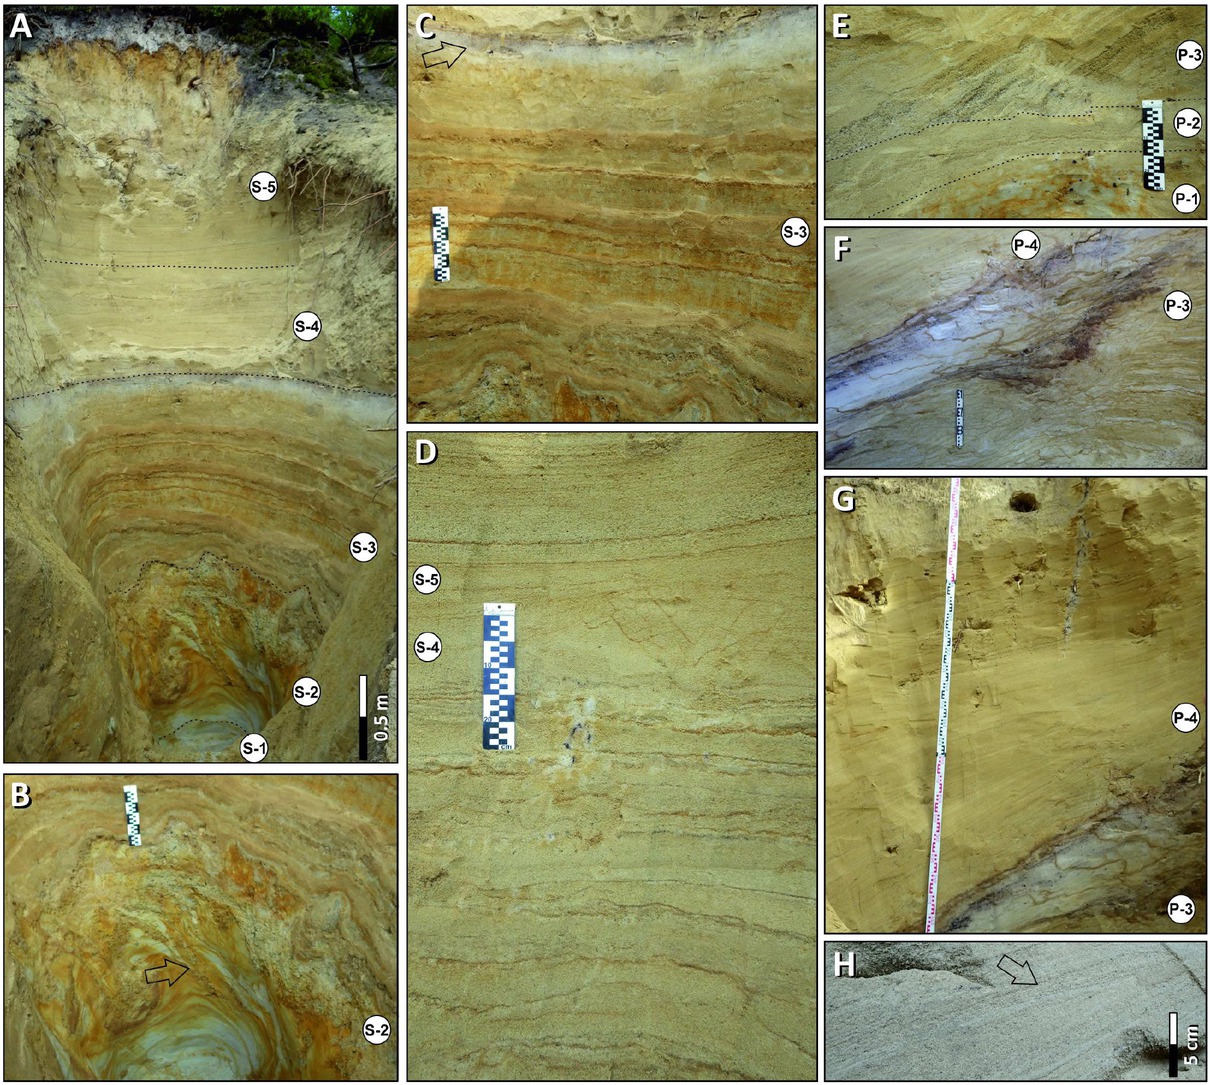
Fig 3
Depositional succession at Siedliska (A-D) and Przechód (E-H) sites: A – general view at the Siedliska site; B – S-2 unit with large-scale involutions and ice-wedge cast (arrow); C – fluvio-aeolian deposits (S-3 unit) with the fossil soil (arrow) in top of unit; D – aeolian deposits within coversand (S-4 unit) and stoss slope of dune (S-5 unit); E – top of P-1 unit, and aeolian deposits within coversand and bottom part of moving dune lee slope; F – soil within the lee slope of dune (top of P-3 unit); G – aeolian deposits within arm of dune (P-4 unit); H – climbing ripple lithofacies (arrow), deposited up the lee slope.
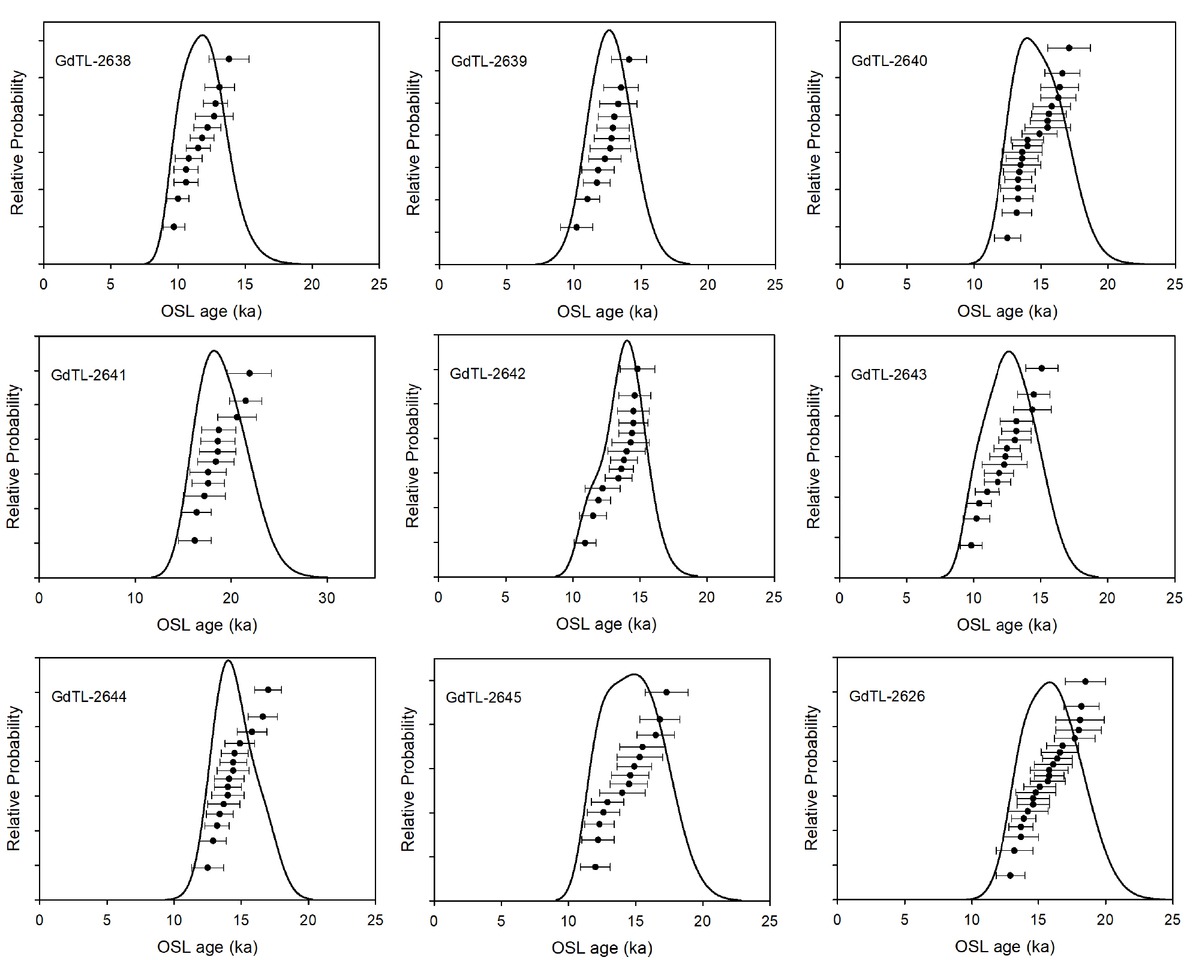
Fig 4
Relative probability density functions (Berger 2010) for all samples are presented on the scale of age.
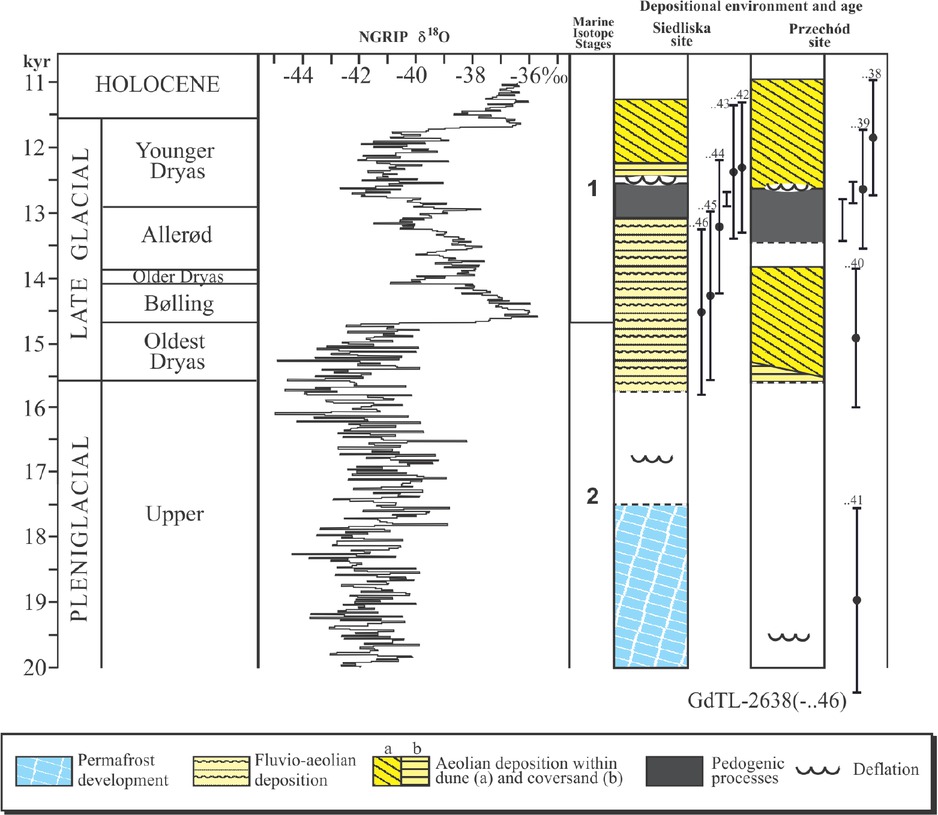
Fig 5
Model of environmental changes at the turn of Weichselian Pleniglacial and Late Glacial; 18O/16O ratio after Rasmussen et al. (2014), chronostratigraphy after Vandenberghe et al. (2013).